
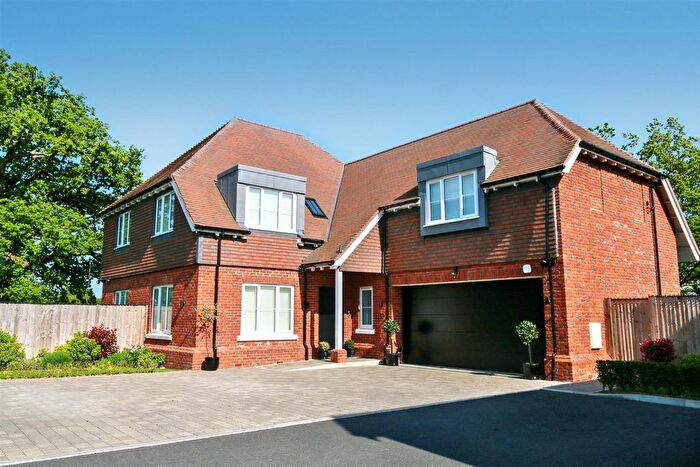
Houses for sale & to rent in Shenley, Borehamwood
House Prices in Shenley
Properties in Shenley have an average house price of £505k and had 1 Property Transaction within the last 3 years¹.
Shenley is an area in Borehamwood, Hertfordshire with 82 households², where the most expensive property was sold for £505k.
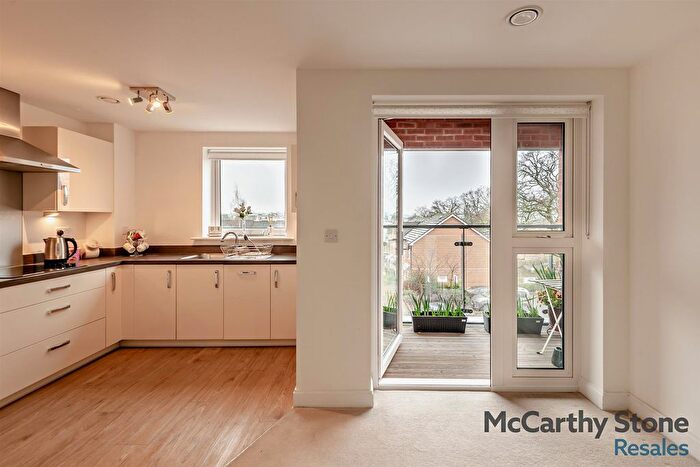
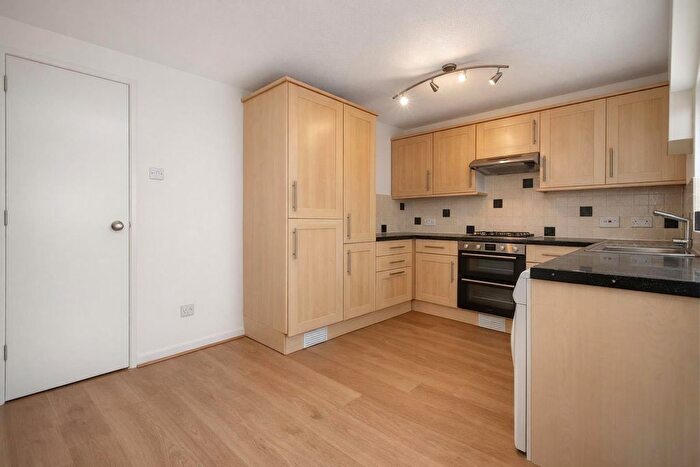
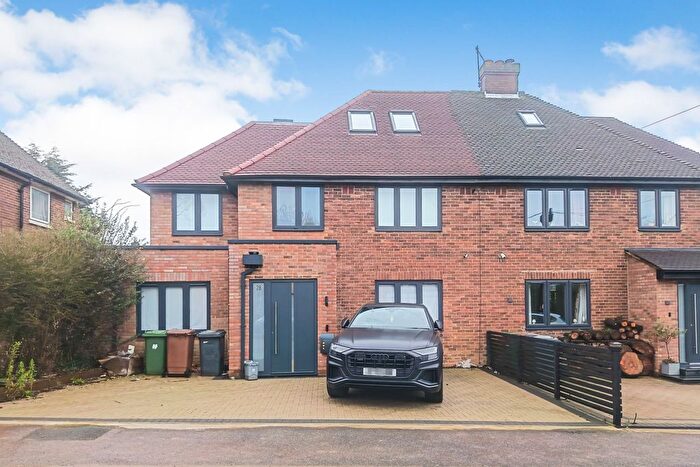
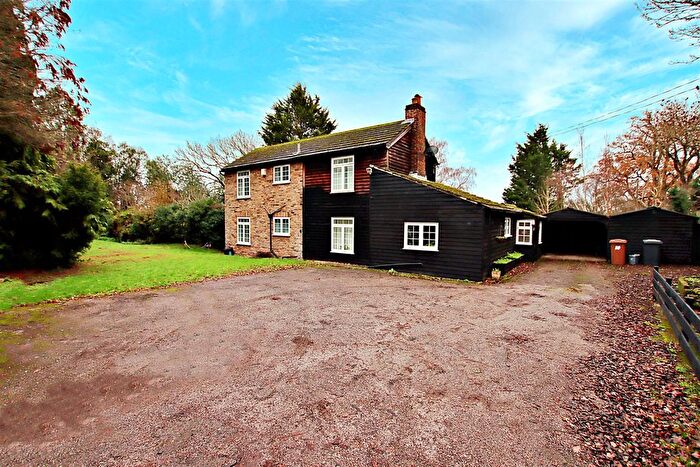
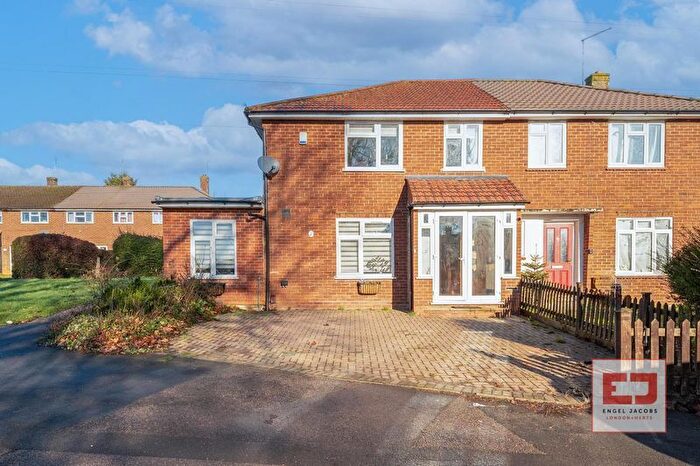
Properties for sale in Shenley
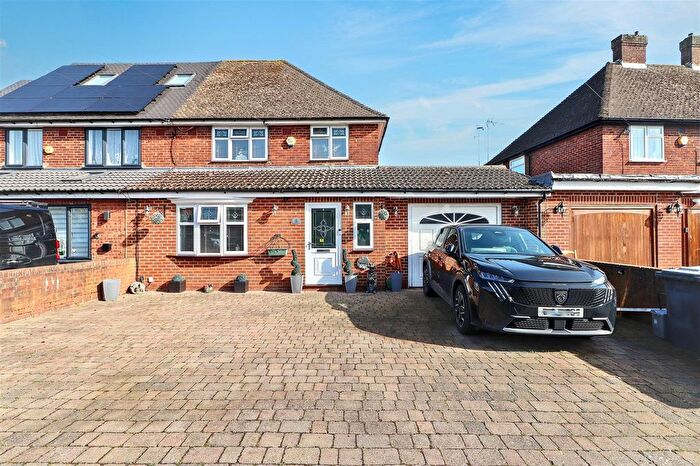
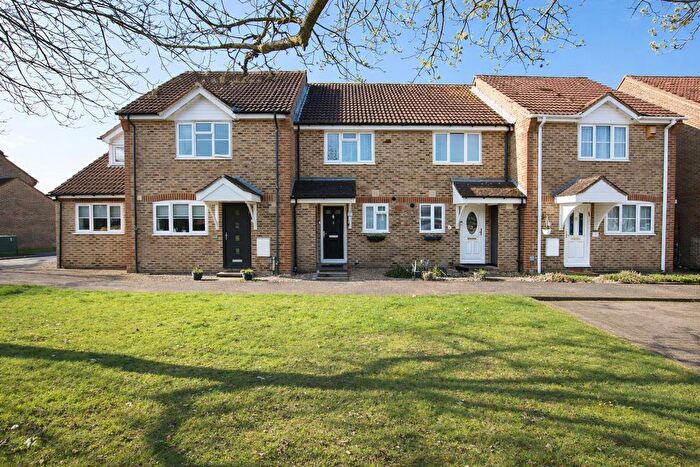
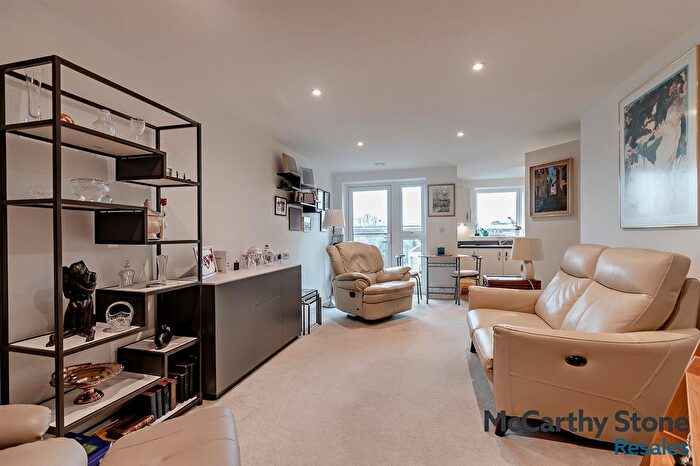
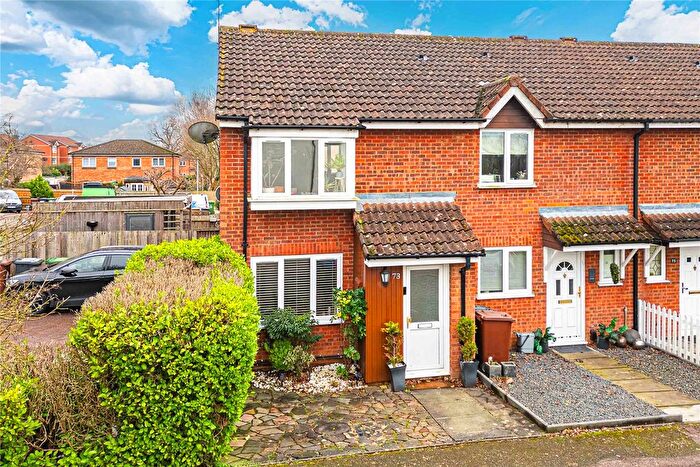
![]()
If you are looking to sell your house, let it out, or receive a property valuation, an expert can help you.
Click the button below to get started.
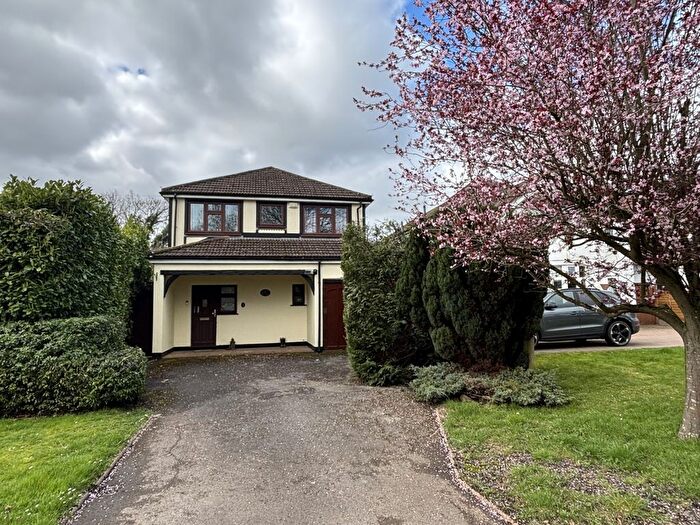
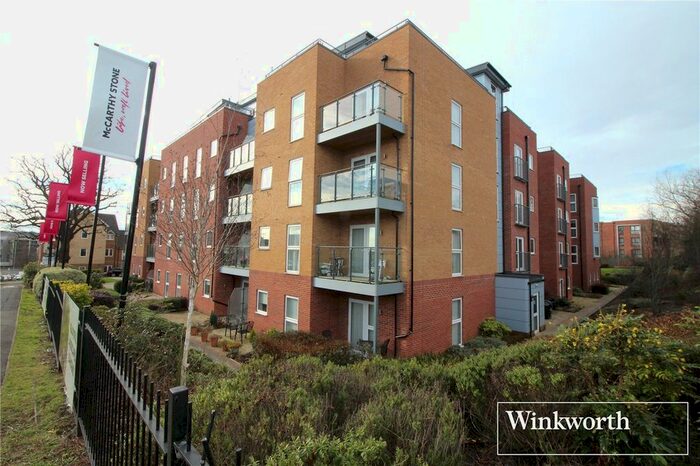
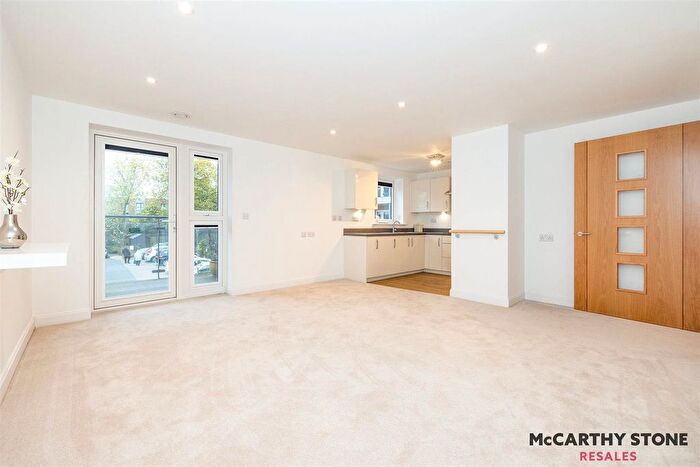
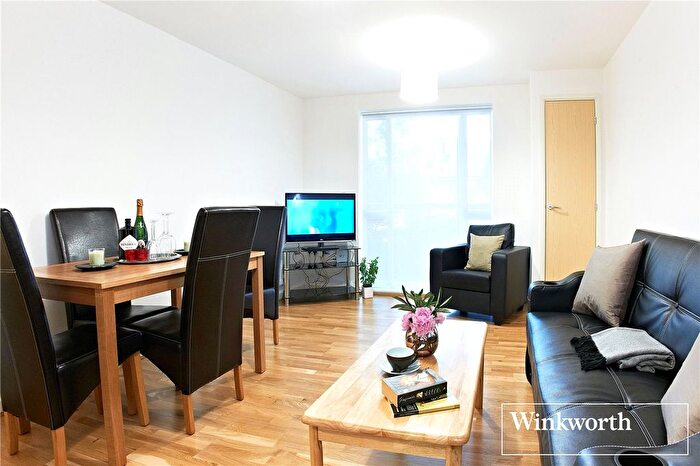
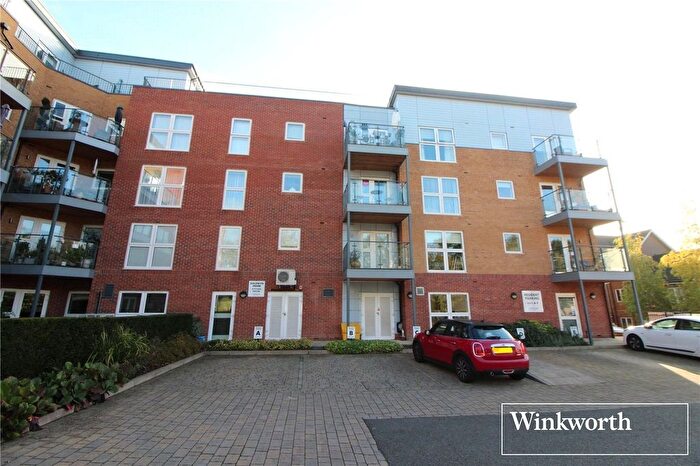
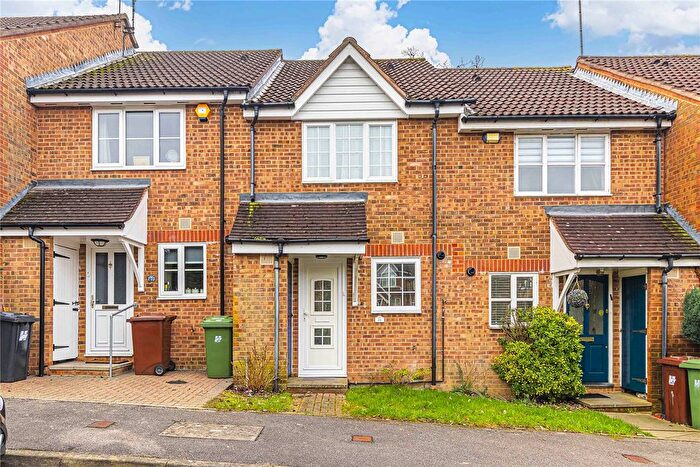
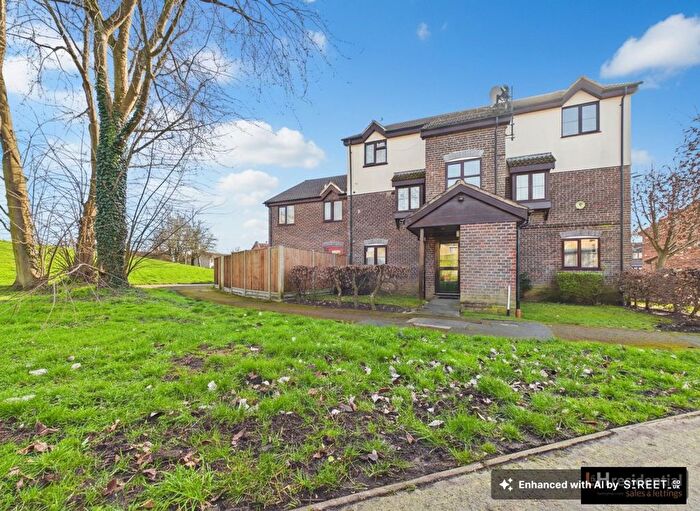
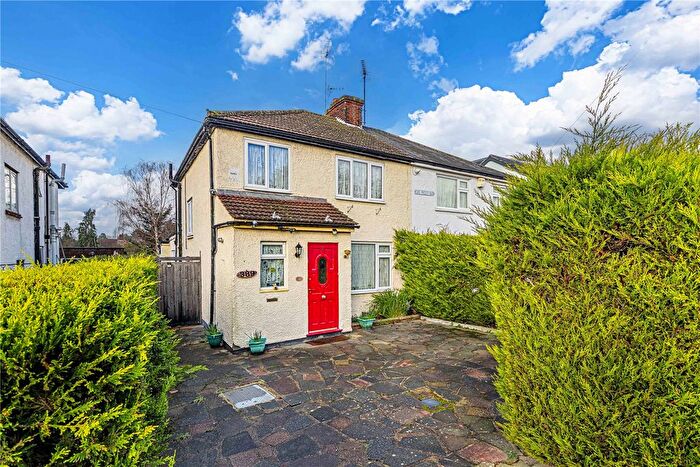
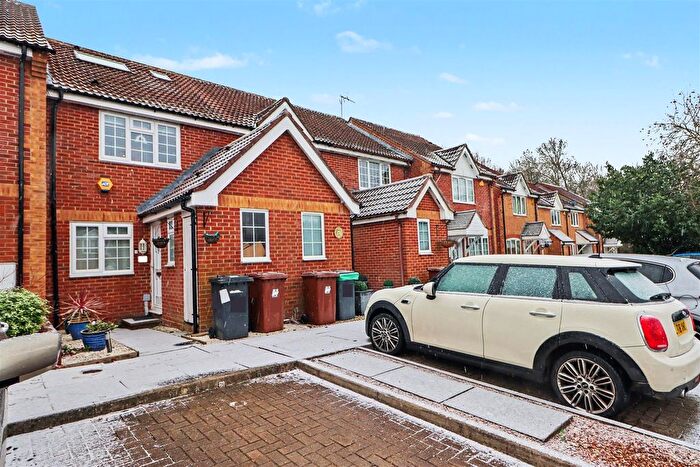
Previously listed properties in Shenley
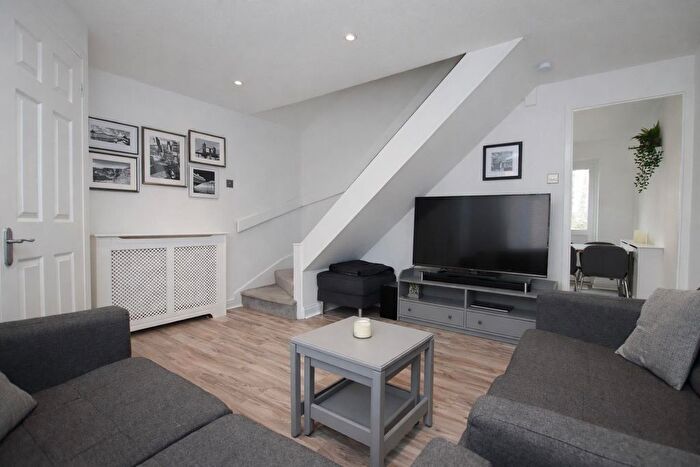
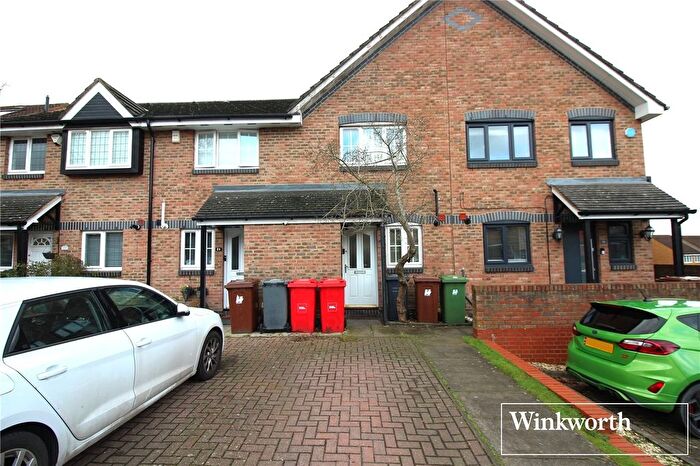
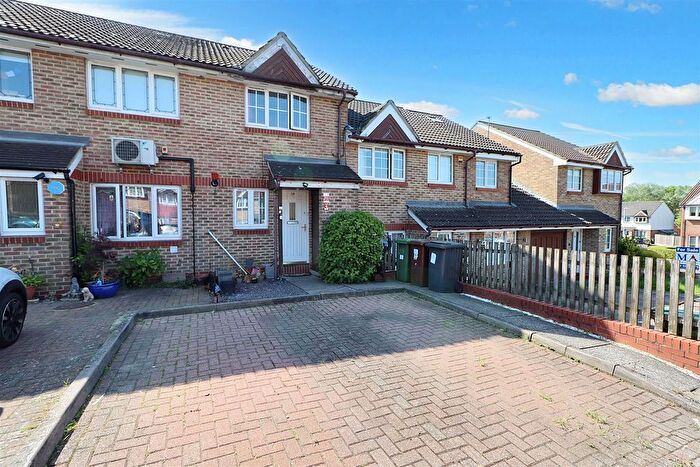
![]()
If you are looking to sell your house, let it out, or receive a property valuation, an expert can help you.
Click the button below to get started.
Roads and Postcodes in Shenley
Navigate through our locations to find the location of your next house in Shenley, Borehamwood for sale or to rent.
| Streets | Postcodes |
|---|---|
| Bridle Close | WD6 5QA |
| Buckettsland Lane | WD6 5PN WD6 5PS |
| Cowley Hill | WD6 5LG WD6 5NB |
| Crossoaks Lane | WD6 5PH WD6 5PP |
| Green Street | WD6 5NE WD6 5NF |
| Rowley Lane | WD6 5PF |
| Silver Hill | WD6 5PW |
| Summerswood Lane | WD6 5PG WD6 5PQ |
| Well End | WD6 5PR WD6 5PJ |
| WD6 5PL |
Transport near Shenley

- FAQ
- Price Paid By Year
- Property Type Price
Frequently asked questions about Shenley
What is the average price for a property for sale in Shenley?
The average price for a property for sale in Shenley is £505,000. This amount is 5% lower than the average price in Borehamwood. There are 272 property listings for sale in Shenley.
Which train stations are available in or near Shenley?
Some of the train stations available in or near Shenley are Elstree and Borehamwood and Radlett.
Property Price Paid in Shenley by Year
The average sold property price by year was:
| Year | Average Sold Price | Price Change |
Sold Properties
|
|---|---|---|---|
| 2023 | £505,000 | -63% |
1 Property |
| 2022 | £825,000 | 40% |
1 Property |
| 2021 | £491,250 | -119% |
4 Properties |
| 2020 | £1,073,750 | 37% |
2 Properties |
| 2016 | £680,000 | 48% |
1 Property |
| 2015 | £351,000 | -71% |
1 Property |
| 2013 | £600,000 | 58% |
1 Property |
| 2011 | £249,950 | -98% |
1 Property |
| 2010 | £494,333 | -54% |
3 Properties |
| 2009 | £760,000 | 70% |
1 Property |
| 2008 | £230,000 | 4% |
1 Property |
| 2007 | £221,333 | 43% |
3 Properties |
| 2006 | £127,000 | -51% |
1 Property |
| 2004 | £192,000 | 38% |
1 Property |
| 2003 | £119,250 | -52% |
1 Property |
| 2002 | £181,000 | 56% |
1 Property |
| 2001 | £80,000 | 39% |
1 Property |
| 1999 | £48,500 | -811% |
1 Property |
| 1998 | £442,000 | 54% |
1 Property |
| 1997 | £202,316 | 78% |
3 Properties |
| 1996 | £44,000 | - |
1 Property |
Property Price per Property Type in Shenley
Here you can find historic sold price data in order to help with your property search.
The average Property Paid Price for specific property types in the last three years are:
| Property Type | Average Sold Price | Sold Properties |
|---|---|---|
| Detached House | £505,000.00 | 1 Detached House |