
Houses for sale & to rent in Marshalswick South, St Albans
House Prices in Marshalswick South
Properties in Marshalswick South have an average house price of £914k and had 263 Property Transactions within the last 3 years¹.
Marshalswick South is an area in St Albans, Hertfordshire with 2,683 households², where the most expensive property was sold for £5M.
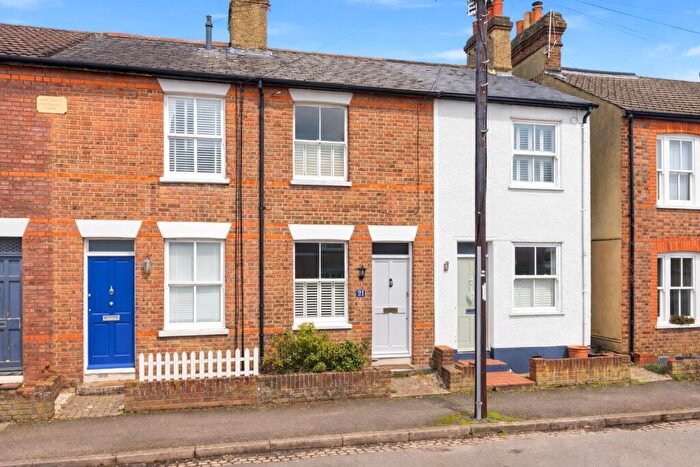
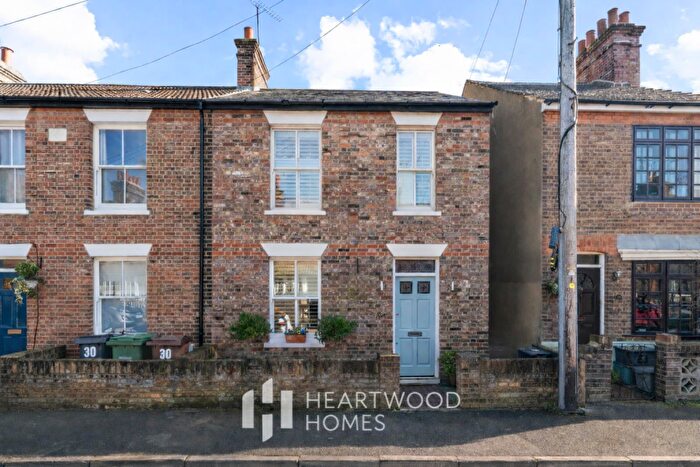
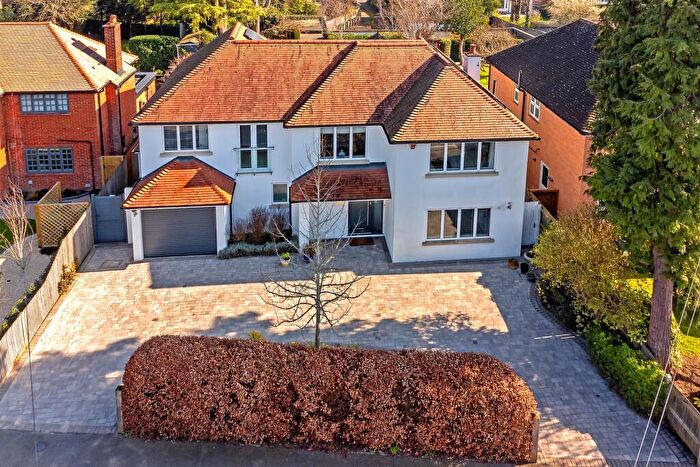
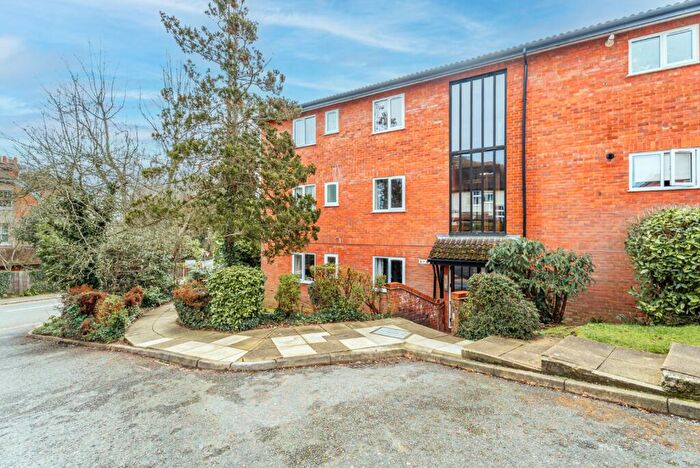
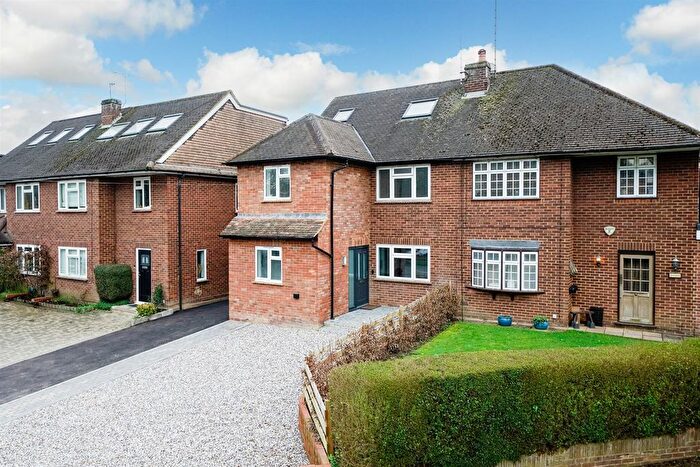
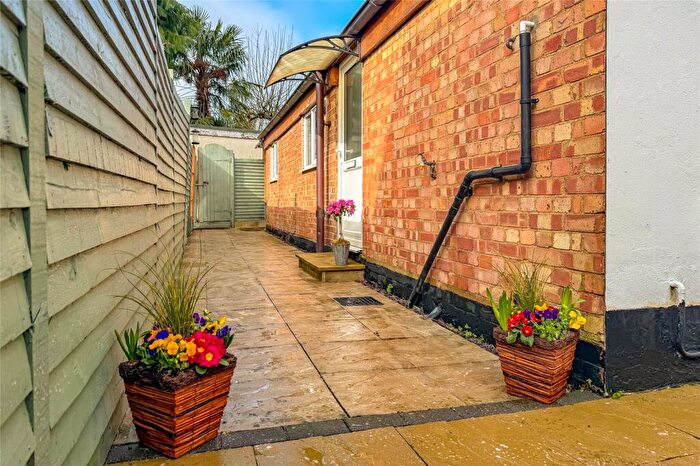
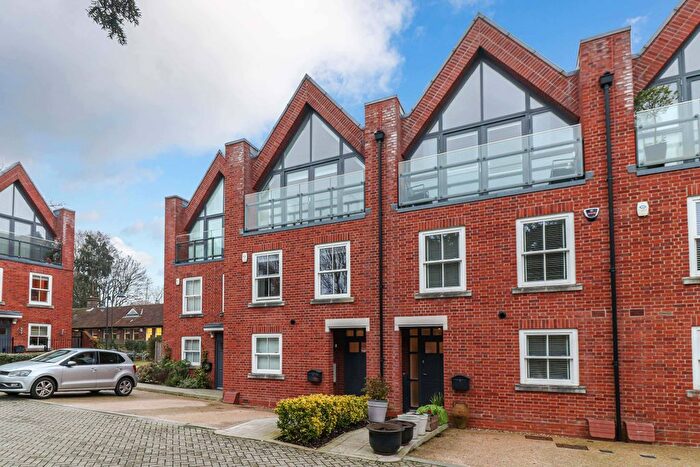
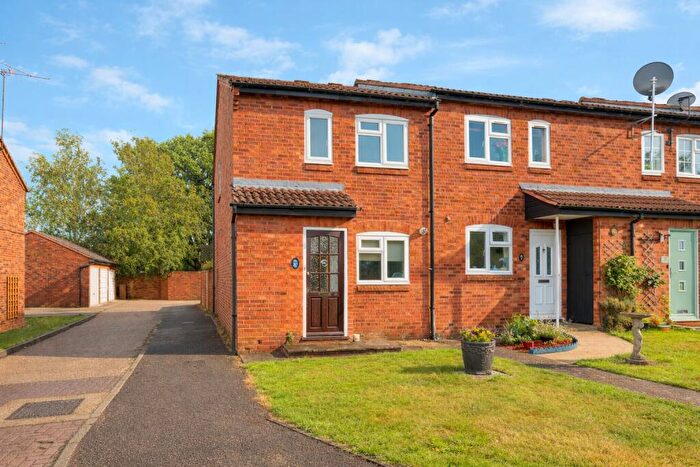
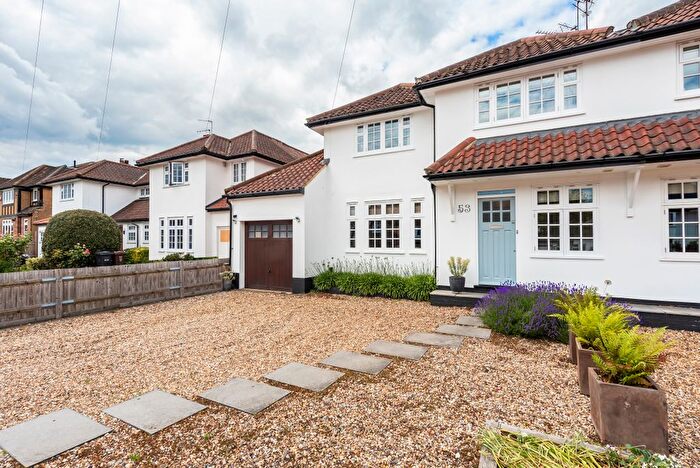
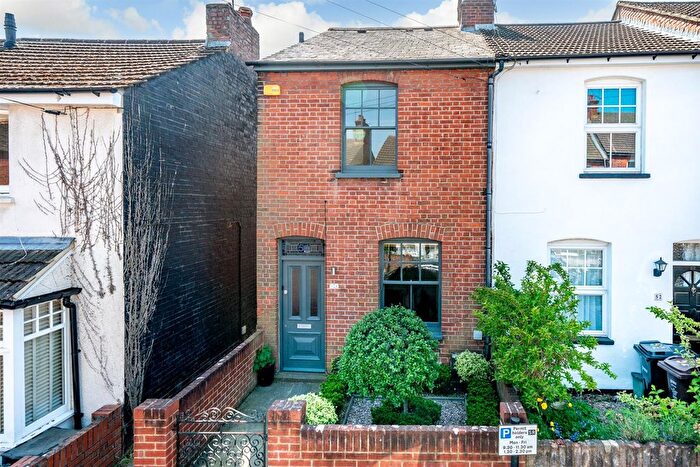
Properties for sale in Marshalswick South
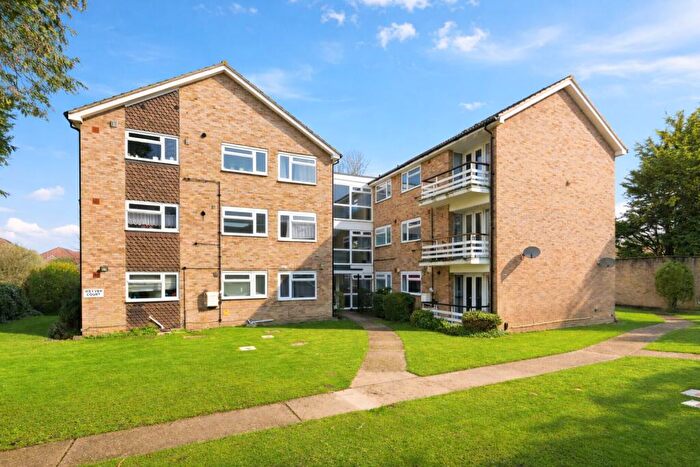
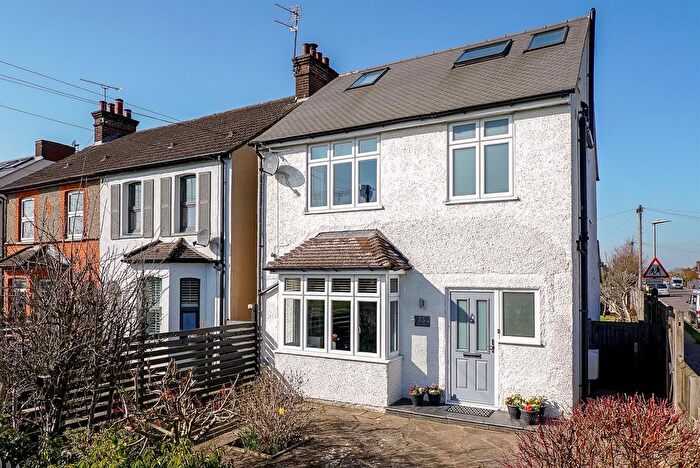
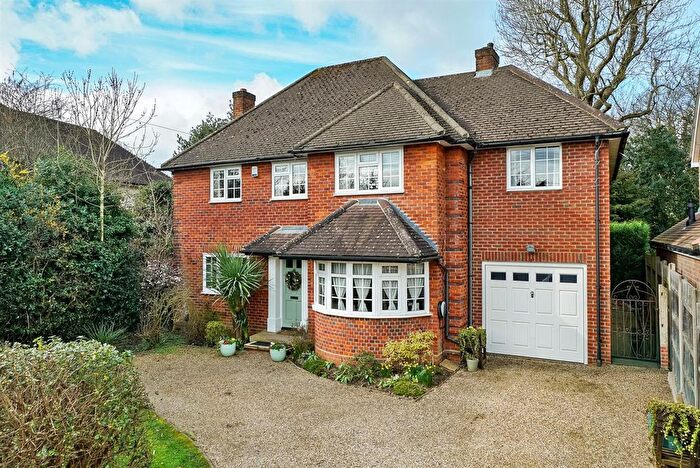
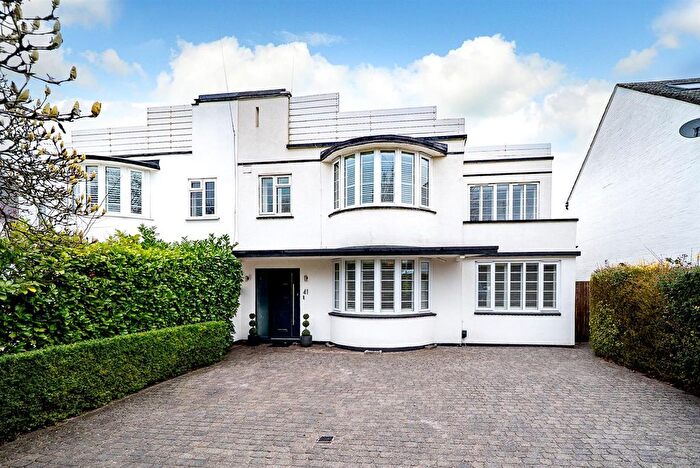
![]()
If you are looking to sell your house, let it out, or receive a property valuation, an expert can help you.
Click the button below to get started.


Roads and Postcodes in Marshalswick South
Navigate through our locations to find the location of your next house in Marshalswick South, St Albans for sale or to rent.
Transport near Marshalswick South

- FAQ
- Price Paid By Year
- Property Type Price
Frequently asked questions about Marshalswick South
What is the average price for a property for sale in Marshalswick South?
The average price for a property for sale in Marshalswick South is £913,919. This amount is 41% higher than the average price in St Albans. There are 1,111 property listings for sale in Marshalswick South.
What streets have the most expensive properties for sale in Marshalswick South?
The streets with the most expensive properties for sale in Marshalswick South are Faircross Way at an average of £2,984,000, The Park at an average of £2,365,500 and Marshals Drive at an average of £2,160,000.
What streets have the most affordable properties for sale in Marshalswick South?
The streets with the most affordable properties for sale in Marshalswick South are Sandridge Park at an average of £264,250, Tudor Road at an average of £306,875 and Land Associated With at an average of £347,666.
Which train stations are available in or near Marshalswick South?
Some of the train stations available in or near Marshalswick South are St.Albans City, St.Albans Abbey and Park Street.
Property Price Paid in Marshalswick South by Year
The average sold property price by year was:
| Year | Average Sold Price | Price Change |
Sold Properties
|
|---|---|---|---|
| 2025 | £823,185 | -22% |
77 Properties |
| 2024 | £1,003,915 | 11% |
96 Properties |
| 2023 | £895,552 | -6% |
90 Properties |
| 2022 | £947,404 | 15% |
135 Properties |
| 2021 | £801,407 | 20% |
153 Properties |
| 2020 | £642,324 | -19% |
102 Properties |
| 2019 | £762,784 | -13% |
100 Properties |
| 2018 | £862,807 | 10% |
92 Properties |
| 2017 | £777,669 | 6% |
114 Properties |
| 2016 | £731,627 | 17% |
135 Properties |
| 2015 | £606,692 | 0,4% |
156 Properties |
| 2014 | £604,464 | 6% |
148 Properties |
| 2013 | £567,034 | -9% |
121 Properties |
| 2012 | £615,704 | 14% |
114 Properties |
| 2011 | £528,430 | -1% |
112 Properties |
| 2010 | £534,609 | 19% |
132 Properties |
| 2009 | £430,855 | -4% |
119 Properties |
| 2008 | £447,075 | -21% |
74 Properties |
| 2007 | £541,775 | 25% |
163 Properties |
| 2006 | £404,246 | 8% |
180 Properties |
| 2005 | £370,081 | -0,3% |
144 Properties |
| 2004 | £371,161 | 2% |
150 Properties |
| 2003 | £363,360 | 0,4% |
121 Properties |
| 2002 | £361,744 | 29% |
203 Properties |
| 2001 | £255,486 | 5% |
162 Properties |
| 2000 | £242,915 | 25% |
129 Properties |
| 1999 | £181,029 | 6% |
186 Properties |
| 1998 | £170,763 | 13% |
131 Properties |
| 1997 | £148,467 | 14% |
144 Properties |
| 1996 | £127,037 | 5% |
153 Properties |
| 1995 | £120,072 | - |
132 Properties |
Property Price per Property Type in Marshalswick South
Here you can find historic sold price data in order to help with your property search.
The average Property Paid Price for specific property types in the last three years are:
| Property Type | Average Sold Price | Sold Properties |
|---|---|---|
| Flat | £335,000.00 | 39 Flats |
| Semi Detached House | £995,930.00 | 58 Semi Detached Houses |
| Detached House | £1,473,397.00 | 78 Detached Houses |
| Terraced House | £620,533.00 | 88 Terraced Houses |