
Houses for sale & to rent in St Albans, Hertfordshire
House Prices in St Albans
Properties in St Albans have an average house price of £650k and had 4,598 Property Transactions within the last 3 years.¹
St Albans is an area in Hertfordshire with 46,351 households², where the most expensive property was sold for £5M.
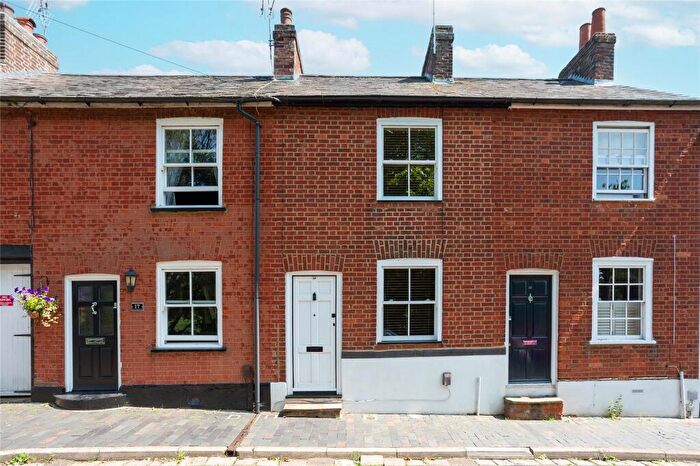
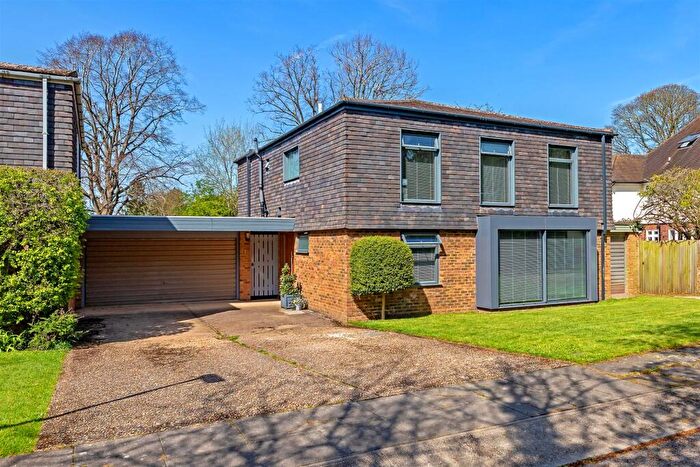
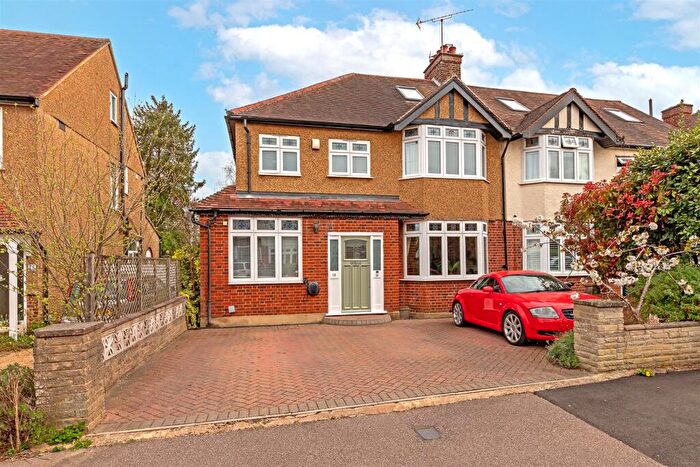
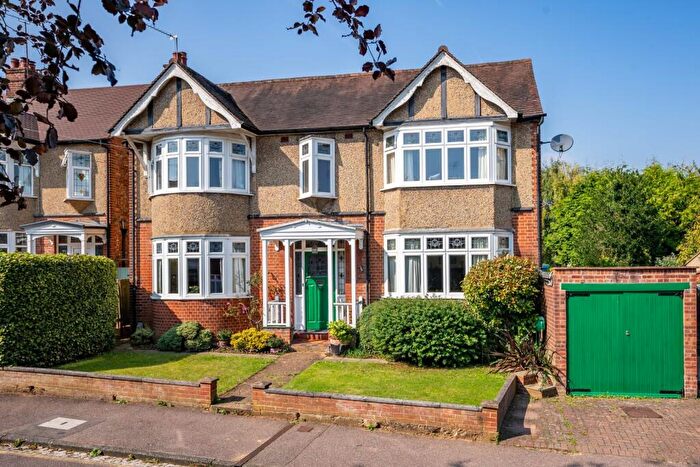
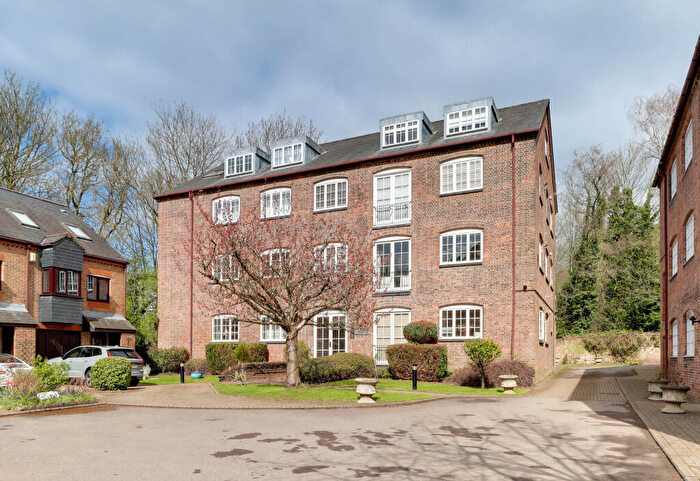
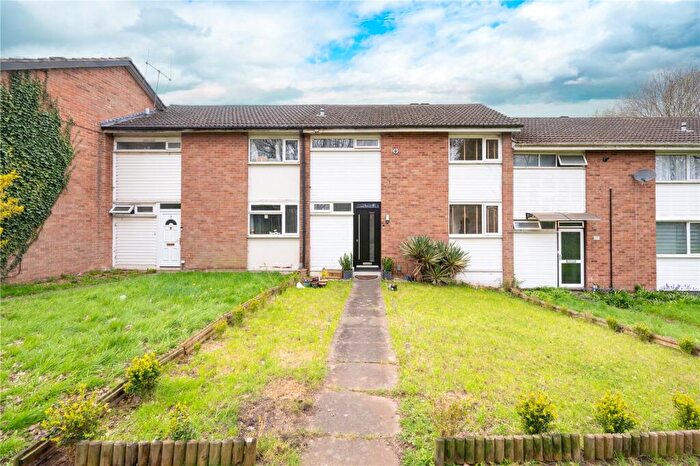
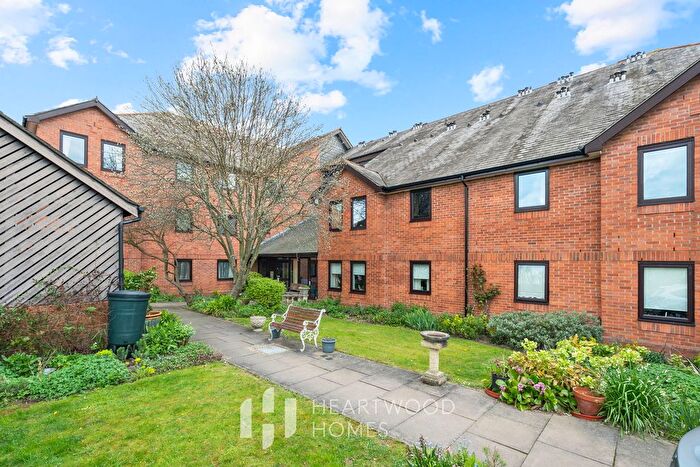
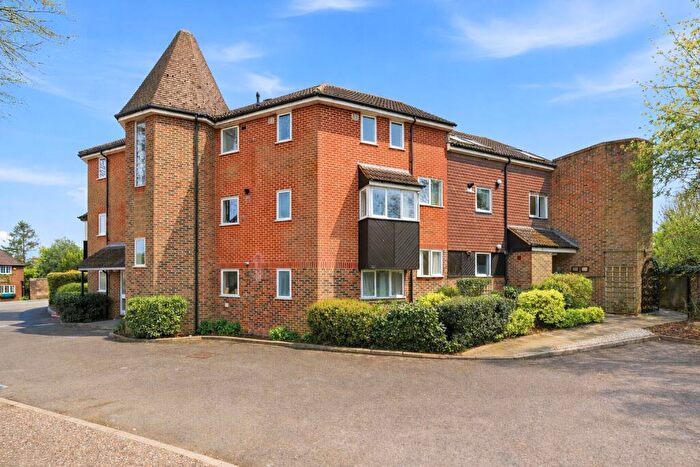
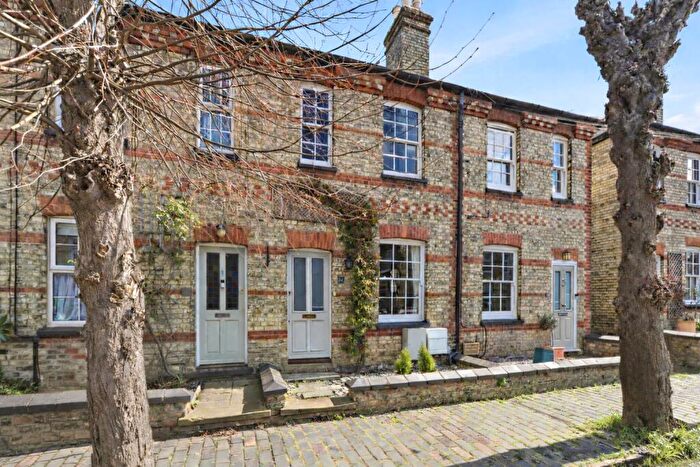
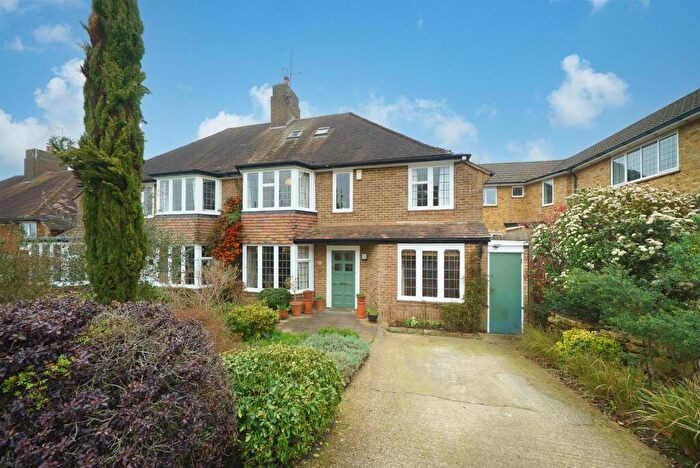
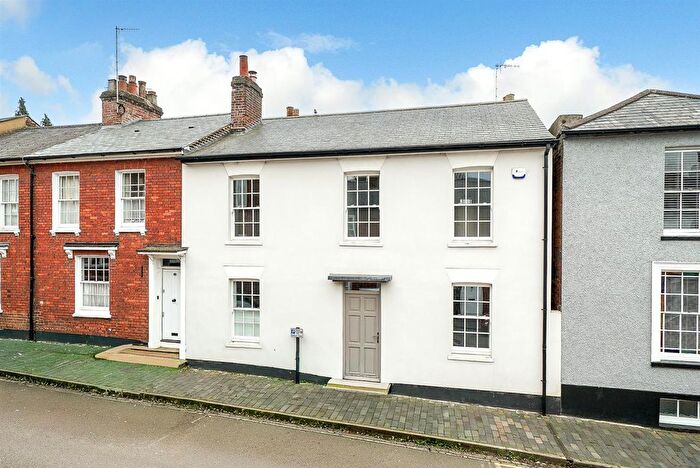
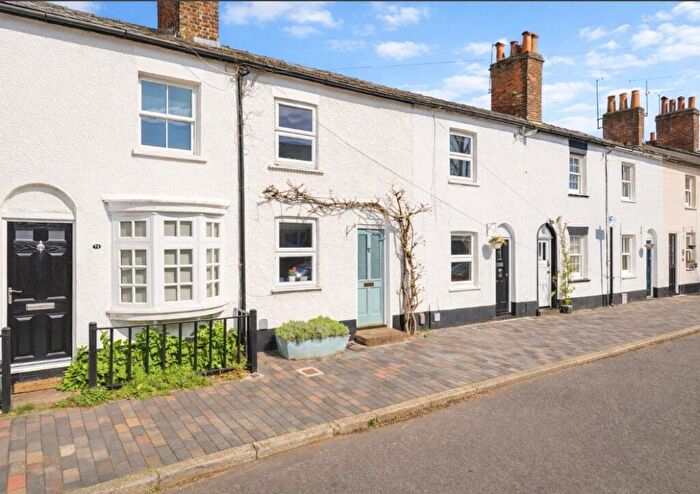
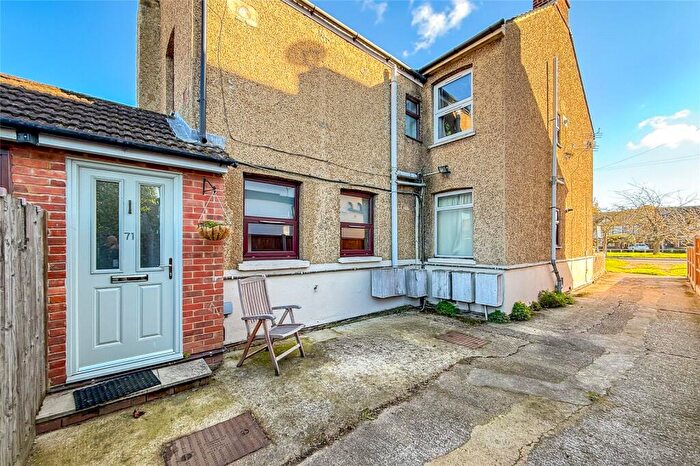
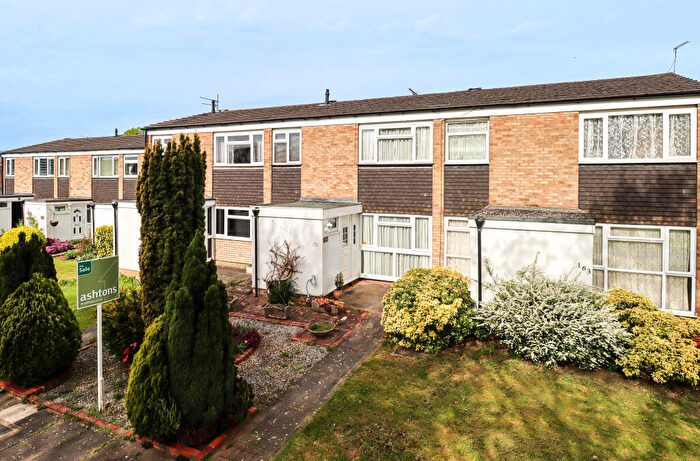
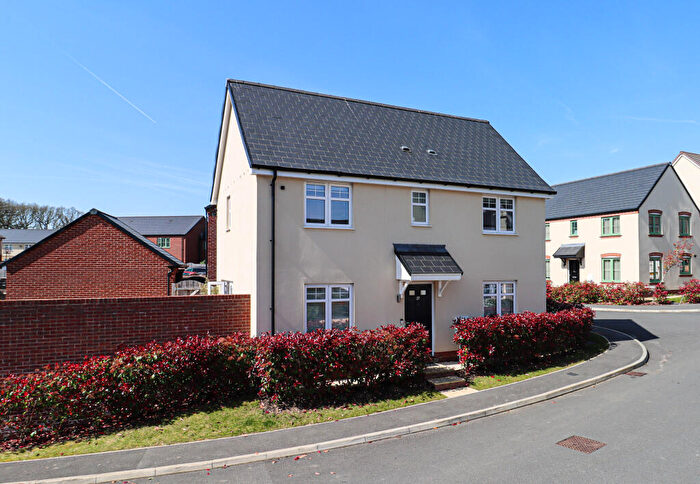
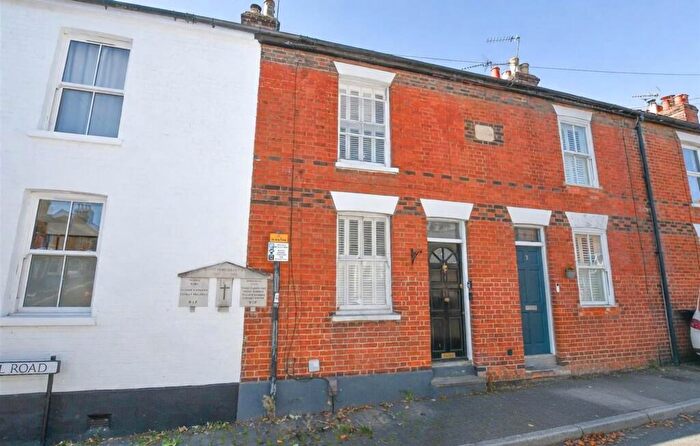
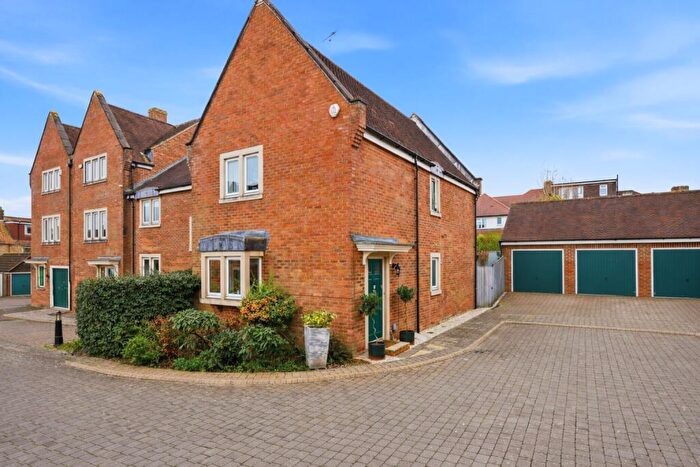
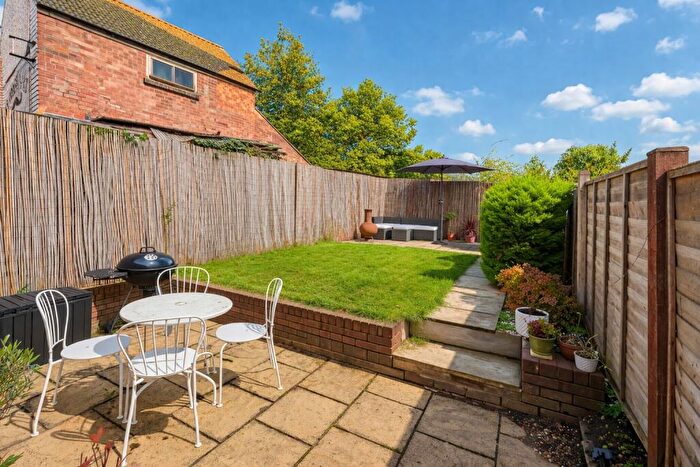
Properties for sale in St Albans
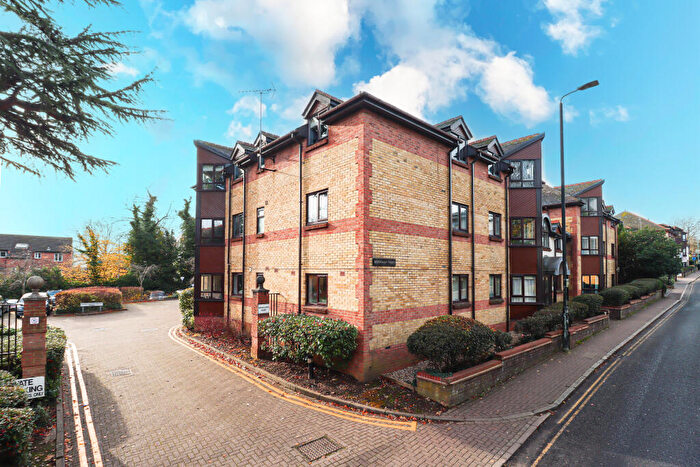
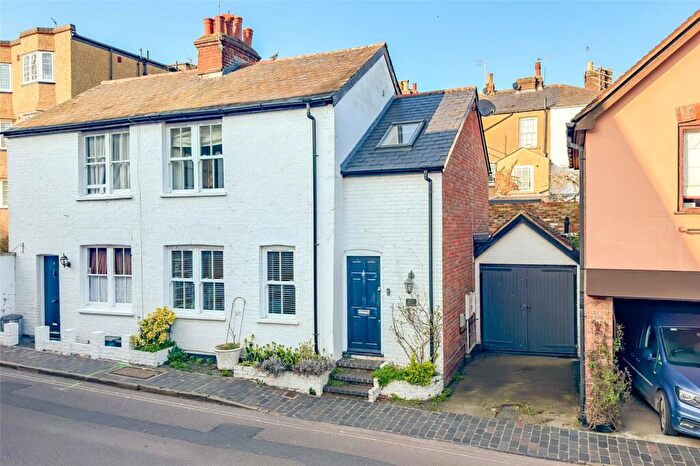
![]()
If you are looking to sell your house, let it out, or receive a property valuation, an expert can help you.
Click the button below to get started.

Neighbourhoods in St Albans
Navigate through our locations to find the location of your next house in St Albans, Hertfordshire for sale or to rent.
- Ashley
- Aldenham West
- Hatfield Villages
- Batchwood
- Clarence
- Colney Heath
- Cunningham
- Kimpton
- London Colney
- Marshalswick North
- Marshalswick South
- Park Street
- Redbourn
- Sandridge
- Shenley
- Sopwell
- St Peters
- St Stephen
- Verulam
- Watling
- Wheathampstead
- Welham Green
- Welham Green and Hatfield South
- Hill End
- Marshalswick East & Jersey Farm
- Sandridge & Wheathampstead
Transport in St Albans
Please see below transportation links in this area:

- FAQ
- Price Paid By Year
- Property Type Price
Frequently asked questions about St Albans
What is the average price for a property for sale in St Albans?
The average price for a property for sale in St Albans is £650,064. This amount is 22% higher than the average price in Hertfordshire. There are more than 10,000 property listings for sale in St Albans.
What locations have the most expensive properties for sale in St Albans?
The locations with the most expensive properties for sale in St Albans are Kimpton at an average of £1,651,588, Marshalswick South at an average of £926,143 and Verulam at an average of £820,899.
What locations have the most affordable properties for sale in St Albans?
The locations with the most affordable properties for sale in St Albans are London Colney at an average of £462,617, Watling at an average of £482,255 and Welham Green at an average of £495,000.
Which train stations are available in or near St Albans?
Some of the train stations available in or near St Albans are St.Albans City, St.Albans Abbey and Park Street.
Property Price Paid in St Albans by Year
The average sold property price by year was:
| Year | Average Sold Price | Price Change |
Sold Properties
|
|---|---|---|---|
| 2026 | £677,643 | 5% |
40 Properties |
| 2025 | £643,232 | -2% |
1,447 Properties |
| 2024 | £655,241 | 1% |
1,591 Properties |
| 2023 | £650,424 | -1% |
1,520 Properties |
| 2022 | £653,695 | 8% |
2,061 Properties |
| 2021 | £601,820 | 8% |
2,565 Properties |
| 2020 | £555,055 | 0,3% |
1,789 Properties |
| 2019 | £553,148 | 2% |
1,787 Properties |
| 2018 | £543,657 | -1% |
1,809 Properties |
| 2017 | £548,731 | 5% |
1,803 Properties |
| 2016 | £521,477 | 11% |
2,012 Properties |
| 2015 | £461,535 | 6% |
2,315 Properties |
| 2014 | £433,779 | 9% |
2,382 Properties |
| 2013 | £393,157 | 1% |
2,328 Properties |
| 2012 | £389,093 | 4% |
1,840 Properties |
| 2011 | £373,276 | -1% |
1,898 Properties |
| 2010 | £378,796 | 13% |
1,959 Properties |
| 2009 | £328,188 | -7% |
1,641 Properties |
| 2008 | £349,937 | -0,3% |
1,372 Properties |
| 2007 | £350,923 | 11% |
2,708 Properties |
| 2006 | £310,696 | 6% |
2,922 Properties |
| 2005 | £292,048 | 4% |
2,431 Properties |
| 2004 | £279,730 | 5% |
2,716 Properties |
| 2003 | £265,938 | 9% |
2,345 Properties |
| 2002 | £241,254 | 14% |
3,034 Properties |
| 2001 | £206,714 | 8% |
2,807 Properties |
| 2000 | £190,403 | 18% |
2,538 Properties |
| 1999 | £156,196 | 12% |
3,232 Properties |
| 1998 | £137,269 | 11% |
2,659 Properties |
| 1997 | £122,001 | 16% |
2,610 Properties |
| 1996 | £101,906 | 4% |
2,373 Properties |
| 1995 | £97,897 | - |
1,882 Properties |
Property Price per Property Type in St Albans
Here you can find historic sold price data in order to help with your property search.
The average Property Paid Price for specific property types in the last three years are:
| Property Type | Average Sold Price | Sold Properties |
|---|---|---|
| Semi Detached House | £735,747.00 | 1,200 Semi Detached Houses |
| Terraced House | £585,551.00 | 1,357 Terraced Houses |
| Detached House | £1,022,248.00 | 918 Detached Houses |
| Flat | £332,220.00 | 1,123 Flats |