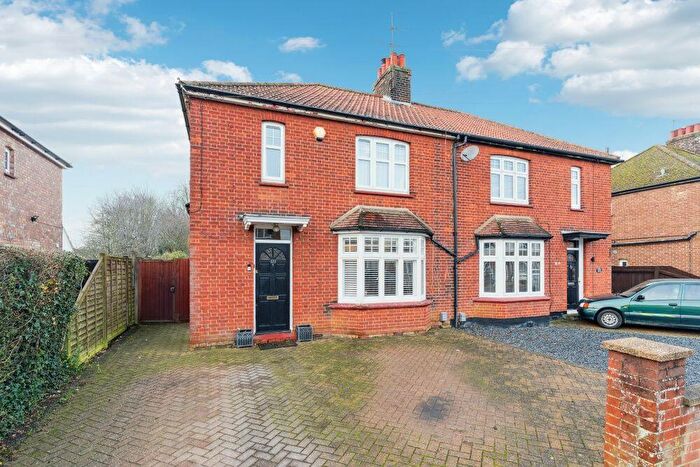
Houses for sale & to rent in Woodfield, Stevenage
House Prices in Woodfield
Properties in Woodfield have an average house price of £453,113.00 and had 222 Property Transactions within the last 3 years¹.
Woodfield is an area in Stevenage, Hertfordshire with 2,211 households², where the most expensive property was sold for £1,512,000.00.
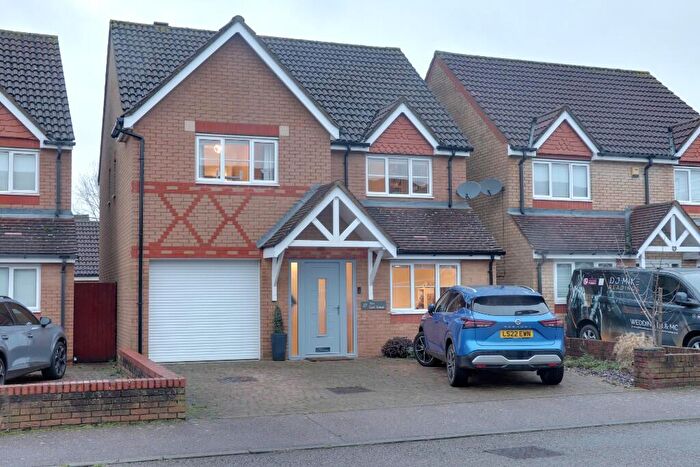
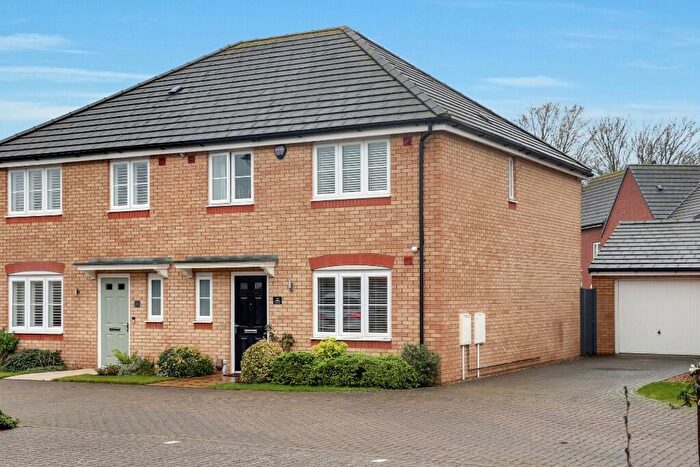
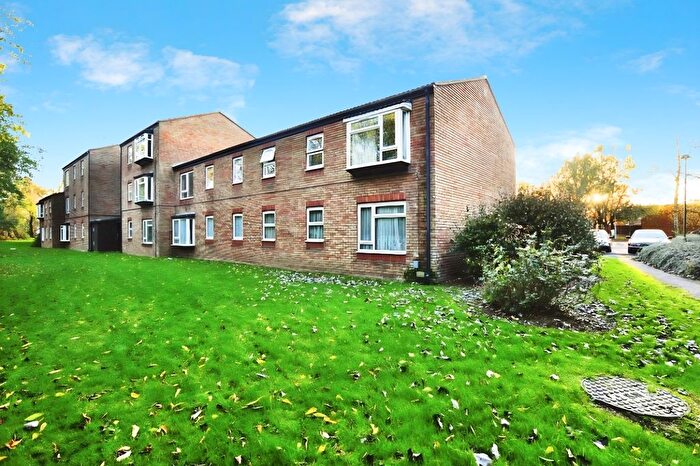
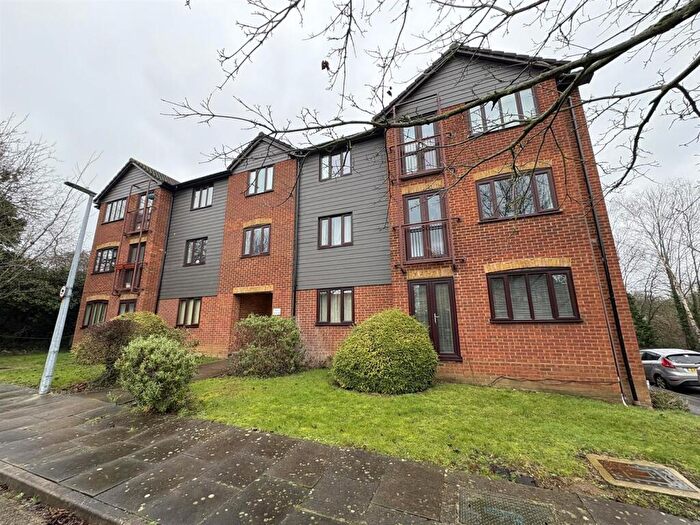
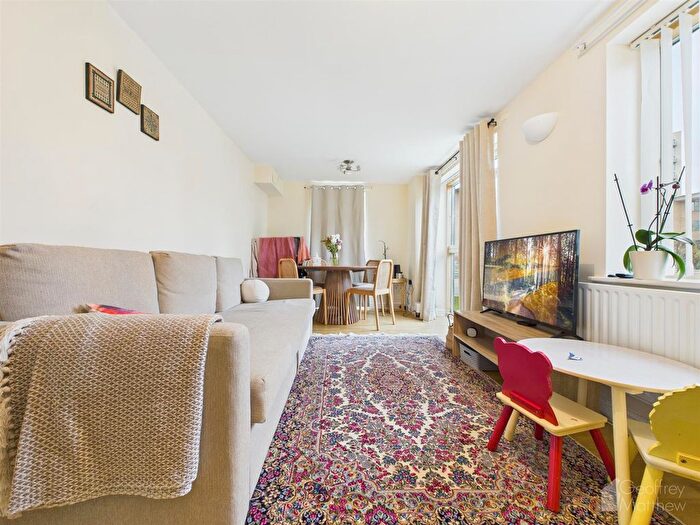
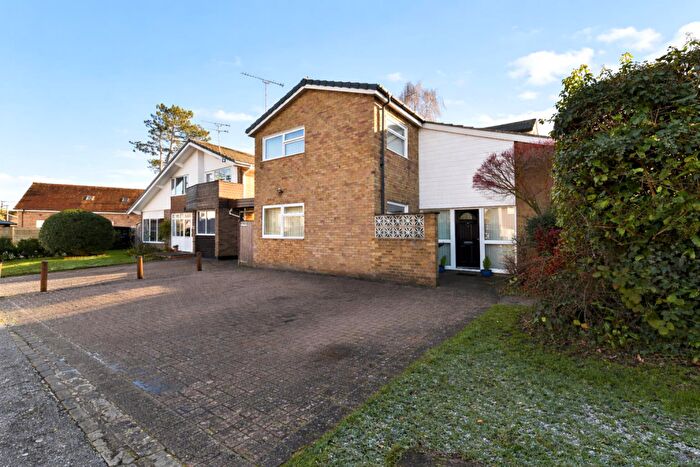
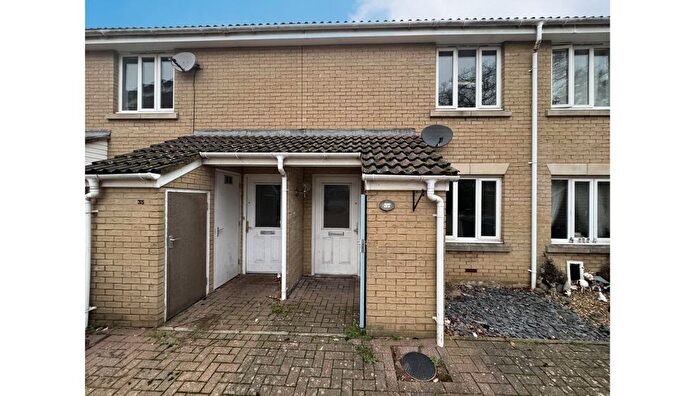
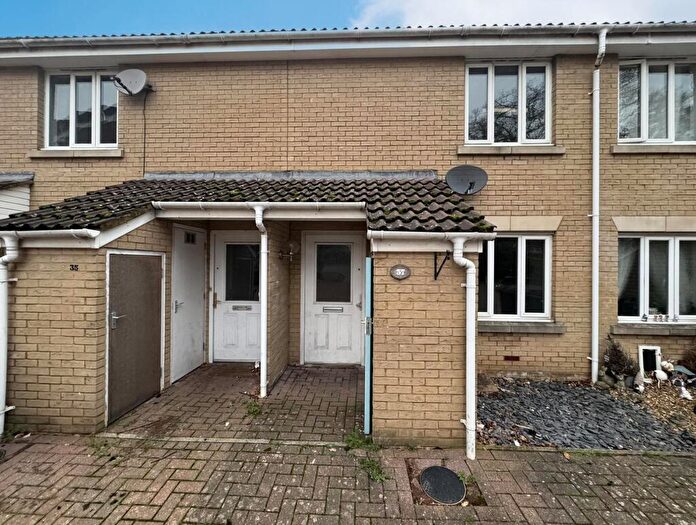
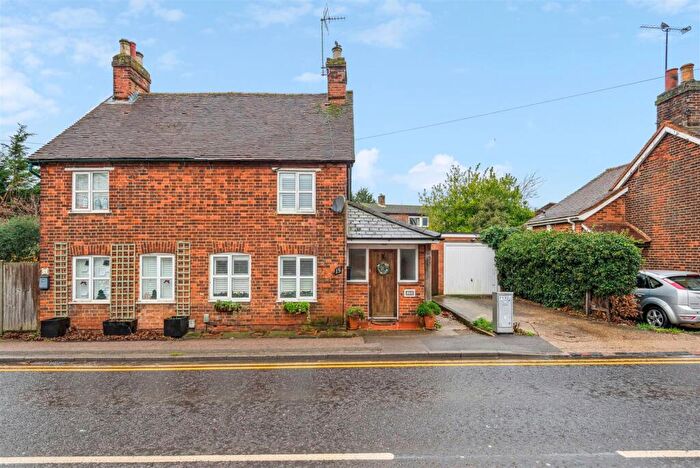
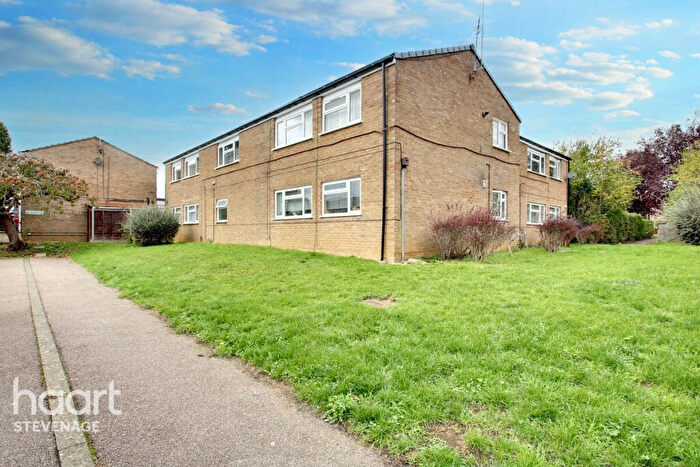
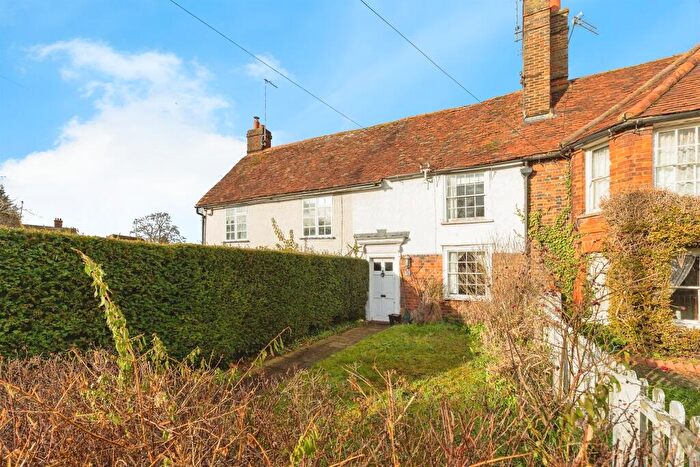
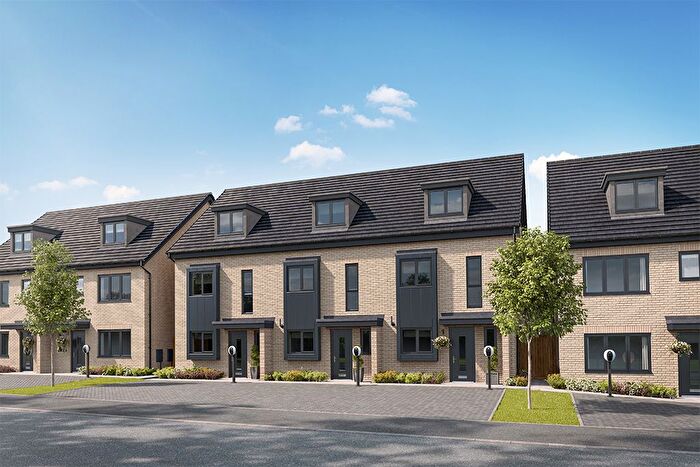
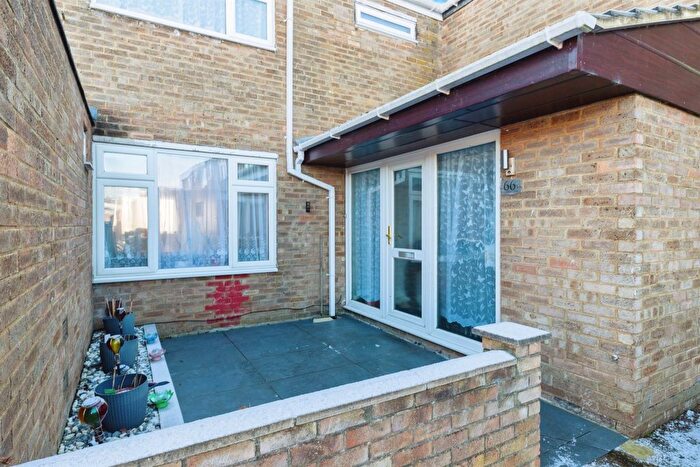
Properties for sale in Woodfield
Roads and Postcodes in Woodfield
Navigate through our locations to find the location of your next house in Woodfield, Stevenage for sale or to rent.
| Streets | Postcodes |
|---|---|
| Ansell Court | SG1 4RL |
| Arnold Close | SG1 4TF |
| Aston Close | SG1 4TT |
| Avon Drive | SG1 3XZ |
| Baron Court | SG1 4RR SG1 4RS |
| Boswell Gardens | SG1 4SB |
| Bray Drive | SG1 6DH SG1 6DJ |
| Burymead | SG1 4AX SG1 4AY SG1 4AZ SG1 4BA |
| Calder Way | SG1 6DN |
| Chancellors Road | SG1 4AP SG1 4TZ |
| Chapman Road | SG1 4RJ |
| Cherwell Drive | SG1 6BD SG1 6BE |
| Chestnut Walk | SG1 4DD |
| Chouler Gardens | SG1 4TB |
| Clements Place | SG1 4FP |
| Coreys Mill Lane | SG1 4AB SG1 4AJ SG1 4RT |
| Daltry Close | SG1 4BW |
| Daltry Road | SG1 4AW |
| Dove Road | SG1 3YJ |
| Foster Close | SG1 4SA |
| Gloucester Close | SG1 3RQ |
| Granby Road | SG1 4AR SG1 4AS |
| Graveley Close | SG1 4TU |
| Graveley Road | SG1 4YS |
| Guildford Close | SG1 4XP |
| Herne Road | SG1 4RW |
| Higgins Walk | SG1 4YP |
| Hitchin Road | SG1 4FD |
| Humber Court | SG1 3XS |
| Ingleside Drive | SG1 4RD SG1 4RE SG1 4RF SG1 4RG SG1 4RN SG1 4RP SG1 4RQ SG1 4RY |
| Iona Close | SG1 4XR |
| Kenmare Close | SG1 3XW |
| Kennett Way | SG1 3XU |
| Lancaster Close | SG1 4RX |
| Lincoln Road | SG1 4PJ SG1 4PL |
| Lister Close | SG1 4AQ |
| Manchester Close | SG1 4TQ |
| Mathews Close | SG1 4XB |
| Middlesborough Close | SG1 4TJ |
| Morgan Close | SG1 4TG |
| Newbury Close | SG1 4TE |
| Newcastle Close | SG1 4TL |
| Nicholas Place | SG1 4BZ |
| North Road | SG1 4AH SG1 4AL SG1 4AN SG1 4BD SG1 4BB SG1 4BS SG1 4FU |
| Nycolles Wood | SG1 4GR |
| Old Bourne Way | SG1 6AD SG1 6AE |
| Orwell Avenue | SG1 3XT |
| Pilgrims Way | SG1 4PT |
| Pirton Close | SG1 4FG SG1 4FH |
| Rectory Croft | SG1 4BY |
| Rectory Lane | SG1 4BT SG1 4BX SG1 4DA |
| Riccat Lane | SG1 3XY |
| Rye Close | SG1 3YN |
| Salisbury Road | SG1 4PE SG1 4PF |
| Severn Way | SG1 3YL |
| St Albans Drive | SG1 4RU |
| St Andrews Drive | SG1 4UY |
| St Davids Close | SG1 4UZ |
| Swale Close | SG1 6DF |
| Tamar Close | SG1 6AS |
| Tates Way | SG1 4WP |
| Tees Close | SG1 3YW |
| The Brambles | SG1 4AU |
| The Close | SG1 4BU |
| The Mews | SG1 4FJ |
| The Old Walled Garden | SG1 4TN |
| Thurlow Close | SG1 4SD |
| Tudor Close | SG1 4DB |
| Turner Close | SG1 4AF |
| Underwood Road | SG1 4TA |
| Wansbeck Close | SG1 6AA SG1 6AB |
| Wedgewood Way | SG1 4QT |
| Wensum Road | SG1 3XX |
| Weston Road | SG1 4DE SG1 4XS |
| Whitney Drive | SG1 4AD SG1 4BE SG1 4BG SG1 4BH SG1 4BJ SG1 4BL SG1 4BQ |
| Whitney Wood | SG1 4AE SG1 4FE |
| Whitworth Road | SG1 4QS |
| Wilsons Close | SG1 4TD |
| Winchester Close | SG1 4NZ |
| Windrush Close | SG1 6DL |
| Woodfield Road | SG1 4BP |
| SG1 4AA |
Transport near Woodfield
- FAQ
- Price Paid By Year
- Property Type Price
Frequently asked questions about Woodfield
What is the average price for a property for sale in Woodfield?
The average price for a property for sale in Woodfield is £453,113. This amount is 28% higher than the average price in Stevenage. There are 2,398 property listings for sale in Woodfield.
What streets have the most expensive properties for sale in Woodfield?
The streets with the most expensive properties for sale in Woodfield are Rectory Lane at an average of £1,130,375, Chestnut Walk at an average of £980,000 and Woodfield Road at an average of £957,500.
What streets have the most affordable properties for sale in Woodfield?
The streets with the most affordable properties for sale in Woodfield are Baron Court at an average of £199,642, Ansell Court at an average of £217,500 and Ingleside Drive at an average of £265,241.
Which train stations are available in or near Woodfield?
Some of the train stations available in or near Woodfield are Stevenage, Hitchin and Knebworth.
Property Price Paid in Woodfield by Year
The average sold property price by year was:
| Year | Average Sold Price | Price Change |
Sold Properties
|
|---|---|---|---|
| 2025 | £499,750 | 11% |
36 Properties |
| 2024 | £447,080 | 2% |
53 Properties |
| 2023 | £437,745 | -2% |
49 Properties |
| 2022 | £445,898 | 4% |
84 Properties |
| 2021 | £430,062 | 11% |
100 Properties |
| 2020 | £380,885 | 5% |
68 Properties |
| 2019 | £360,821 | -10% |
63 Properties |
| 2018 | £397,653 | 6% |
70 Properties |
| 2017 | £372,487 | -3% |
94 Properties |
| 2016 | £383,623 | 16% |
75 Properties |
| 2015 | £323,628 | 6% |
89 Properties |
| 2014 | £304,889 | 10% |
98 Properties |
| 2013 | £274,678 | -1% |
56 Properties |
| 2012 | £278,618 | 8% |
67 Properties |
| 2011 | £257,519 | -3% |
73 Properties |
| 2010 | £266,151 | 14% |
68 Properties |
| 2009 | £227,642 | -6% |
62 Properties |
| 2008 | £241,462 | -12% |
56 Properties |
| 2007 | £269,686 | 20% |
135 Properties |
| 2006 | £215,853 | 3% |
125 Properties |
| 2005 | £208,595 | 1% |
129 Properties |
| 2004 | £206,163 | 2% |
126 Properties |
| 2003 | £201,942 | 15% |
178 Properties |
| 2002 | £171,179 | 11% |
276 Properties |
| 2001 | £152,844 | 16% |
223 Properties |
| 2000 | £128,425 | 21% |
185 Properties |
| 1999 | £101,595 | -1% |
287 Properties |
| 1998 | £102,527 | -23% |
78 Properties |
| 1997 | £126,055 | 8% |
94 Properties |
| 1996 | £116,132 | 13% |
54 Properties |
| 1995 | £100,767 | - |
49 Properties |
Property Price per Property Type in Woodfield
Here you can find historic sold price data in order to help with your property search.
The average Property Paid Price for specific property types in the last three years are:
| Property Type | Average Sold Price | Sold Properties |
|---|---|---|
| Semi Detached House | £412,655.00 | 29 Semi Detached Houses |
| Detached House | £716,493.00 | 74 Detached Houses |
| Terraced House | £344,665.00 | 82 Terraced Houses |
| Flat | £198,412.00 | 37 Flats |

