
Houses for sale in Stevenage, Hertfordshire
House Prices in Stevenage
Properties in Stevenage have an average house price of £356k and had 3,222 Property Transactions within the last 3 years.¹
Stevenage is an area in Hertfordshire with 40,260 households², where the most expensive property was sold for £2M.
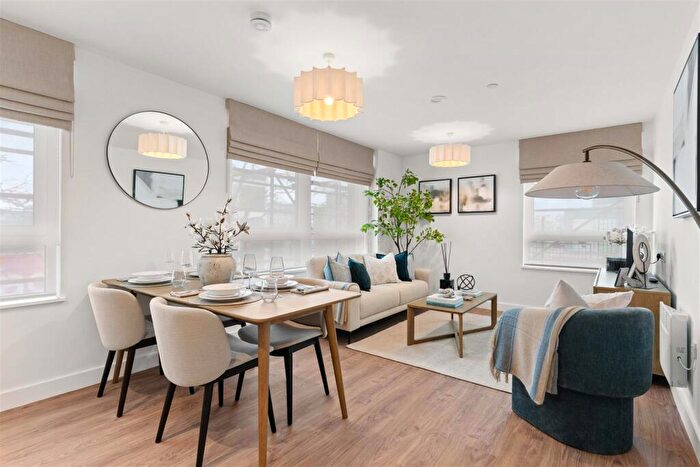
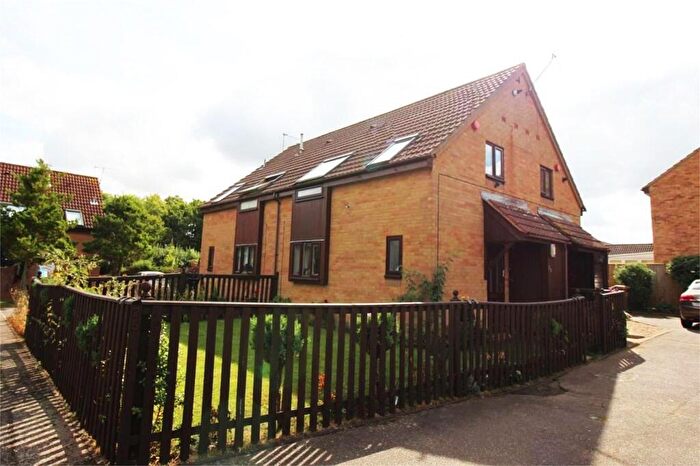
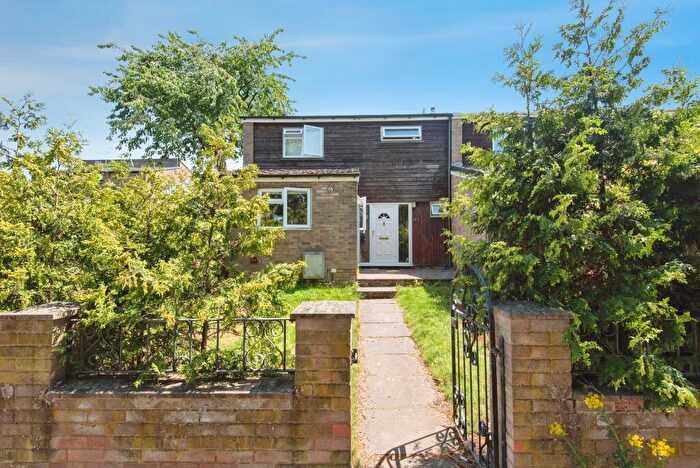
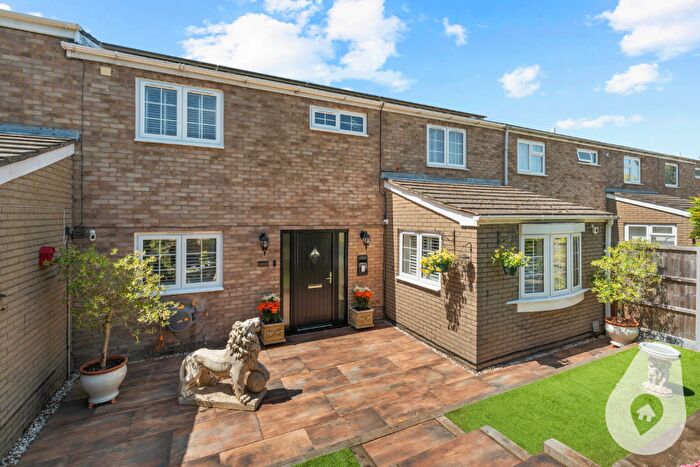
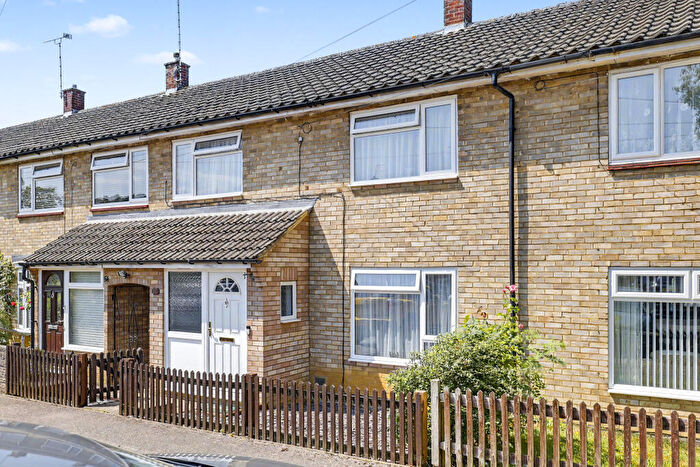
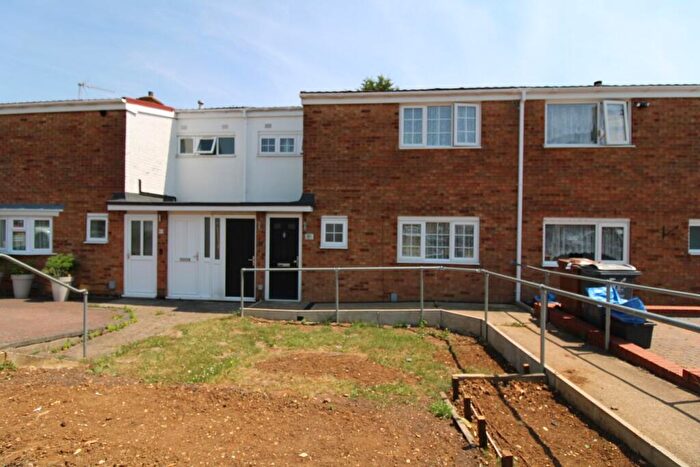
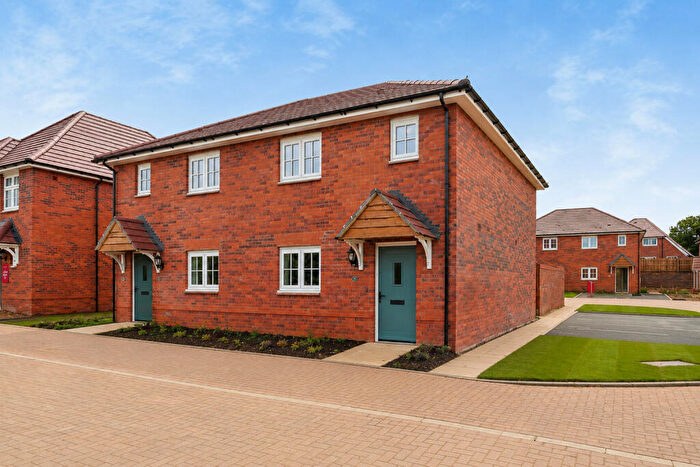
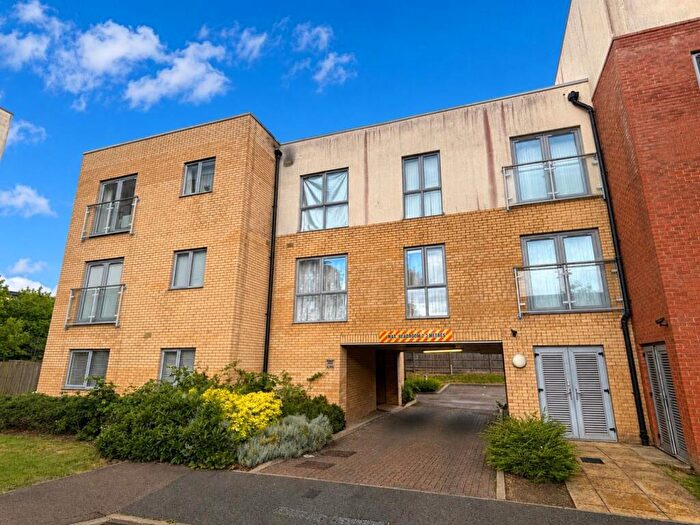
Properties for sale in Stevenage
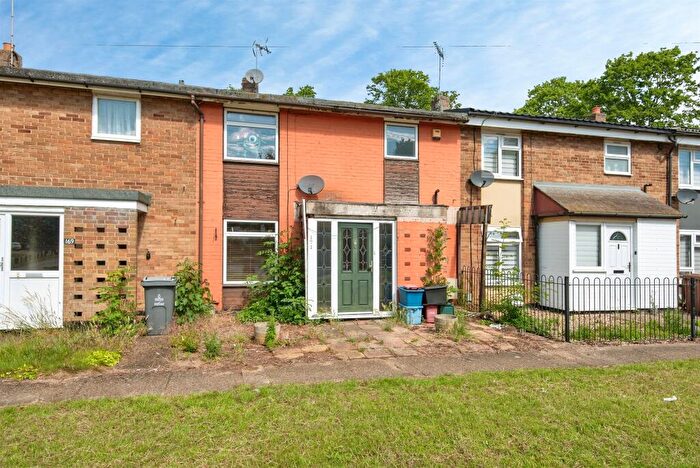
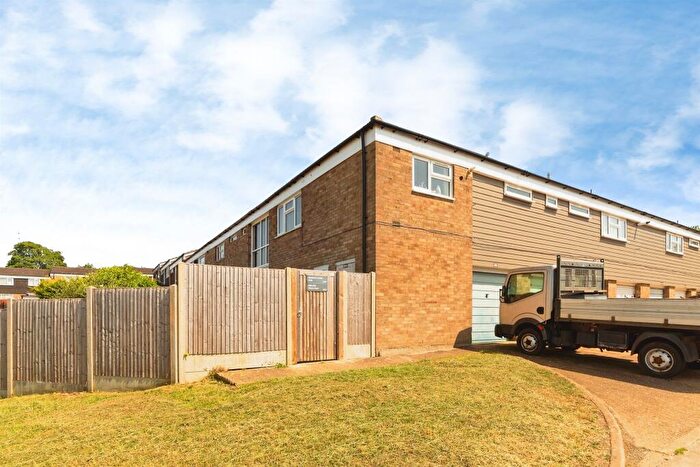
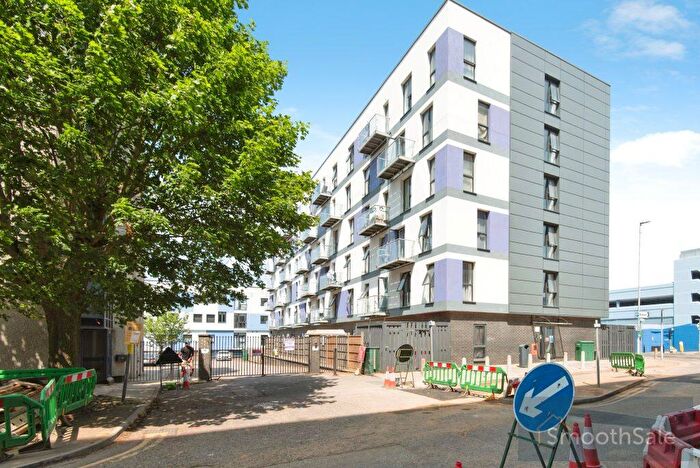
![]()
If you are looking to sell your house, let it out, or receive a property valuation, an expert can help you.
Click the button below to get started.

Neighbourhoods in Stevenage
Navigate through our locations to find the location of your next house in Stevenage, Hertfordshire for sale or to rent.
Property price trends in Stevenage
According to the latest Land Registry data, the average home in Stevenage sold for £383,966 in 2026. That figure comes from a substantial record of 48,382 sales logged over the past 31 years.
Prices have continued to climb over the last three years. Compared with 2023, when the typical sale came in around £343,861, that's a rise of roughly 11.7%.
Looking back five years, average prices are up about 13.2% since 2021, a gain of around £44,834 in cash terms.
Zoom out to the past decade for the fuller picture. Back in 2016, homes here averaged £266,542, so the typical sold price has climbed about 44.1% since then, roughly 3.7% a year. Stretch the view to fifteen years and that annual pace edges up closer to 4.4%.
Frequently asked questions about Stevenage
What is the average price for a property for sale in Stevenage?
The average price for a property for sale in Stevenage is £355,533. This amount is 33% lower than the average price in Hertfordshire. There are 9,085 property listings for sale in Stevenage.
What locations have the most expensive properties for sale in Stevenage?
The locations with the most expensive properties for sale in Stevenage are Datchworth & Aston at an average of £1,050,000, Weston And Sandon at an average of £650,000 and Datchworth And Aston at an average of £634,123.
What locations have the most affordable properties for sale in Stevenage?
The locations with the most affordable properties for sale in Stevenage are St Nicholas at an average of £275,925, Bedwell at an average of £280,231 and Pin Green at an average of £288,603.
Which train stations are available in or near Stevenage?
Some of the train stations available in or near Stevenage are Stevenage, Knebworth and Watton-At-Stone.
Property Price Paid in Stevenage by Year
The average sold property price by year was:
| Year | Average Sold Price | Price Change |
Sold Properties
|
|---|---|---|---|
| 2026 | £383,966 | 4% |
74 Properties |
| 2025 | £368,679 | 5% |
1,096 Properties |
| 2024 | £350,947 | 2% |
1,050 Properties |
| 2023 | £343,861 | -3% |
1,002 Properties |
| 2022 | £354,937 | 4% |
1,295 Properties |
| 2021 | £339,132 | 6% |
1,671 Properties |
| 2020 | £318,820 | 7% |
1,128 Properties |
| 2019 | £297,193 | 1% |
1,365 Properties |
| 2018 | £294,032 | 1% |
1,283 Properties |
| 2017 | £290,536 | 8% |
1,605 Properties |
Property Price per Property Type in Stevenage
Here you can find historic sold price data in order to help with your property search.
The average Property Paid Price for specific property types in the last three years are:
| Property Type | Average Sold Price | Sold Properties |
|---|---|---|
| Semi Detached House | £405,520.00 | 590 Semi Detached Houses |
| Terraced House | £335,639.00 | 1,667 Terraced Houses |
| Detached House | £615,494.00 | 389 Detached Houses |
| Flat | £186,342.00 | 576 Flats |
Transport in Stevenage
Please see below transportation links in this area:
