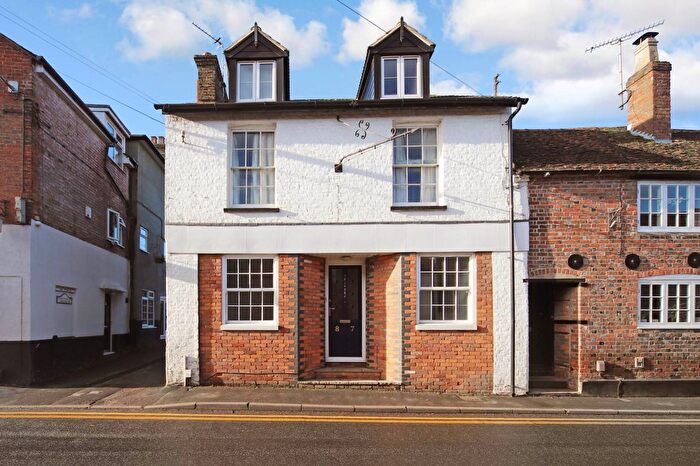
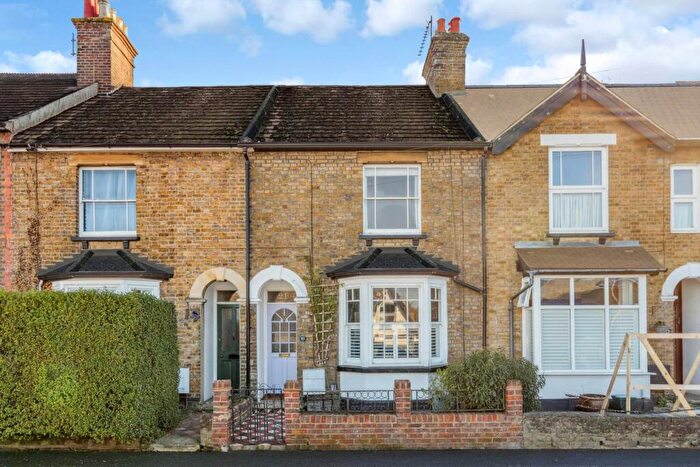
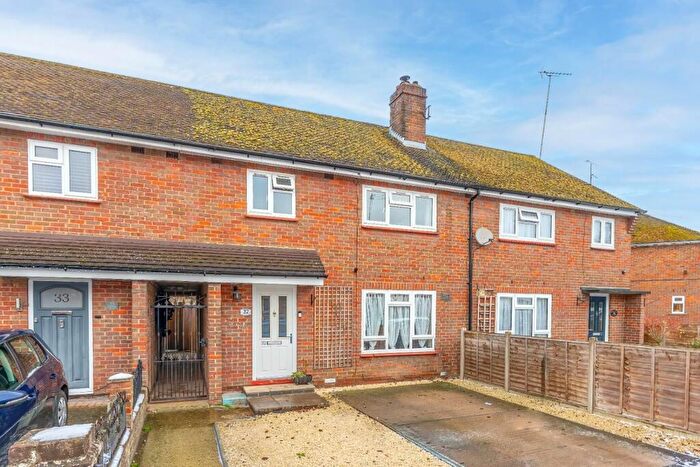
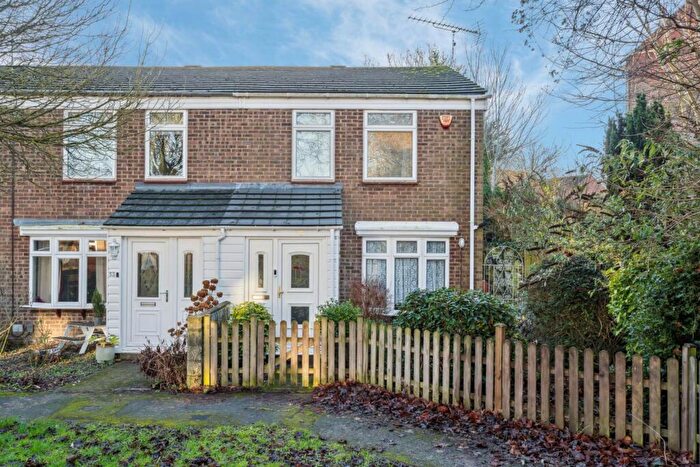
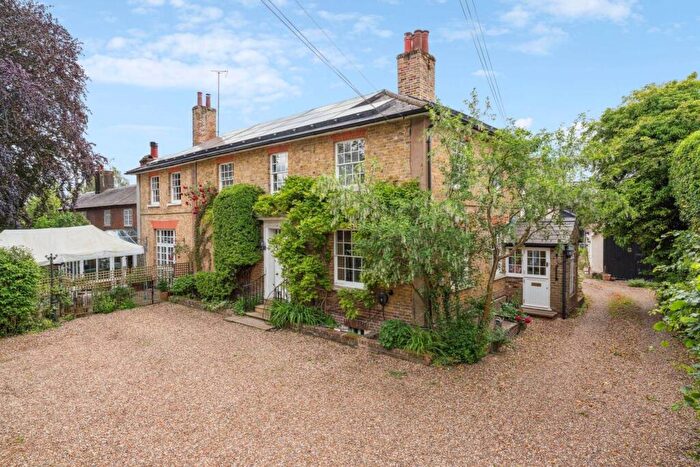
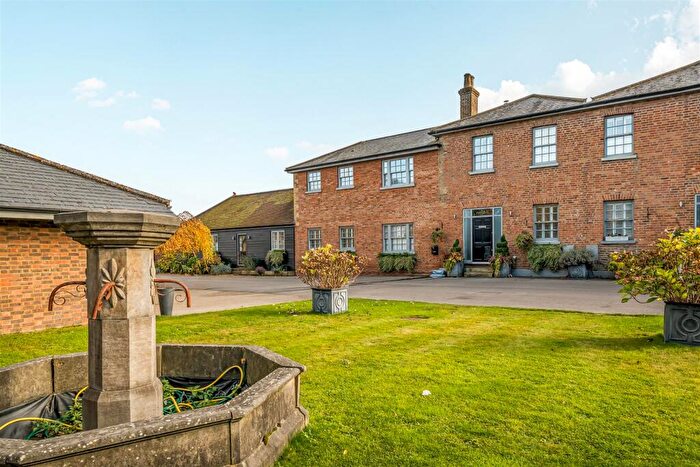
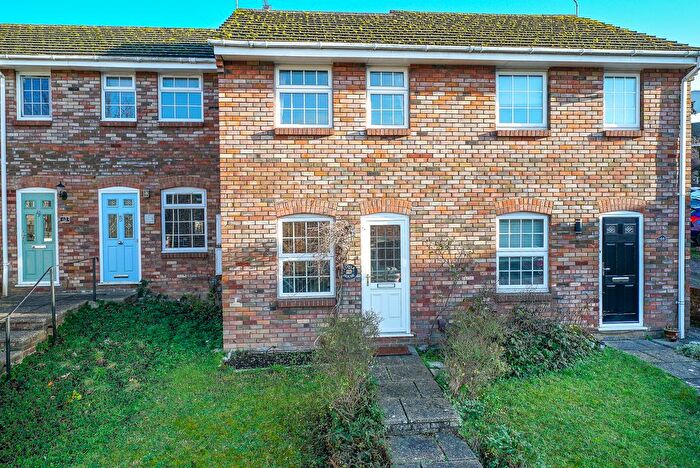
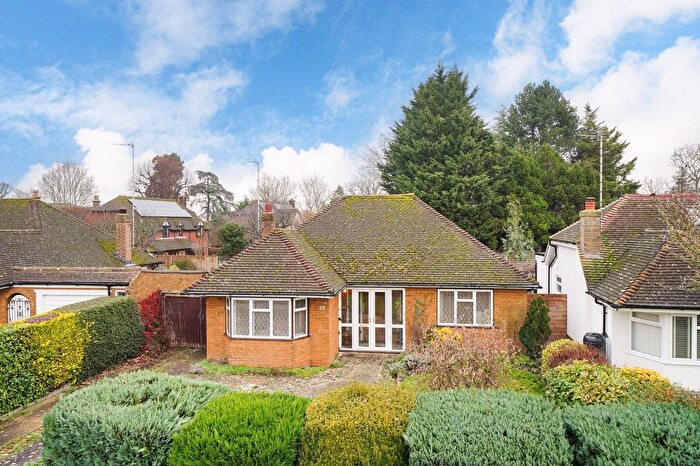
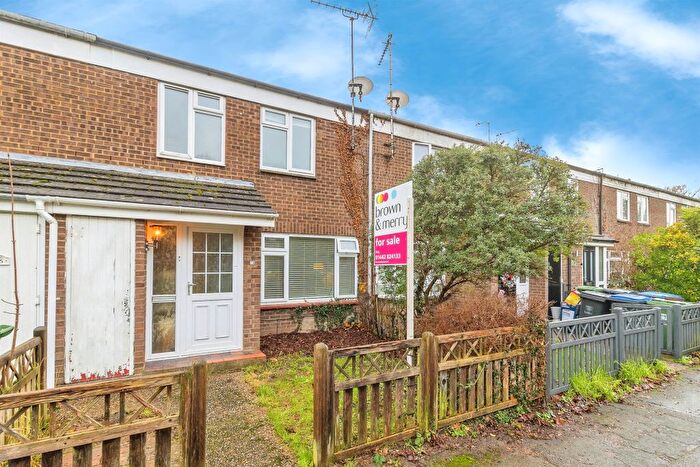
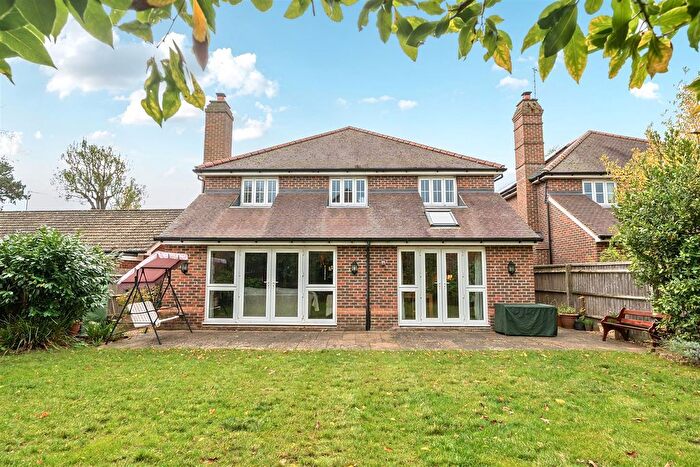
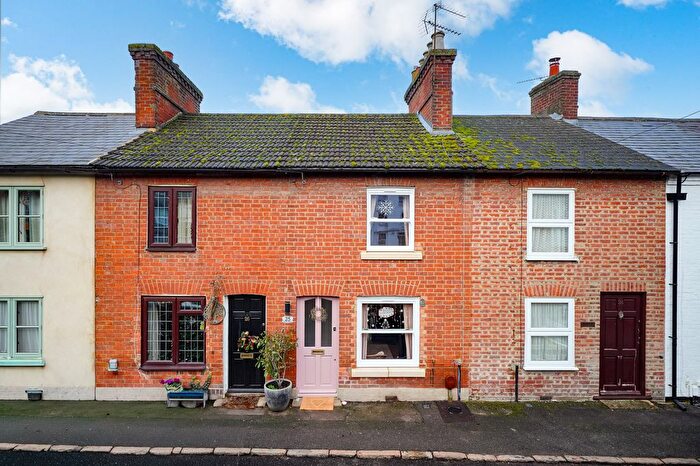
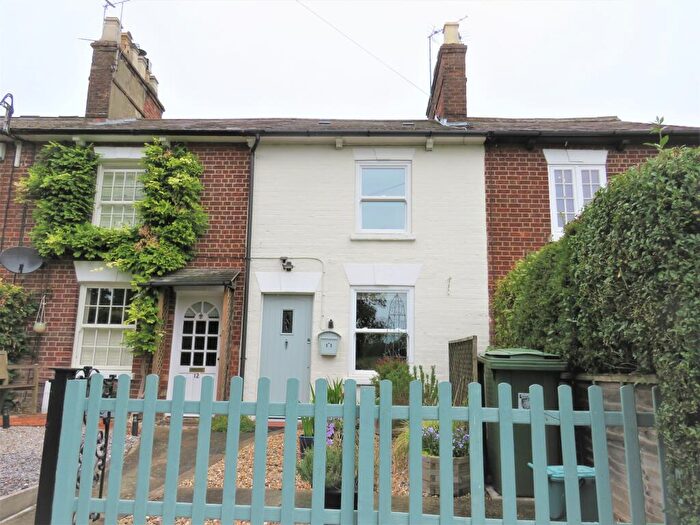
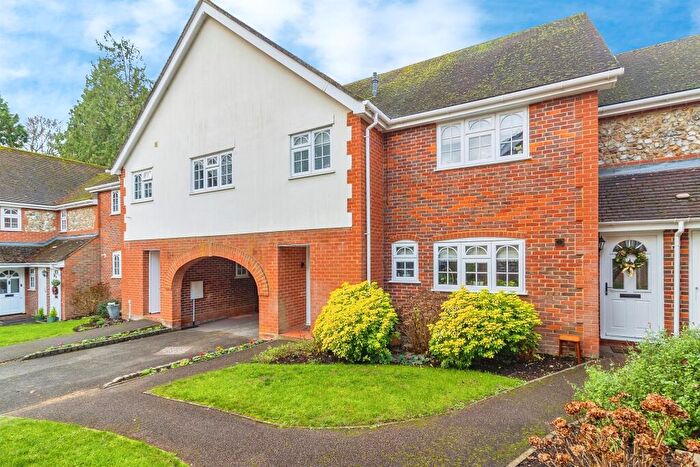
Houses for sale & to rent in Aldbury And Wigginton, Tring
House Prices in Aldbury And Wigginton
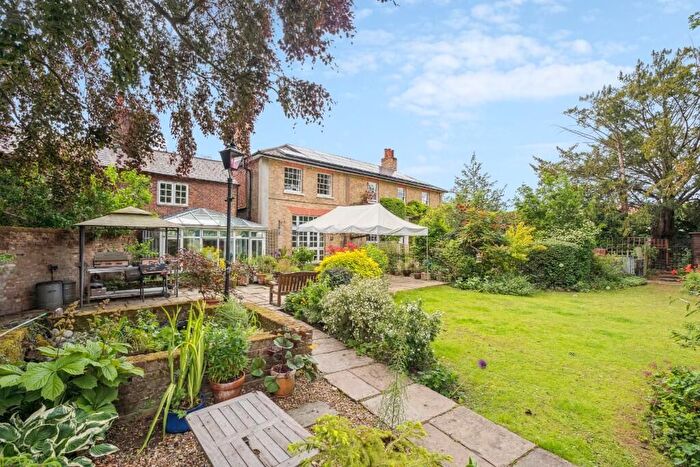
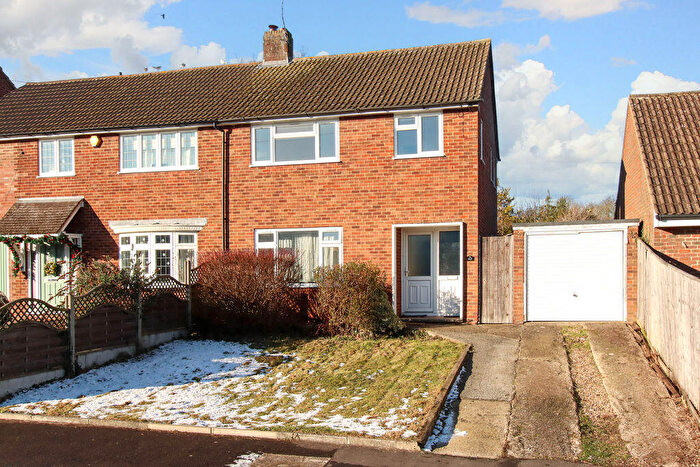
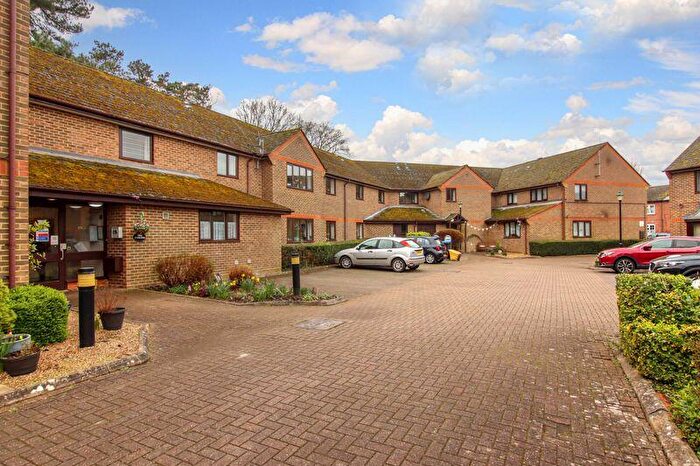
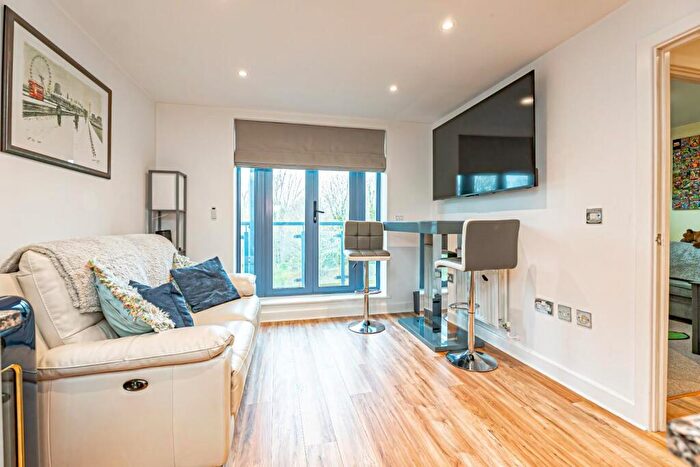
Properties in Aldbury And Wigginton have an average house price of £788,105.00 and had 94 Property Transactions within the last 3 years¹.
Aldbury And Wigginton is an area in Tring, Hertfordshire with 981 households², where the most expensive property was sold for £2,850,000.00.
Properties for sale in Aldbury And Wigginton
Roads and Postcodes in Aldbury And Wigginton
Navigate through our locations to find the location of your next house in Aldbury And Wigginton, Tring for sale or to rent.
| Streets | Postcodes |
|---|---|
| Beech Park | HP23 6BF HP23 6JF HP23 6JN HP23 6JW |
| Beechwood Drive | HP23 5SB |
| Beggars Lane | HP23 5PT |
| Bellmers Road | HP23 6ER |
| Berryfield Cottages | HP23 5RN |
| Champneys | HP23 6HY |
| Chesham Road | HP23 6EH HP23 6HH HP23 6HJ HP23 6HX HP23 6JD HP23 6JE HP23 6EJ HP23 6HG HP23 6JG |
| Chiltern Hills Close | HP23 5FW |
| Church Cottages | HP23 5RS |
| Clarkes Spring | HP23 5QL |
| Clayhill | HP23 6HR |
| Common Field | HP23 6EP HP23 6EW |
| Crawleys Lane | HP23 6HU HP23 6FF |
| Field End Close | HP23 6EZ |
| Fieldway | HP23 6EF |
| Fox Close | HP23 6ED |
| Fox Road | HP23 6EE |
| Grymsdyke Road | HP23 6ET |
| Hemp Lane | HP23 6DW HP23 6HE HP23 6HF |
| Highfield Road | HP23 6EB |
| Hill Green Lane | HP23 6HD |
| Hollybush Row | HP23 6HL |
| London Road | HP23 5RA |
| Malting Lane | HP23 5RH |
| Mary Cross Close | HP23 6QL |
| New Ground Road | HP23 5RD HP23 5RJ HP23 5RQ HP23 5SF |
| New Villas | HP23 5QX |
| Northfield Road | HP23 5QW |
| Osborne Way | HP23 6EN |
| Pollywick Road | HP23 6ES |
| Rose Cottages | HP23 5SD |
| Rossway Lane | HP23 6GZ |
| Royal Court | HP23 5SG |
| Shootersway | HP23 6JA |
| Stocks Road | HP23 5RT HP23 5RU HP23 5RX |
| Stoneycroft | HP23 5RL HP23 5RP |
| The Bit | HP23 6EQ |
| The Green | HP23 5RR |
| The Twist | HP23 6DU |
| Tinkers Lane | HP23 6JB |
| Toms Hill | HP23 5SE |
| Toms Hill Close | HP23 5SL |
| Toms Hill Road | HP23 5SA |
| Tring Road | HP23 5FR |
| Tring Station | HP23 5QP HP23 5QR HP23 5QS HP23 5QT HP23 5QU |
| Trooper Road | HP23 5RW |
| Valpy Close | HP23 6EY |
| Vicarage Road | HP23 6DX HP23 6DY HP23 6DZ HP23 6EA |
| Wick Road | HP23 6EL |
| Wigginton Bottom | HP23 6HN HP23 6HP HP23 6HW |
| Woodrow | HP23 6HS |
| Woodrow Farm Cottages | HP23 6HT |
| HP23 5RF HP23 6DN HP23 6DP |
Transport near Aldbury And Wigginton
-
Tring Station
-
Berkhamsted Station
-
Cheddington Station
-
Wendover Station
-
Chesham Station
-
Hemel Hempstead Station
-
Great Missenden Station
-
Stoke Mandeville Station
-
Amersham Station
-
Apsley Station
- FAQ
- Price Paid By Year
- Property Type Price
Frequently asked questions about Aldbury And Wigginton
What is the average price for a property for sale in Aldbury And Wigginton?
The average price for a property for sale in Aldbury And Wigginton is £788,105. This amount is 36% higher than the average price in Tring. There are 1,183 property listings for sale in Aldbury And Wigginton.
What streets have the most expensive properties for sale in Aldbury And Wigginton?
The streets with the most expensive properties for sale in Aldbury And Wigginton are Tinkers Lane at an average of £1,350,333, The Twist at an average of £1,313,750 and Beechwood Drive at an average of £1,302,500.
What streets have the most affordable properties for sale in Aldbury And Wigginton?
The streets with the most affordable properties for sale in Aldbury And Wigginton are Royal Court at an average of £291,600, Field End Close at an average of £393,333 and Tring Station at an average of £396,300.
Which train stations are available in or near Aldbury And Wigginton?
Some of the train stations available in or near Aldbury And Wigginton are Tring, Berkhamsted and Cheddington.
Which tube stations are available in or near Aldbury And Wigginton?
Some of the tube stations available in or near Aldbury And Wigginton are Chesham and Amersham.
Property Price Paid in Aldbury And Wigginton by Year
The average sold property price by year was:
| Year | Average Sold Price | Price Change |
Sold Properties
|
|---|---|---|---|
| 2025 | £982,714 | 28% |
14 Properties |
| 2024 | £708,344 | -10% |
31 Properties |
| 2023 | £776,661 | -2% |
26 Properties |
| 2022 | £790,086 | 11% |
23 Properties |
| 2021 | £702,152 | 12% |
45 Properties |
| 2020 | £617,748 | -24% |
29 Properties |
| 2019 | £765,870 | 8% |
27 Properties |
| 2018 | £702,870 | 11% |
22 Properties |
| 2017 | £623,529 | -1% |
17 Properties |
| 2016 | £630,786 | -11% |
34 Properties |
| 2015 | £698,476 | 34% |
39 Properties |
| 2014 | £458,682 | -34% |
39 Properties |
| 2013 | £616,860 | 25% |
29 Properties |
| 2012 | £461,272 | -3% |
30 Properties |
| 2011 | £477,151 | 9% |
26 Properties |
| 2010 | £435,111 | -33% |
26 Properties |
| 2009 | £576,541 | 12% |
25 Properties |
| 2008 | £507,461 | 9% |
27 Properties |
| 2007 | £461,833 | 14% |
34 Properties |
| 2006 | £398,758 | -9% |
51 Properties |
| 2005 | £433,604 | -1% |
36 Properties |
| 2004 | £436,230 | 28% |
35 Properties |
| 2003 | £313,228 | 20% |
37 Properties |
| 2002 | £250,351 | -14% |
52 Properties |
| 2001 | £284,172 | -18% |
43 Properties |
| 2000 | £335,688 | 42% |
31 Properties |
| 1999 | £193,046 | -4% |
47 Properties |
| 1998 | £199,942 | 16% |
40 Properties |
| 1997 | £167,511 | 19% |
59 Properties |
| 1996 | £135,986 | 4% |
51 Properties |
| 1995 | £130,987 | - |
43 Properties |
Property Price per Property Type in Aldbury And Wigginton
Here you can find historic sold price data in order to help with your property search.
The average Property Paid Price for specific property types in the last three years are:
| Property Type | Average Sold Price | Sold Properties |
|---|---|---|
| Semi Detached House | £649,399.00 | 28 Semi Detached Houses |
| Detached House | £1,086,320.00 | 39 Detached Houses |
| Terraced House | £582,010.00 | 20 Terraced Houses |
| Flat | £270,285.00 | 7 Flats |

