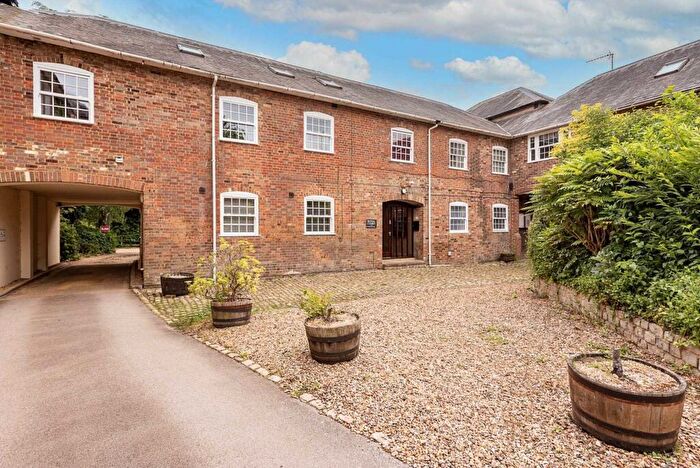
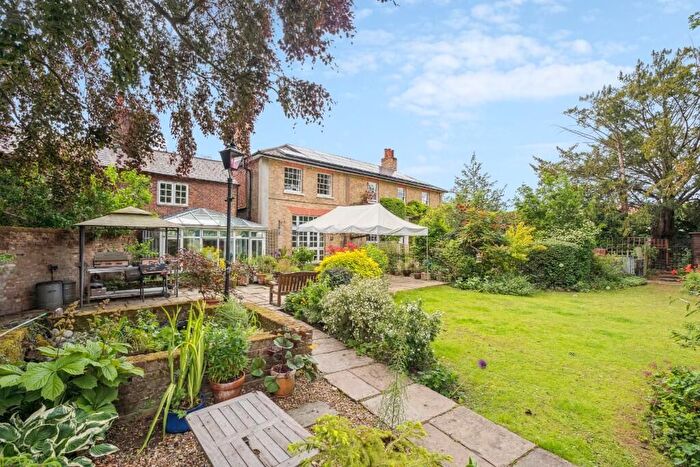
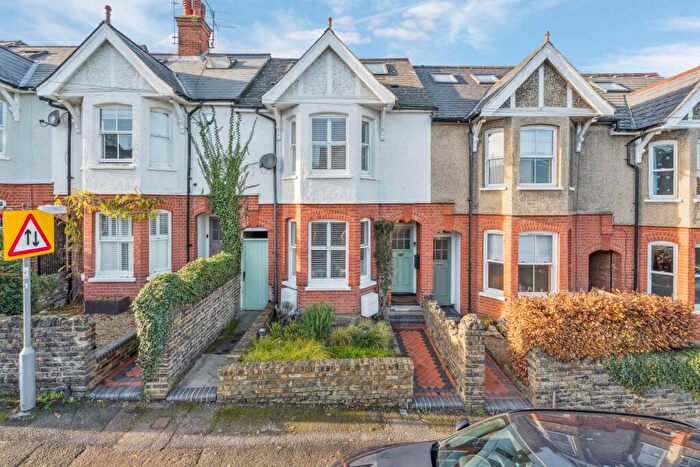
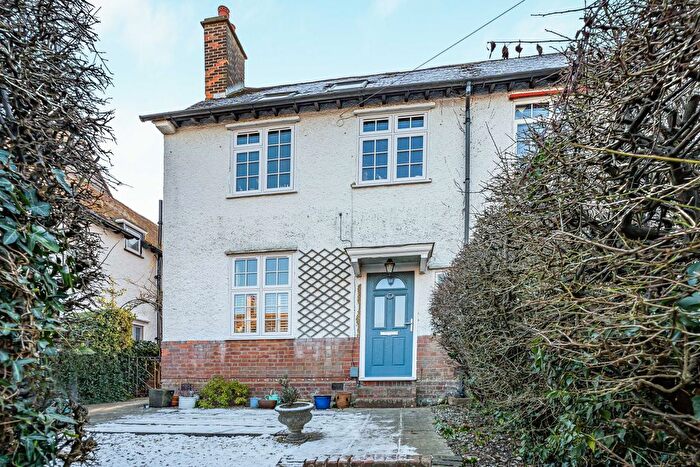
Houses for sale & to rent in Northchurch, Berkhamsted
House Prices in Northchurch
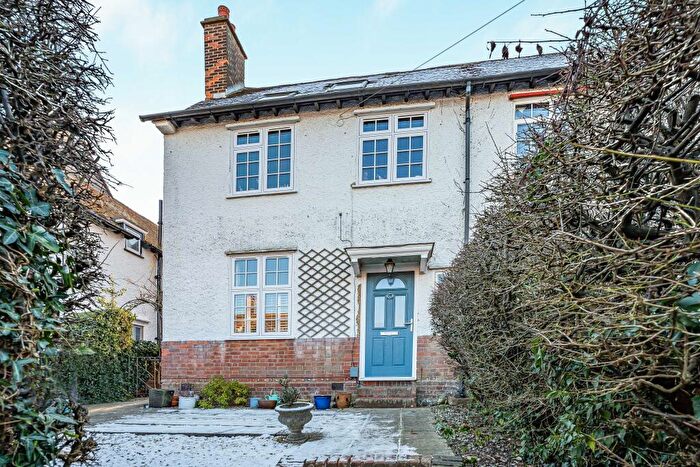
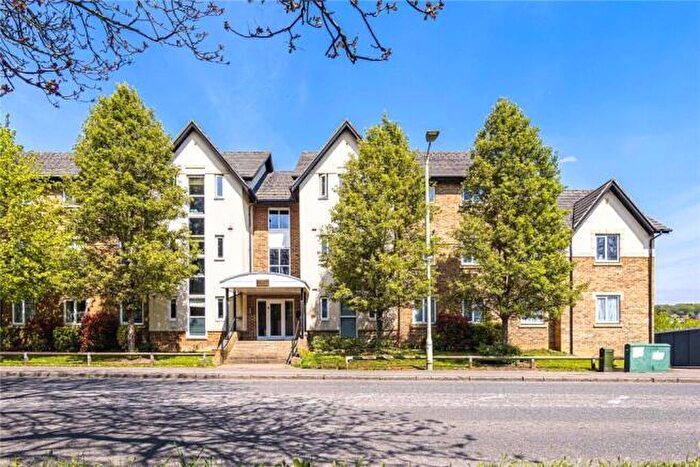
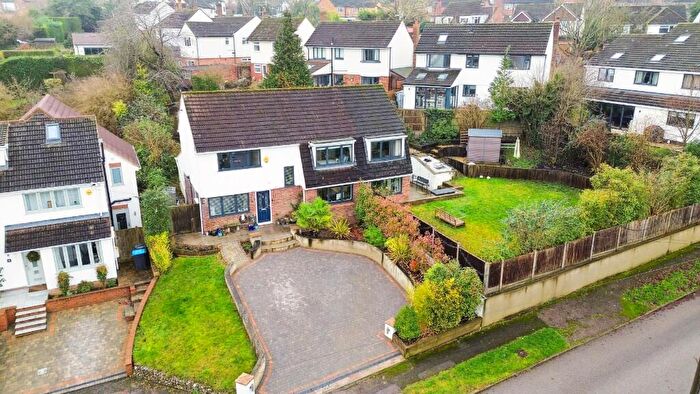
Properties in Northchurch have an average house price of £583,807.00 and had 171 Property Transactions within the last 3 years¹.
Northchurch is an area in Berkhamsted, Hertfordshire with 1,260 households², where the most expensive property was sold for £1,420,000.00.
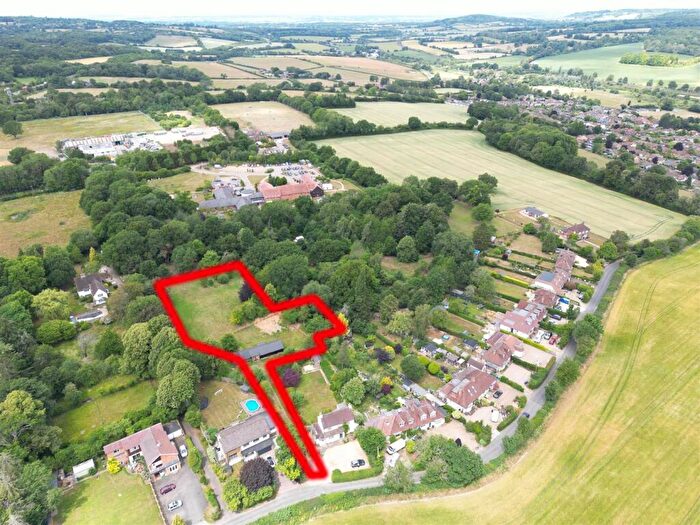
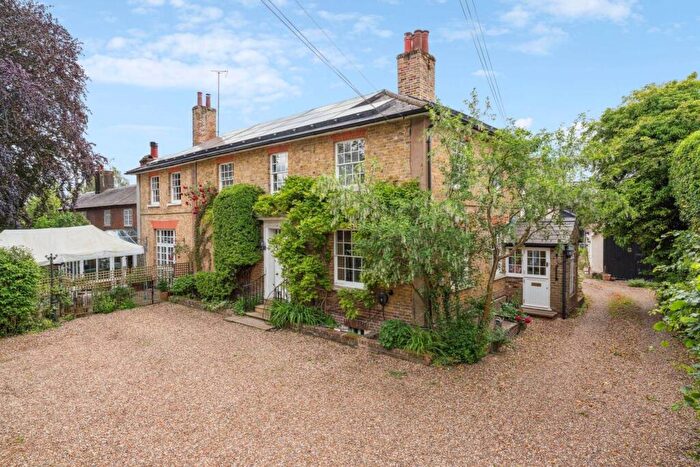
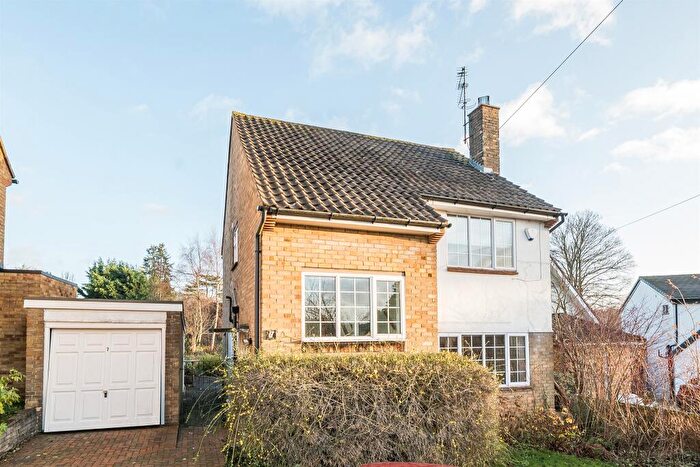
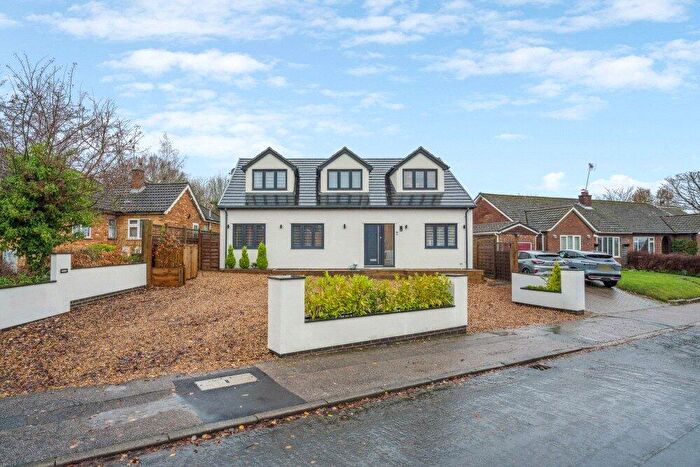
Properties for sale in Northchurch
Roads and Postcodes in Northchurch
Navigate through our locations to find the location of your next house in Northchurch, Berkhamsted for sale or to rent.
| Streets | Postcodes |
|---|---|
| Alma Road | HP4 3RF |
| Alyngton | HP4 3XP |
| Applecroft | HP4 3RX |
| Ashby Road | HP4 3SJ |
| Bell Lane | HP4 3RD HP4 3RE HP4 3TS |
| Berkhamsted Common | HP4 1PT HP4 1PU |
| Birch Road | HP4 3SQ |
| Boswick Lane | HP4 3TE HP4 3TH |
| Brakynbery | HP4 3XN |
| Bridgewater Hill | HP4 1LW |
| Chandler Mews | HP4 3HN |
| Chapel Crofts | HP4 3XG |
| Compass Point | HP4 3XD |
| Cornfield Crescent | HP4 3YX HP4 3YY |
| Covert Close | HP4 3SR |
| Covert Road | HP4 3RR HP4 3RS HP4 3SS |
| Darrs Lane | HP4 3RH HP4 3RJ HP4 3TT |
| Dell Road | HP4 3SP |
| Dudswell Lane | HP4 3TF HP4 3TQ |
| Duncombe Road | HP4 3RG |
| Durrants Lane | HP4 3UJ |
| Egglesfield Close | HP4 3PB |
| Emerton Court | HP4 3XL |
| Emerton Garth | HP4 3XJ |
| Exhims Mews | HP4 3RA |
| Friars Field | HP4 3XE |
| Ghyll Gardens | HP4 3YU |
| Granville Road | HP4 3RL HP4 3RN |
| Hadfield Place | HP4 3BE |
| Hamberlins Lane | HP4 3TB HP4 3TD |
| Haxters End | HP4 3FJ |
| Hedgehog Way | HP4 3FB |
| Herons Elm | HP4 3XR |
| High Street | HP4 3QH HP4 3QL HP4 3QN HP4 3QR HP4 3QS HP4 3QU HP4 3SH HP4 3QW |
| High Street South | HP4 3QT |
| Home Farm | HP4 3SN HP4 3SW |
| Home Farm Road | HP4 3SL |
| Kite Field | HP4 3XA |
| Limit Home Park | HP4 3ST |
| Loxley Road | HP4 3FN |
| Lyme Avenue | HP4 3SG |
| Mandelyns | HP4 3XH |
| Meadow Croft | HP4 3YT |
| Merling Croft | HP4 3XB |
| New Road | HP4 1LN HP4 1LP HP4 3QY HP4 1NJ HP4 3QZ |
| Northchurch Common | HP4 1LR HP4 1LS |
| Old Oak Gardens | HP4 3YD |
| Park Rise | HP4 3RT |
| Paynes Field Close | HP4 3SB |
| Pea Lane | HP4 3SX |
| Peters Place | HP4 3RU |
| Pine Walk | HP4 3YZ |
| Rivington Gardens | HP4 3ER |
| Rossway | HP4 3UA |
| Seymour Road | HP4 3RQ HP4 3RZ |
| Shootersway | HP4 3TU HP4 3TY |
| Southbank Road | HP4 1LL |
| Spring Garden Lane | HP4 3GW HP4 3GY |
| St Marys Avenue | HP4 3RP HP4 3RW |
| Stoney Close | HP4 3RB |
| Swallowtail Walk | HP4 1TP |
| The Larches | HP4 3TX |
| The Meads | HP4 3QX |
| Tring Road | HP4 3SE HP4 3SF HP4 3SY HP4 3SZ HP4 3TA HP4 3TL |
| Tudor Orchard | HP4 3QP |
| Valley Road | HP4 3QE HP4 3QF |
| Wharf Lane | HP4 3TG HP4 3YA |
| Woodcock Hill | HP4 3TR |
| HP4 1LB HP4 1RB HP4 1LA HP4 1LE HP4 2QA HP4 3UQ HP4 3FD |
Transport near Northchurch
- FAQ
- Price Paid By Year
- Property Type Price
Frequently asked questions about Northchurch
What is the average price for a property for sale in Northchurch?
The average price for a property for sale in Northchurch is £583,807. This amount is 21% lower than the average price in Berkhamsted. There are 1,490 property listings for sale in Northchurch.
What streets have the most expensive properties for sale in Northchurch?
The streets with the most expensive properties for sale in Northchurch are Shootersway at an average of £1,150,000, Northchurch Common at an average of £1,012,120 and Dell Road at an average of £973,333.
What streets have the most affordable properties for sale in Northchurch?
The streets with the most affordable properties for sale in Northchurch are Old Oak Gardens at an average of £247,500, Tudor Orchard at an average of £273,000 and Home Farm at an average of £282,500.
Which train stations are available in or near Northchurch?
Some of the train stations available in or near Northchurch are Berkhamsted, Tring and Hemel Hempstead.
Which tube stations are available in or near Northchurch?
The tube station available in or near Northchurch is Chesham.
Property Price Paid in Northchurch by Year
The average sold property price by year was:
| Year | Average Sold Price | Price Change |
Sold Properties
|
|---|---|---|---|
| 2025 | £602,817 | 9% |
23 Properties |
| 2024 | £547,401 | -6% |
51 Properties |
| 2023 | £579,156 | -6% |
42 Properties |
| 2022 | £613,165 | 8% |
55 Properties |
| 2021 | £561,742 | -65% |
71 Properties |
| 2020 | £927,812 | 42% |
40 Properties |
| 2019 | £535,722 | 1% |
47 Properties |
| 2018 | £528,821 | 3% |
38 Properties |
| 2017 | £510,625 | -2% |
50 Properties |
| 2016 | £521,531 | 0,1% |
48 Properties |
| 2015 | £520,857 | 28% |
62 Properties |
| 2014 | £374,475 | 13% |
65 Properties |
| 2013 | £326,172 | -21% |
68 Properties |
| 2012 | £393,658 | 6% |
47 Properties |
| 2011 | £369,261 | -3% |
57 Properties |
| 2010 | £381,387 | 25% |
68 Properties |
| 2009 | £286,757 | -3% |
46 Properties |
| 2008 | £295,715 | -19% |
43 Properties |
| 2007 | £352,173 | 10% |
91 Properties |
| 2006 | £318,086 | 7% |
94 Properties |
| 2005 | £295,373 | -1% |
67 Properties |
| 2004 | £297,820 | 26% |
73 Properties |
| 2003 | £221,592 | 1% |
70 Properties |
| 2002 | £218,376 | 15% |
88 Properties |
| 2001 | £186,226 | -4% |
60 Properties |
| 2000 | £193,414 | 14% |
62 Properties |
| 1999 | £166,070 | 13% |
92 Properties |
| 1998 | £144,507 | 20% |
71 Properties |
| 1997 | £114,889 | 12% |
72 Properties |
| 1996 | £101,380 | 2% |
84 Properties |
| 1995 | £99,167 | - |
43 Properties |
Property Price per Property Type in Northchurch
Here you can find historic sold price data in order to help with your property search.
The average Property Paid Price for specific property types in the last three years are:
| Property Type | Average Sold Price | Sold Properties |
|---|---|---|
| Semi Detached House | £613,776.00 | 39 Semi Detached Houses |
| Detached House | £822,208.00 | 55 Detached Houses |
| Terraced House | £421,103.00 | 65 Terraced Houses |
| Flat | £275,041.00 | 12 Flats |

