
Houses for sale & to rent in Bushey St James, Watford
House Prices in Bushey St James
Properties in Bushey St James have an average house price of £686,000.00 and had 7 Property Transactions within the last 3 years¹.
Bushey St James is an area in Watford, Hertfordshire with 85 households², where the most expensive property was sold for £825,000.00.
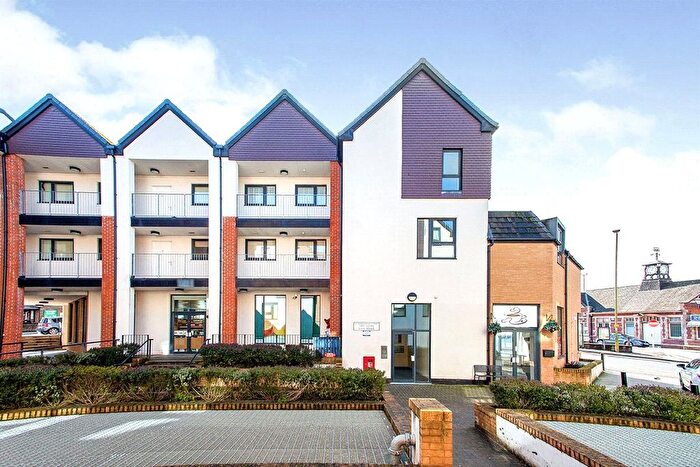
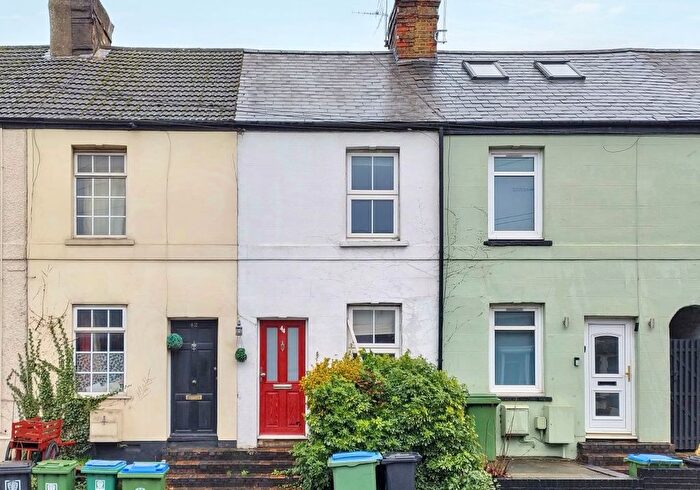
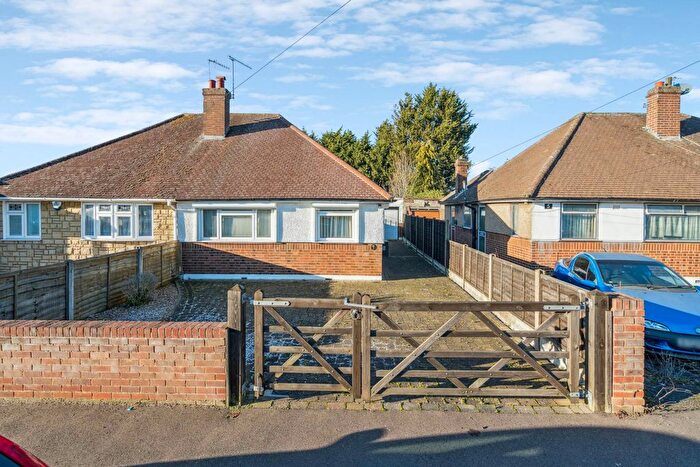
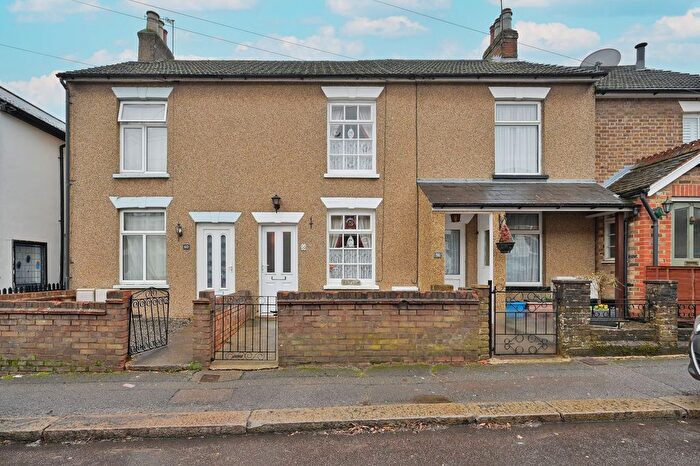
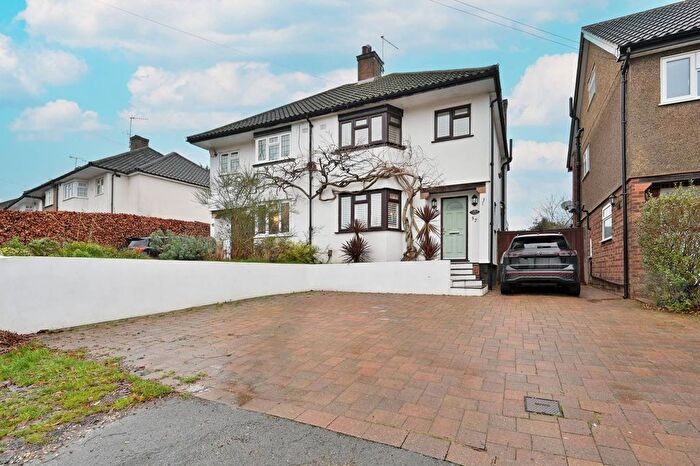
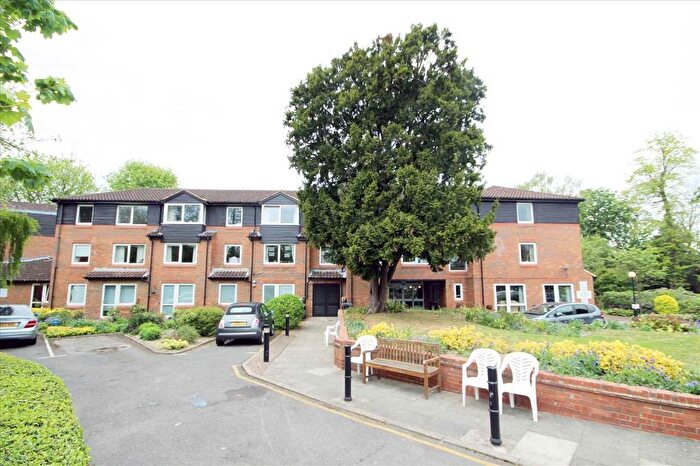
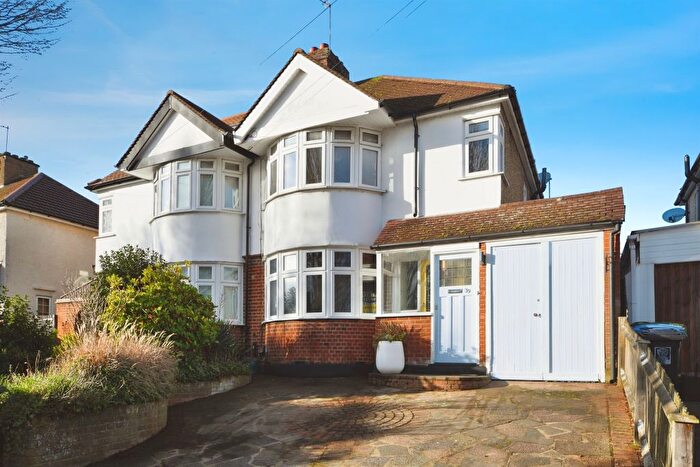
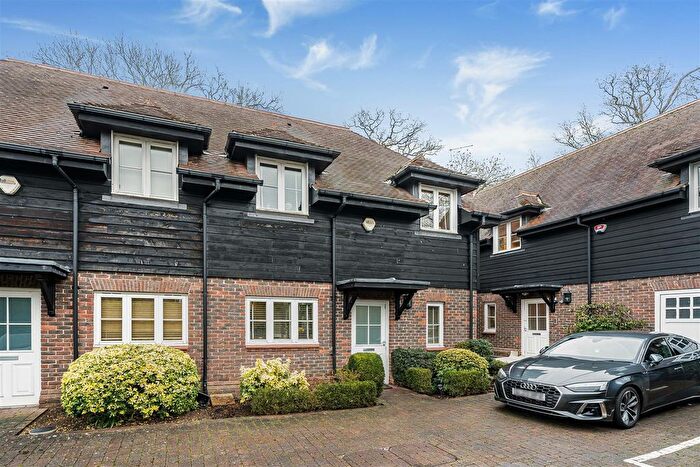
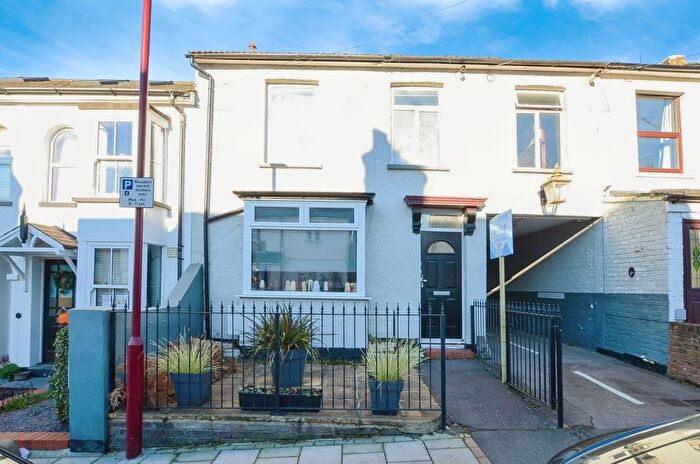
Properties for sale in Bushey St James
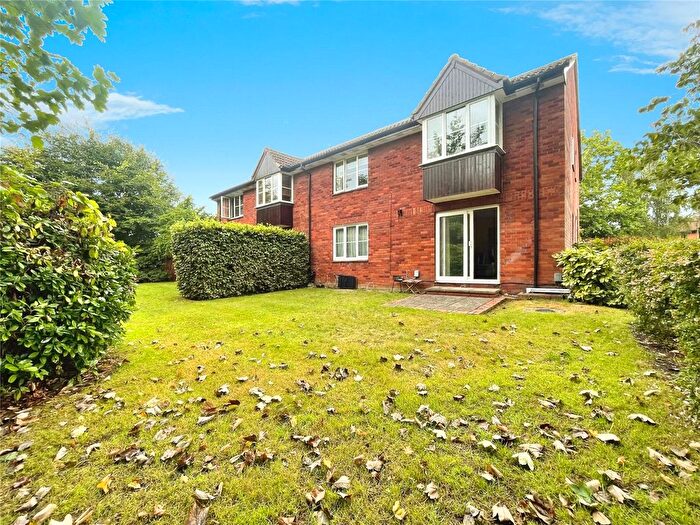
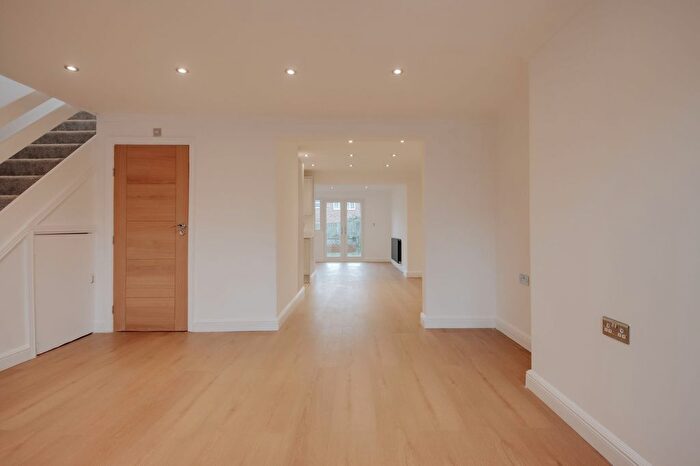
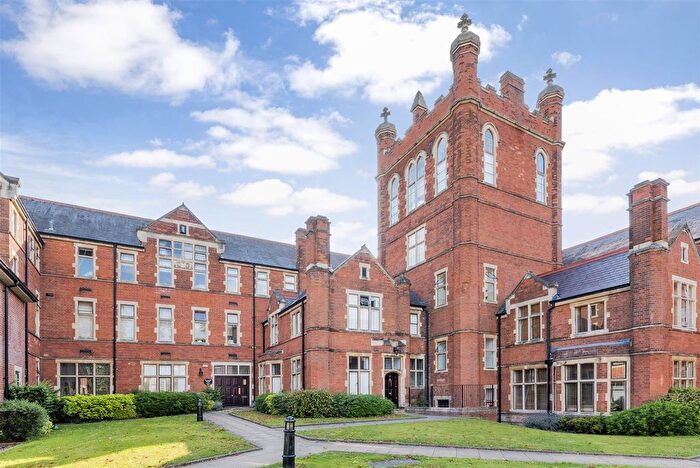
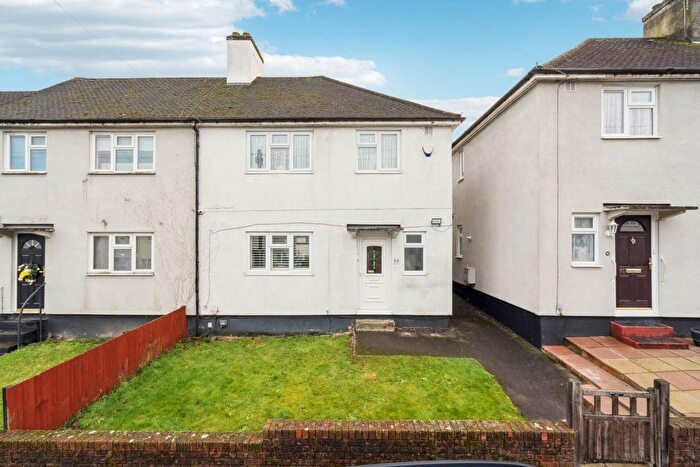
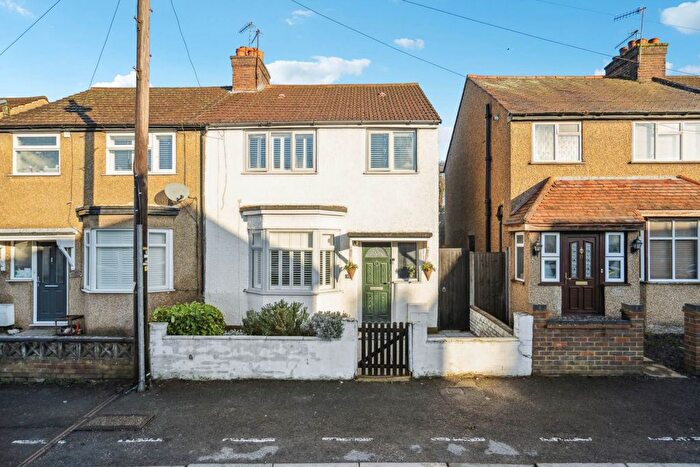
![]()
If you are looking to sell your house, let it out, or receive a property valuation, an expert can help you.
Click the button below to get started.
Roads and Postcodes in Bushey St James
Navigate through our locations to find the location of your next house in Bushey St James, Watford for sale or to rent.
| Streets | Postcodes |
|---|---|
| Brick Kiln Close | WD19 4DG |
| Burn Close | WD25 8HQ |
| Cross Road | WD19 4DQ |
| Elton Way | WD25 8AF WD25 8HA WD25 8HB WD25 8HD WD25 8HH WD25 8FD |
| Hartspring Lane | WD25 8AQ WD25 8JS |
| Haydon Road | WD19 4DE |
| Horsehaven Mews | WD19 4FT |
| Plantation Close | WD23 2PN |
| Sandy Lane | WD25 8HE WD25 8HF |
| Tylers Way | WD25 8JH WD25 8WT |
Transport near Bushey St James
-

 Bushey Station
 -
Watford High Street Station
-
Watford Junction Station
-
Watford North Station
-
Carpenders Park Station
-
Garston (Hertfordshire) Station
-
 Watford Station
 -
Radlett Station
- FAQ
- Price Paid By Year
- Property Type Price
Frequently asked questions about Bushey St James
What is the average price for a property for sale in Bushey St James?
The average price for a property for sale in Bushey St James is £686,000. This amount is 51% higher than the average price in Watford. There are 2,969 property listings for sale in Bushey St James.
What streets have the most expensive properties for sale in Bushey St James?
The street with the most expensive properties for sale in Bushey St James is Horsehaven Mews at an average of £755,000.
What streets have the most affordable properties for sale in Bushey St James?
The street with the most affordable properties for sale in Bushey St James is Haydon Road at an average of £625,000.
Which train stations are available in or near Bushey St James?
Some of the train stations available in or near Bushey St James are Bushey, Watford High Street and Watford Junction.
Which tube stations are available in or near Bushey St James?
The tube station available in or near Bushey St James is Watford.
Property Price Paid in Bushey St James by Year
The average sold property price by year was:
| Year | Average Sold Price | Price Change |
Sold Properties
|
|---|---|---|---|
| 2025 | £755,000 | 23% |
1 Property |
| 2024 | £585,000 | -13% |
1 Property |
| 2023 | £659,250 | -25% |
4 Properties |
| 2022 | £825,000 | 16% |
1 Property |
| 2021 | £690,000 | -12% |
1 Property |
| 2020 | £773,642 | 1% |
7 Properties |
| 2019 | £766,444 | 10% |
9 Properties |
| 2018 | £689,285 | 26% |
7 Properties |
| 2017 | £512,000 | -5% |
1 Property |
| 2016 | £540,000 | -39% |
2 Properties |
| 2015 | £749,750 | 51% |
2 Properties |
| 2014 | £364,000 | 1% |
5 Properties |
| 2013 | £360,333 | -6% |
3 Properties |
| 2012 | £382,666 | 33% |
3 Properties |
| 2011 | £255,000 | -45% |
1 Property |
| 2010 | £369,990 | -25% |
5 Properties |
| 2009 | £461,242 | 35% |
1 Property |
| 2007 | £299,180 | -35% |
5 Properties |
| 2006 | £402,500 | 28% |
1 Property |
| 2005 | £290,000 | 10% |
1 Property |
| 2004 | £260,250 | -13% |
4 Properties |
| 2003 | £295,000 | 14% |
1 Property |
| 2002 | £252,966 | 27% |
3 Properties |
| 2001 | £185,000 | -18% |
2 Properties |
| 2000 | £218,000 | 56% |
1 Property |
| 1999 | £96,000 | -20% |
1 Property |
| 1998 | £115,316 | -11% |
3 Properties |
| 1997 | £128,000 | 14% |
4 Properties |
| 1996 | £109,500 | 38% |
4 Properties |
| 1995 | £68,250 | - |
4 Properties |
Property Price per Property Type in Bushey St James
Here you can find historic sold price data in order to help with your property search.
The average Property Paid Price for specific property types in the last three years are:
| Property Type | Average Sold Price | Sold Properties |
|---|---|---|
| Semi Detached House | £699,000.00 | 3 Semi Detached Houses |
| Terraced House | £625,000.00 | 2 Terraced Houses |
| Detached House | £727,500.00 | 2 Detached Houses |