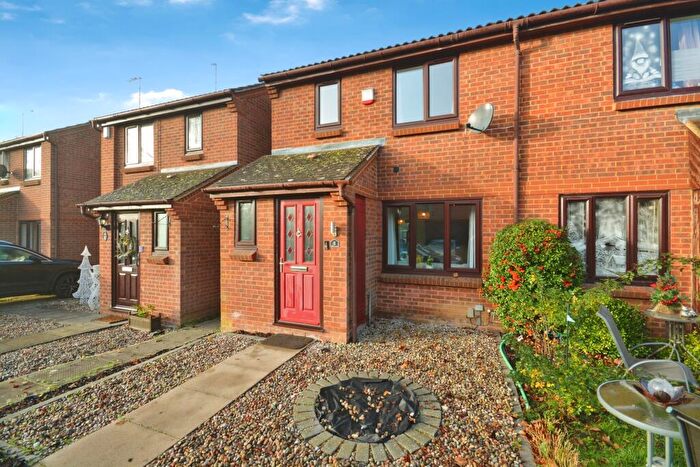
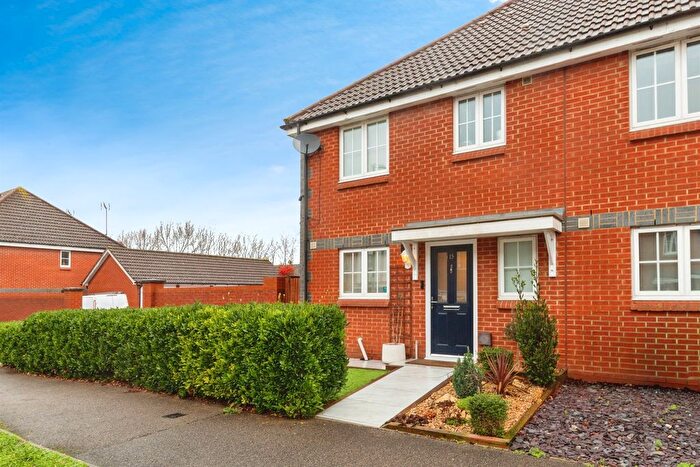
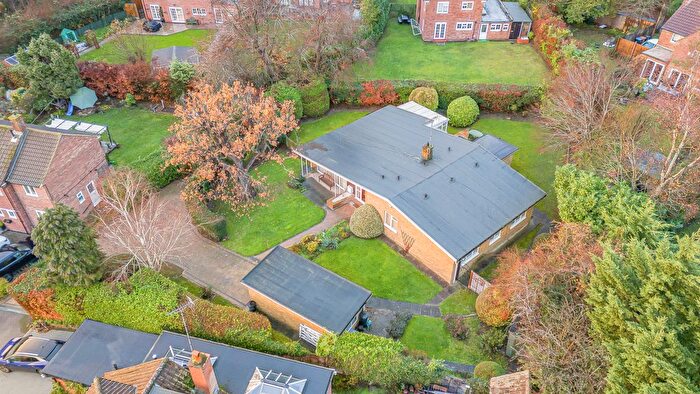
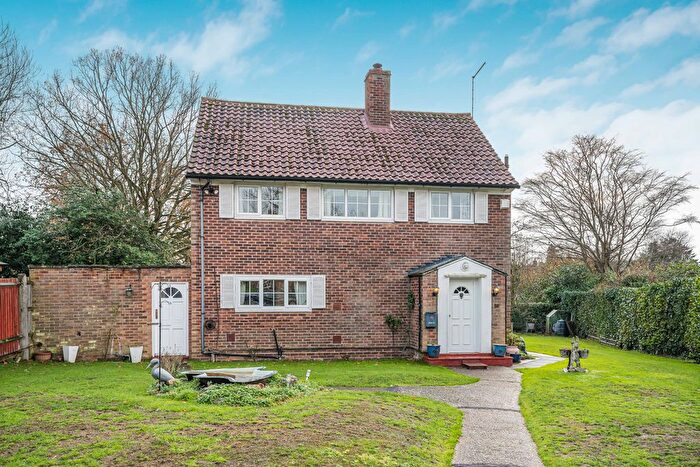
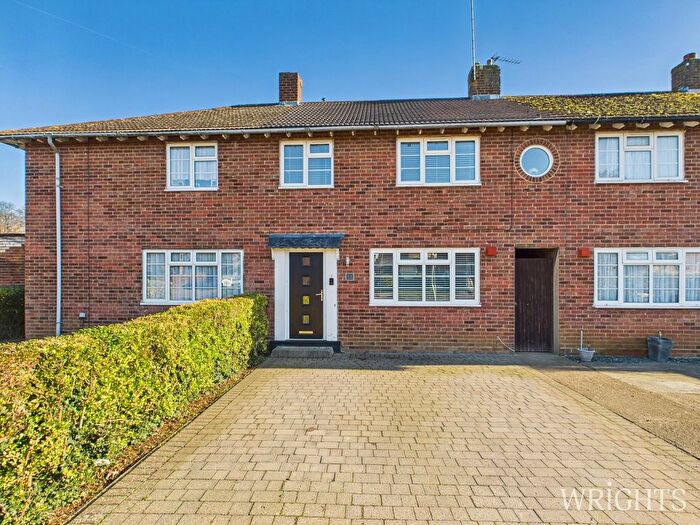
Houses for sale & to rent in Hollybush, Welwyn Garden City
House Prices in Hollybush
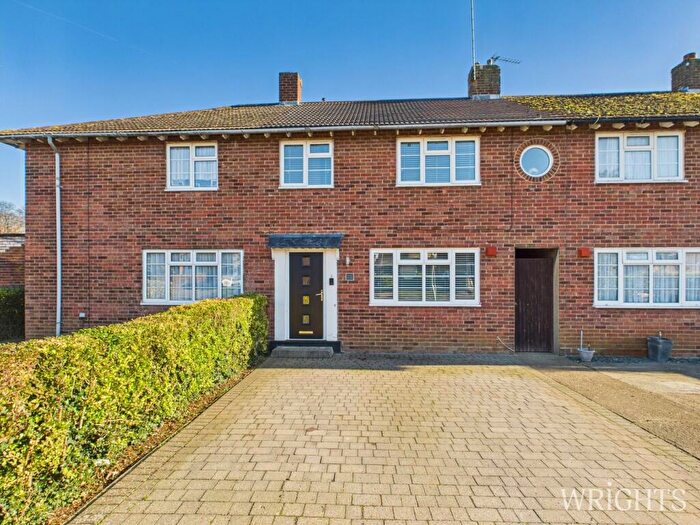
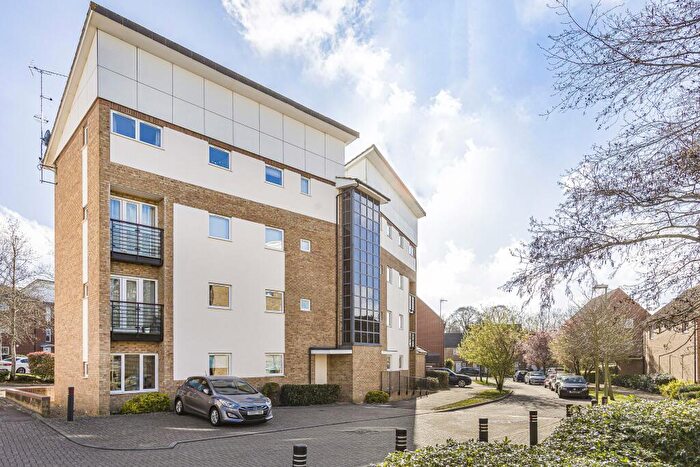
Properties in Hollybush have an average house price of £382,102.00 and had 280 Property Transactions within the last 3 years¹.
Hollybush is an area in Welwyn Garden City, Hertfordshire with 2,924 households², where the most expensive property was sold for £785,000.00.
Properties for sale in Hollybush
Roads and Postcodes in Hollybush
Navigate through our locations to find the location of your next house in Hollybush, Welwyn Garden City for sale or to rent.
| Streets | Postcodes |
|---|---|
| Ascots Lane | AL7 4HL |
| Bartlett Close | AL7 4AX |
| Beehive Green | AL7 4BE AL7 4BG |
| Beehive Lane | AL7 4BA AL7 4BP AL7 4BQ AL7 4BW |
| Berwick Place | AL7 4TU |
| Boundary Court | AL7 4DZ |
| Boundary Lane | AL7 4DF AL7 4DL AL7 4DP AL7 4DY AL7 4EA AL7 4EF AL7 4EG AL7 4EJ AL7 4EQ AL7 4EH |
| Burrowfield | AL7 4SL AL7 4SZ AL7 4SN AL7 4SR |
| Camfield | AL7 4ED |
| Chambers Grove | AL7 4FG AL7 4FQ |
| Chequers | AL7 4SJ AL7 4TA |
| Chequers Field | AL7 4TX |
| Cole Green Lane | AL7 3JA AL7 3JD AL7 3PD AL7 3PW |
| Drycroft | AL7 4DH |
| East Burrowfield | AL7 4TB |
| Eddington Crescent | AL7 4SQ AL7 4SX AL7 4SY |
| Elliott Close | AL7 4TZ |
| Four Acres | AL7 4NW |
| Golden Dell | AL7 4EB AL7 4EE |
| Gooseacre | AL7 4NB |
| Great Ley | AL7 4TJ AL7 4TL AL7 4TR AL7 4TS |
| Green Acres | AL7 4LJ |
| Harebell | AL7 4HR |
| Hitherbaulk | AL7 4TD |
| Hollybush Lane | AL7 4JH AL7 4JL AL7 4JN AL7 4JR AL7 4JS AL7 4JT AL7 4JW AL7 4JJ AL7 4JU |
| Homestead Court | AL7 4LY AL7 4LZ |
| Homestead Lane | AL7 4LT AL7 4LU AL7 4NF AL7 4NX AL7 4NZ |
| Howlands | AL7 4ET AL7 4HA AL7 4HB AL7 4HD AL7 4HE AL7 4HN AL7 4HP AL7 4HS AL7 4HT AL7 4HW |
| Hunters Way | AL7 4NN AL7 4NP AL7 4NR AL7 4NT |
| Hyde Valley | AL7 4NA AL7 4DA AL7 4NE AL7 4PA |
| Katescroft | AL7 4DR |
| Kendall Close | AL7 4EW |
| Kenyon Place | AL7 4FA |
| Kingsley Court | AL7 4HZ |
| Lady Grove | AL7 4DS AL7 4DU |
| Lawrence Hall End | AL7 4FB |
| Layton Street | AL7 4FE AL7 4FF |
| Leigh Common | AL7 4NG AL7 4NJ AL7 4NL AL7 4NU |
| Linkfield | AL7 4DN AL7 4DW |
| Little Burrow | AL7 4SP AL7 4SW |
| Little Ley | AL7 4TN |
| Little Wade | AL7 4LE |
| Marley Road | AL7 4BS AL7 4BT |
| Meadway | AL7 4NH AL7 4NQ |
| Merrifield Court | AL7 4SG AL7 4SH |
| Middlefield | AL7 4DJ AL7 4DQ |
| Mount Way | AL7 4JX AL7 4LA AL7 4LB AL7 4LD AL7 4LF |
| Mountway Close | AL7 4JZ |
| Oaken Grove | AL7 4FD AL7 4TP |
| Old Dairy Yard | AL7 4BY |
| Pinnate Place | AL7 4DX |
| Purdom Road | AL7 4FH |
| Raymonds Close | AL7 4TH |
| Raymonds Plain | AL7 4TE AL7 4TF AL7 4TQ |
| Rollswood | AL7 4DG |
| Ryelands | AL7 4LH AL7 4LQ |
| Sir John Newsom Way | AL7 4FJ AL7 4FL |
| South Ley | AL7 4JP |
| South Ley Court | AL7 4LL |
| Southfield | AL7 4ST |
| St Josephs Green | AL7 4TT |
| The Croft | AL7 4JY |
| The Wade | AL7 4LG |
| Twelve Acres | AL7 4FN AL7 4TG |
| Two Acres | AL7 4NS |
| Walnut Court | AL7 4EZ |
| Walnut Grove | AL7 4EU AL7 4EY AL7 4EX |
| West Burrowfield | AL7 4TW |
| Woodhall Lane | AL7 3TR |
| AL7 4SS AL7 4SU |
Transport near Hollybush
- FAQ
- Price Paid By Year
- Property Type Price
Frequently asked questions about Hollybush
What is the average price for a property for sale in Hollybush?
The average price for a property for sale in Hollybush is £382,102. This amount is 12% lower than the average price in Welwyn Garden City. There are 1,037 property listings for sale in Hollybush.
What streets have the most expensive properties for sale in Hollybush?
The streets with the most expensive properties for sale in Hollybush are Gooseacre at an average of £600,000, Beehive Lane at an average of £595,000 and Kingsley Court at an average of £563,125.
What streets have the most affordable properties for sale in Hollybush?
The streets with the most affordable properties for sale in Hollybush are Chequers Field at an average of £229,312, Homestead Court at an average of £238,875 and Layton Street at an average of £246,500.
Which train stations are available in or near Hollybush?
Some of the train stations available in or near Hollybush are Welwyn Garden City, Hatfield and Welwyn North.
Property Price Paid in Hollybush by Year
The average sold property price by year was:
| Year | Average Sold Price | Price Change |
Sold Properties
|
|---|---|---|---|
| 2025 | £403,272 | 3% |
52 Properties |
| 2024 | £389,240 | 1% |
72 Properties |
| 2023 | £386,441 | 6% |
58 Properties |
| 2022 | £363,056 | 2% |
98 Properties |
| 2021 | £354,686 | -3% |
127 Properties |
| 2020 | £366,367 | 9% |
74 Properties |
| 2019 | £332,461 | -1% |
80 Properties |
| 2018 | £337,262 | 1% |
95 Properties |
| 2017 | £334,857 | -0,1% |
101 Properties |
| 2016 | £335,311 | 15% |
121 Properties |
| 2015 | £285,702 | 14% |
127 Properties |
| 2014 | £245,484 | 2% |
146 Properties |
| 2013 | £240,630 | 10% |
99 Properties |
| 2012 | £217,705 | 3% |
91 Properties |
| 2011 | £210,457 | -5% |
87 Properties |
| 2010 | £220,842 | 9% |
89 Properties |
| 2009 | £199,938 | -4% |
78 Properties |
| 2008 | £207,558 | -1% |
104 Properties |
| 2007 | £210,654 | 4% |
226 Properties |
| 2006 | £202,018 | 1% |
314 Properties |
| 2005 | £199,314 | -16% |
167 Properties |
| 2004 | £230,751 | 18% |
231 Properties |
| 2003 | £190,344 | 20% |
191 Properties |
| 2002 | £153,161 | 17% |
95 Properties |
| 2001 | £127,639 | 11% |
77 Properties |
| 2000 | £113,087 | 12% |
88 Properties |
| 1999 | £99,931 | -1% |
69 Properties |
| 1998 | £100,841 | 24% |
54 Properties |
| 1997 | £76,764 | 8% |
55 Properties |
| 1996 | £70,497 | 5% |
59 Properties |
| 1995 | £67,149 | - |
52 Properties |
Property Price per Property Type in Hollybush
Here you can find historic sold price data in order to help with your property search.
The average Property Paid Price for specific property types in the last three years are:
| Property Type | Average Sold Price | Sold Properties |
|---|---|---|
| Semi Detached House | £489,558.00 | 63 Semi Detached Houses |
| Detached House | £659,600.00 | 5 Detached Houses |
| Terraced House | £422,478.00 | 113 Terraced Houses |
| Flat | £253,619.00 | 99 Flats |

