
Houses for sale & to rent in Pinkwell, Hayes
House Prices in Pinkwell
Properties in this part of Pinkwell within Hayes have an average house price of £460,097.00 and had 336 Property Transactions within the last 3 years¹. This area has 4,647 households² , where the most expensive property was sold for £850,000.00.
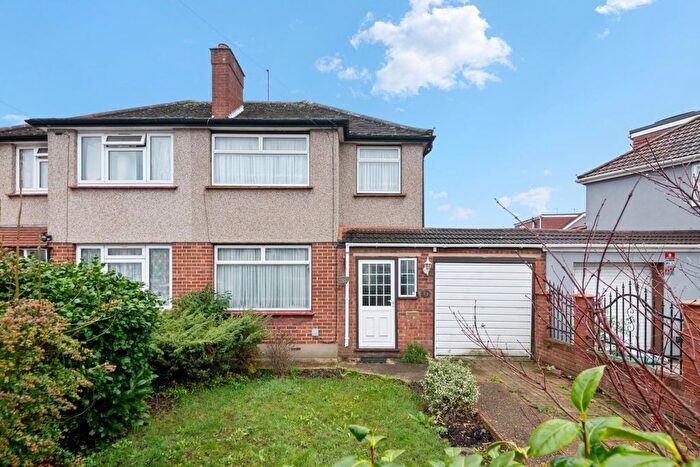
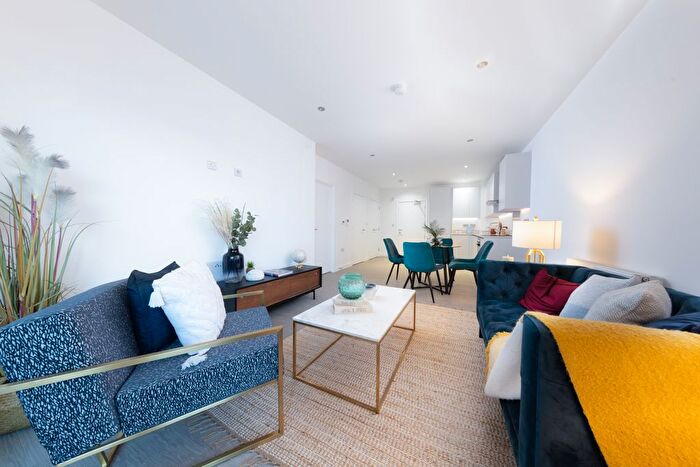
Properties for sale in Pinkwell
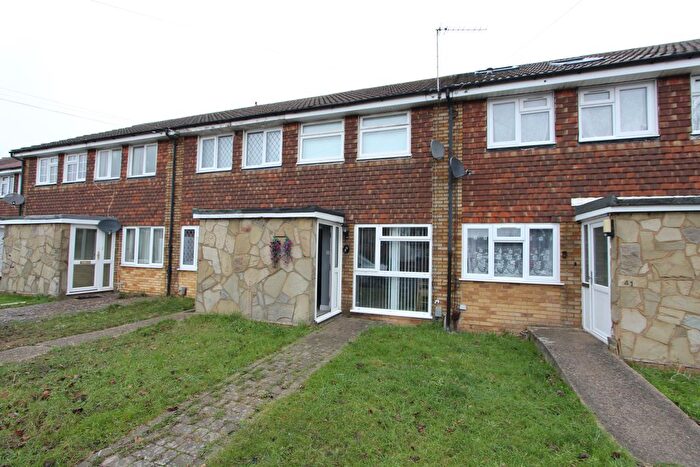
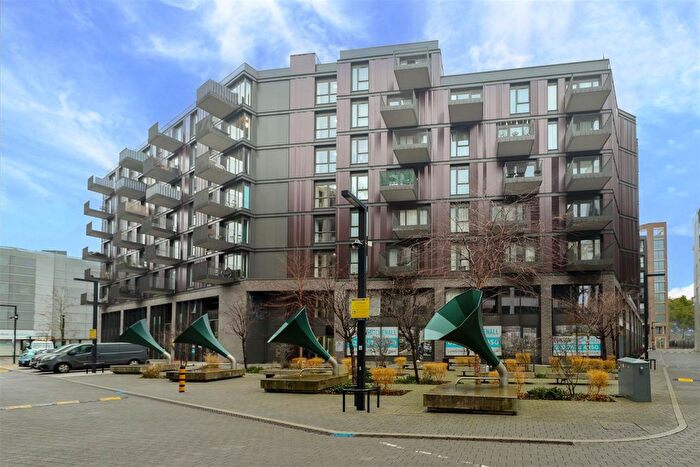
![]()
If you are looking to sell your house, let it out, or receive a property valuation, an expert can help you.
Click the button below to get started.

Previously listed properties in Pinkwell
Roads and Postcodes in Pinkwell
Navigate through our locations to find the location of your next house in Pinkwell, Hayes for sale or to rent.
Transport near Pinkwell
-

 Hayes and Harlington Station
 -
West Drayton Station
-
 Heathrow Terminals 1 2 3 Station
 -
Heathrow Terminals 2 and 3 Station
-
Hatton Cross Station
-
Southall Station
-
Hounslow West Station
-
Heathrow Terminal 4 Station
- FAQ
- Price Paid By Year
- Property Type Price
Frequently asked questions about Pinkwell
What is the average price for a property for sale in Pinkwell?
The average price for a property for sale in Pinkwell is £460,097. This amount is 9% higher than the average price in Hayes. There are 1,244 property listings for sale in Pinkwell.
What streets have the most expensive properties for sale in Pinkwell?
The streets with the most expensive properties for sale in Pinkwell are Carfax Road at an average of £650,000, Carnarvon Drive at an average of £591,666 and Colbrook Avenue at an average of £574,642.
What streets have the most affordable properties for sale in Pinkwell?
The streets with the most affordable properties for sale in Pinkwell are Copthorne Mews at an average of £218,666, Fairey Avenue at an average of £273,666 and Croyde Avenue at an average of £286,333.
Which train stations are available in or near Pinkwell?
Some of the train stations available in or near Pinkwell are Hayes and Harlington, West Drayton and Heathrow Terminals 1 2 3.
Which tube stations are available in or near Pinkwell?
Some of the tube stations available in or near Pinkwell are Heathrow Terminals 1 2 3, Hatton Cross and Hounslow West.
Property Price Paid in Pinkwell by Year
The average sold property price by year was:
| Year | Average Sold Price | Price Change |
Sold Properties
|
|---|---|---|---|
| 2025 | £485,672 | 5% |
50 Properties |
| 2024 | £459,182 | -0,4% |
91 Properties |
| 2023 | £460,888 | 3% |
90 Properties |
| 2022 | £448,032 | 7% |
105 Properties |
| 2021 | £417,910 | 6% |
140 Properties |
| 2020 | £394,645 | 2% |
69 Properties |
| 2019 | £385,384 | -1% |
76 Properties |
| 2018 | £390,254 | 3% |
84 Properties |
| 2017 | £376,891 | 5% |
105 Properties |
| 2016 | £359,780 | 14% |
95 Properties |
| 2015 | £310,953 | 14% |
109 Properties |
| 2014 | £265,950 | 14% |
122 Properties |
| 2013 | £229,042 | 0,4% |
102 Properties |
| 2012 | £228,029 | 1% |
70 Properties |
| 2011 | £225,860 | -1% |
103 Properties |
| 2010 | £227,686 | 7% |
101 Properties |
| 2009 | £212,571 | -16% |
80 Properties |
| 2008 | £246,270 | 4% |
126 Properties |
| 2007 | £236,209 | 14% |
284 Properties |
| 2006 | £202,871 | -1% |
238 Properties |
| 2005 | £204,991 | 1% |
156 Properties |
| 2004 | £203,487 | 6% |
207 Properties |
| 2003 | £191,600 | 22% |
242 Properties |
| 2002 | £148,660 | 12% |
223 Properties |
| 2001 | £130,302 | 8% |
160 Properties |
| 2000 | £120,117 | 20% |
178 Properties |
| 1999 | £95,519 | 16% |
231 Properties |
| 1998 | £80,207 | 11% |
214 Properties |
| 1997 | £71,193 | 12% |
190 Properties |
| 1996 | £62,975 | -0,3% |
183 Properties |
| 1995 | £63,152 | - |
137 Properties |
Property Price per Property Type in Pinkwell
Here you can find historic sold price data in order to help with your property search.
The average Property Paid Price for specific property types in the last three years are:
| Property Type | Average Sold Price | Sold Properties |
|---|---|---|
| Flat | £245,162.00 | 34 Flats |
| Semi Detached House | £506,969.00 | 170 Semi Detached Houses |
| Terraced House | £450,525.00 | 128 Terraced Houses |
| Detached House | £601,250.00 | 4 Detached Houses |