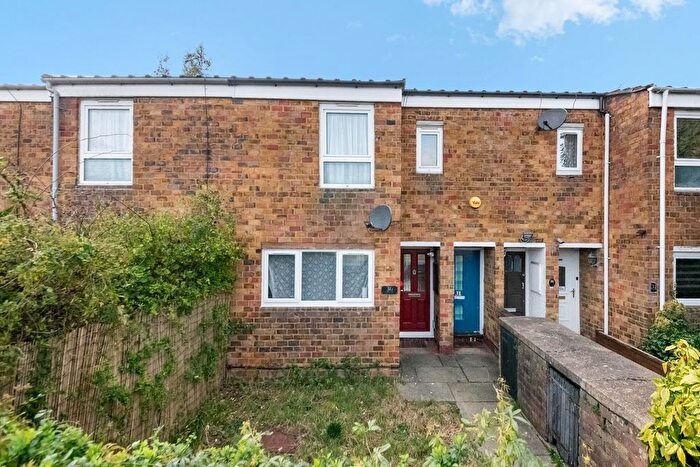
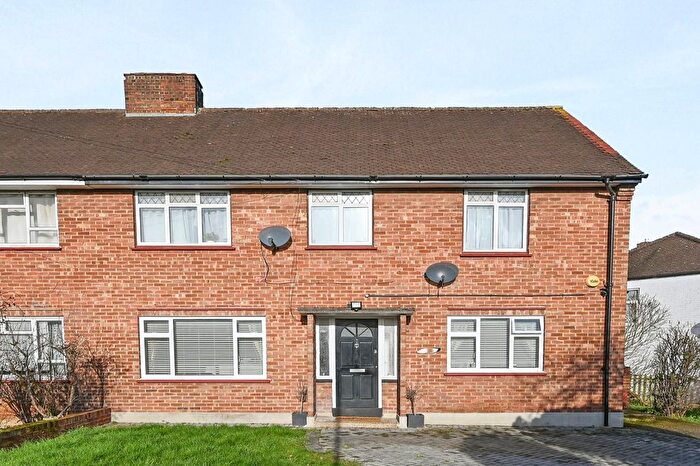
Houses for sale & to rent in Hayes, Hillingdon London Borough
House Prices in Hayes
Properties in this part of Hayes within the Hillingdon London Borough have an average house price of £424,994.00 and had 1,741 Property Transactions within the last 3 years.¹ This area has 29,357 households² , where the most expensive property was sold for £1,700,000.00.
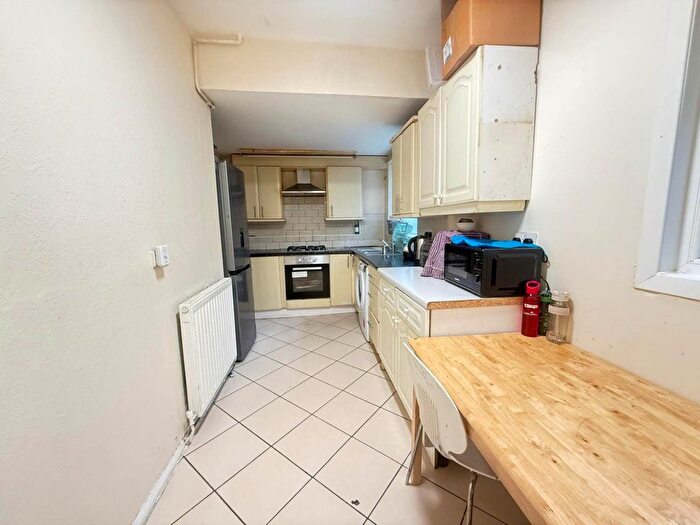
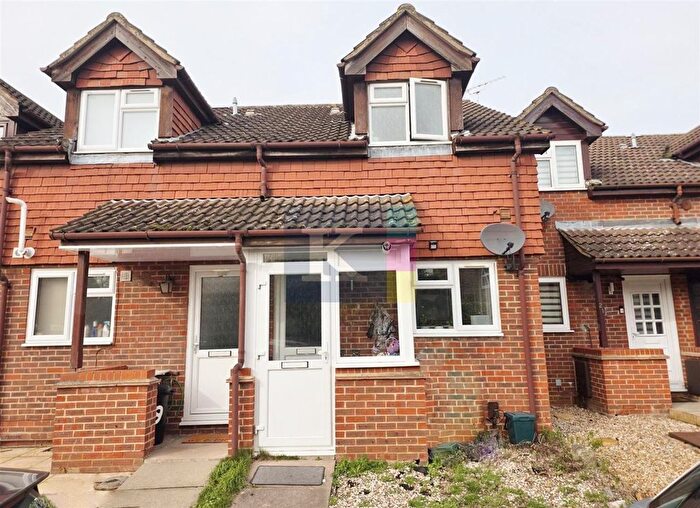
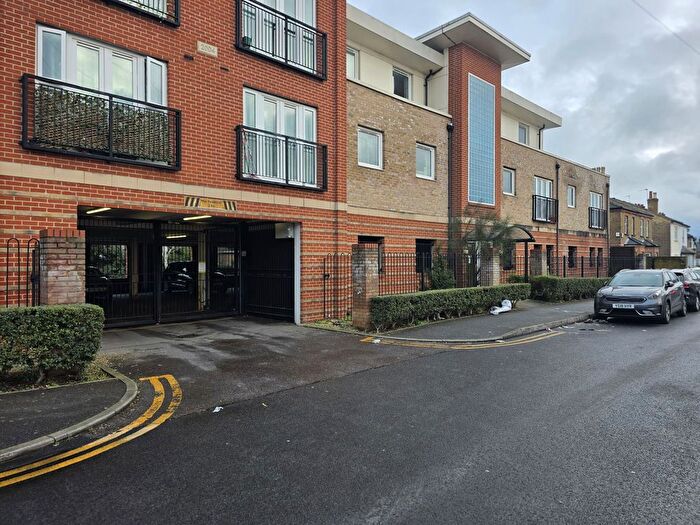
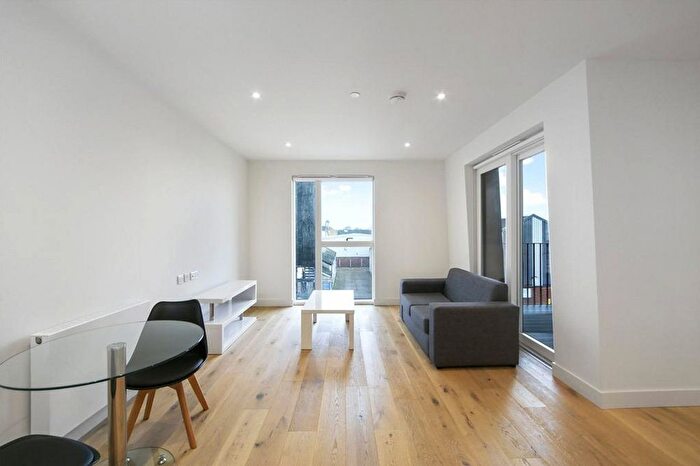
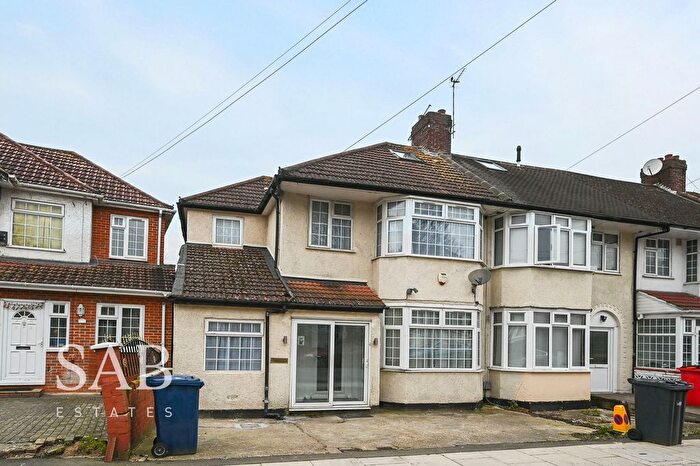
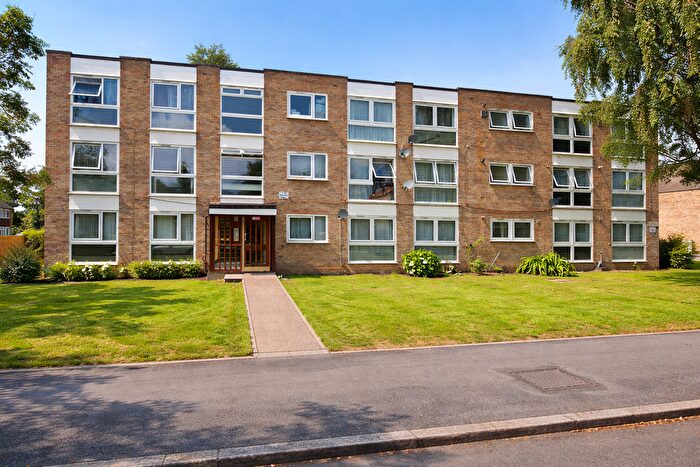
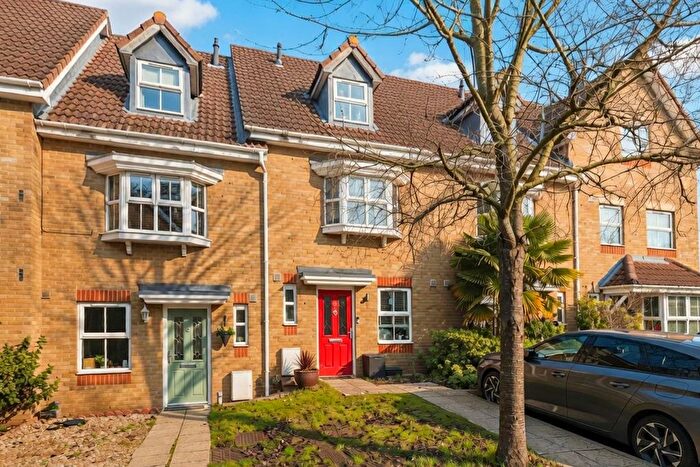
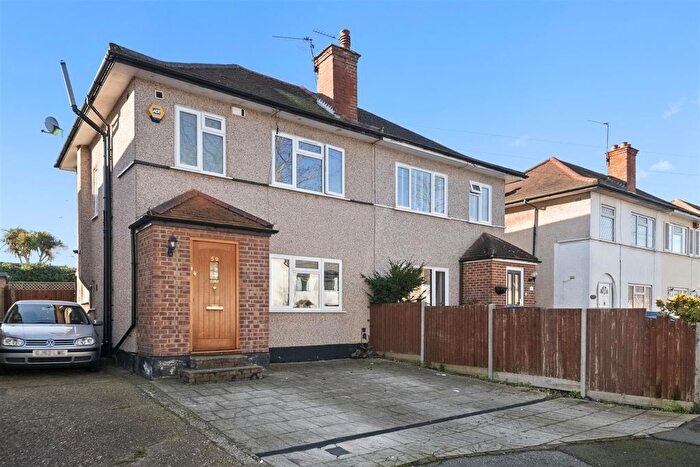
Properties for sale in Hayes
Neighbourhoods in Hayes
Navigate through our locations to find the location of your next house in Hayes, Hillingdon London Borough for sale or to rent.
Transport in Hayes
Please see below transportation links in this area:
- FAQ
- Price Paid By Year
- Property Type Price
Frequently asked questions about Hayes
What is the average price for a property for sale in Hayes?
The average price for a property for sale in Hayes is £424,994. This amount is 17% lower than the average price in Hillingdon London Borough. There are more than 10,000 property listings for sale in Hayes.
What locations have the most expensive properties for sale in Hayes?
The locations with the most expensive properties for sale in Hayes are Pinkwell at an average of £466,710, Charville at an average of £460,048 and Barnhill at an average of £433,999.
What locations have the most affordable properties for sale in Hayes?
The locations with the most affordable properties for sale in Hayes are Heathrow Villages at an average of £328,001, Yeading at an average of £411,456 and Botwell at an average of £412,881.
Which train stations are available in or near Hayes?
Some of the train stations available in or near Hayes are Hayes and Harlington, Southall and West Drayton.
Property Price Paid in Hayes by Year
The average sold property price by year was:
| Year | Average Sold Price | Price Change |
Sold Properties
|
|---|---|---|---|
| 2025 | £438,297 | 2% |
504 Properties |
| 2024 | £430,546 | 5% |
655 Properties |
| 2023 | £407,226 | -1% |
582 Properties |
| 2022 | £412,911 | 4% |
703 Properties |
| 2021 | £395,286 | 4% |
909 Properties |
| 2020 | £377,708 | 5% |
587 Properties |
| 2019 | £358,103 | 2% |
686 Properties |
| 2018 | £352,687 | -1% |
804 Properties |
| 2017 | £356,667 | 12% |
768 Properties |
| 2016 | £312,421 | 7% |
954 Properties |
| 2015 | £290,724 | 12% |
849 Properties |
| 2014 | £254,509 | 10% |
878 Properties |
| 2013 | £229,346 | 3% |
804 Properties |
| 2012 | £222,102 | 3% |
887 Properties |
| 2011 | £214,473 | -2% |
843 Properties |
| 2010 | £218,695 | 6% |
674 Properties |
| 2009 | £205,888 | -9% |
559 Properties |
| 2008 | £223,955 | 2% |
823 Properties |
| 2007 | £220,025 | 9% |
1,588 Properties |
| 2006 | £200,188 | 2% |
1,591 Properties |
| 2005 | £195,257 | 2% |
1,308 Properties |
| 2004 | £191,661 | 7% |
1,504 Properties |
| 2003 | £177,484 | 16% |
1,664 Properties |
| 2002 | £149,962 | 17% |
1,693 Properties |
| 2001 | £124,274 | 13% |
1,415 Properties |
| 2000 | £107,608 | 13% |
1,436 Properties |
| 1999 | £93,114 | 15% |
1,771 Properties |
| 1998 | £78,901 | 13% |
1,540 Properties |
| 1997 | £68,730 | 10% |
1,426 Properties |
| 1996 | £61,682 | -0,2% |
1,344 Properties |
| 1995 | £61,828 | - |
970 Properties |
Property Price per Property Type in Hayes
Here you can find historic sold price data in order to help with your property search.
The average Property Paid Price for specific property types in the last three years are:
| Property Type | Average Sold Price | Sold Properties |
|---|---|---|
| Semi Detached House | £508,289.00 | 746 Semi Detached Houses |
| Terraced House | £449,831.00 | 474 Terraced Houses |
| Detached House | £655,794.00 | 47 Detached Houses |
| Flat | £246,178.00 | 474 Flats |

