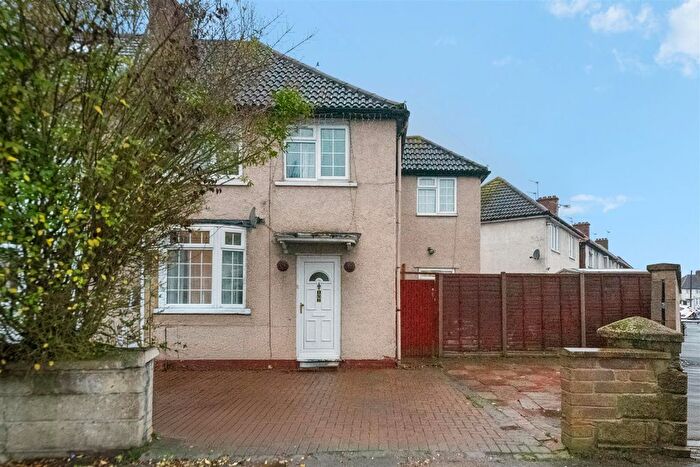
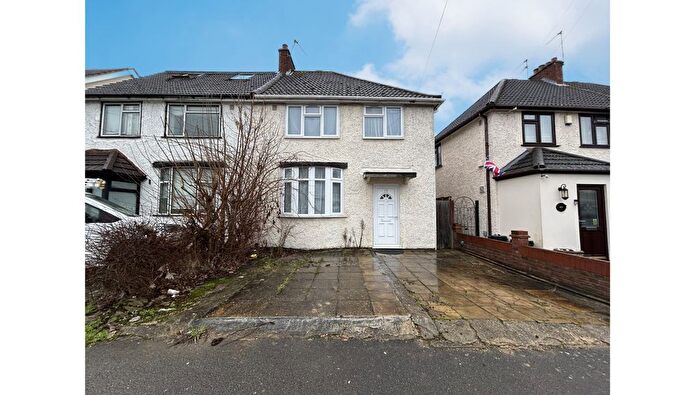
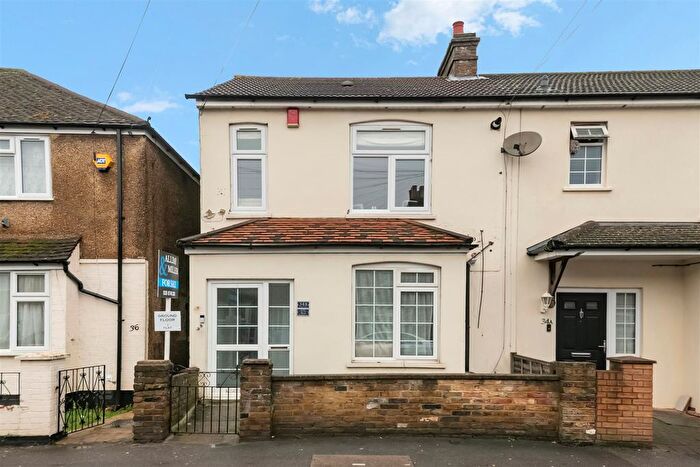
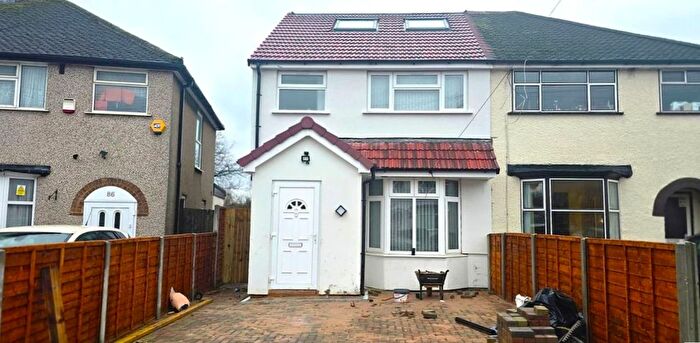
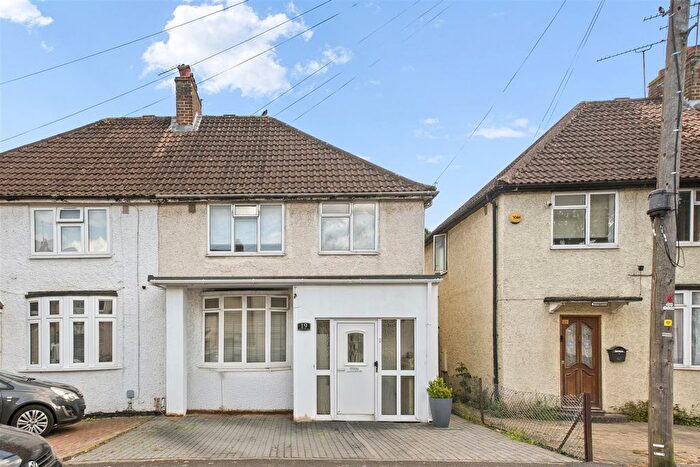
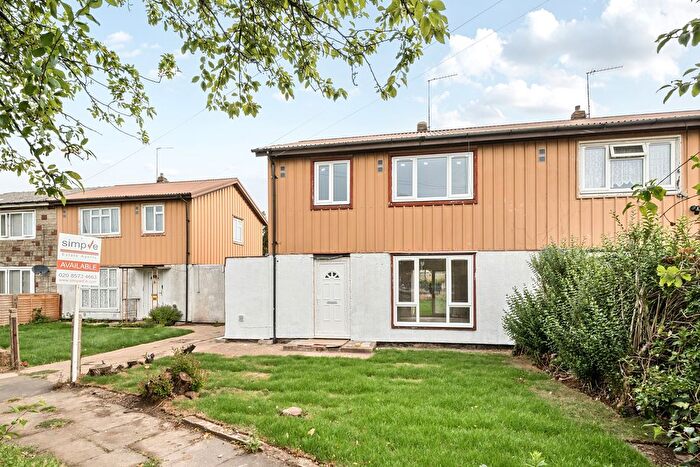
Houses for sale & to rent in Botwell, Uxbridge
House Prices in Botwell
Properties in this part of Botwell within Uxbridge have an average house price of £472,950.00 and had 31 Property Transactions within the last 3 years¹. This area has 451 households² , where the most expensive property was sold for £660,000.00.
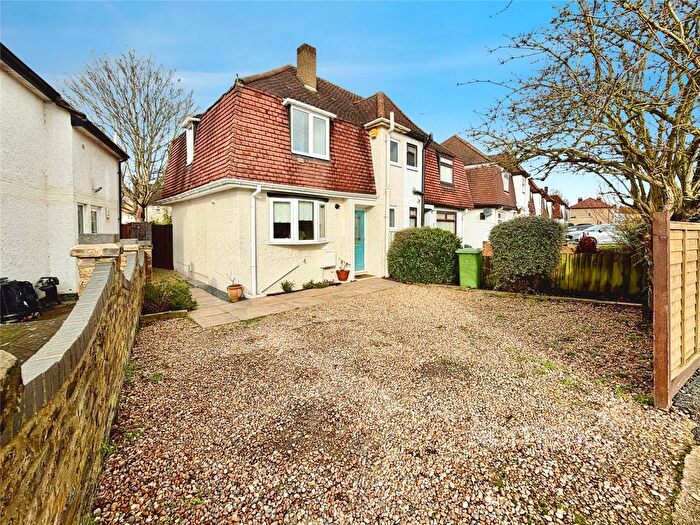
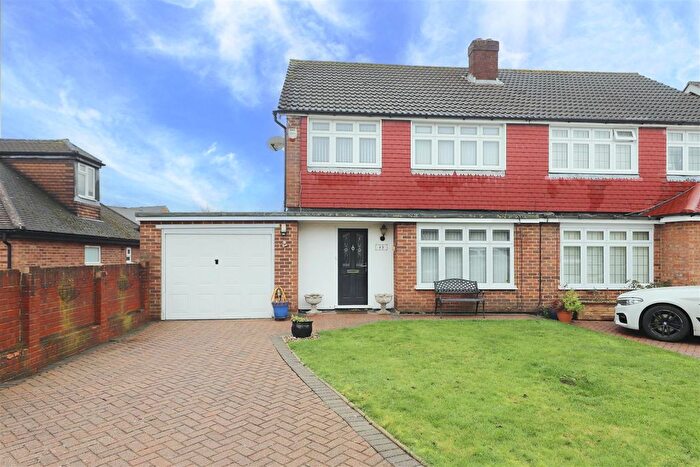
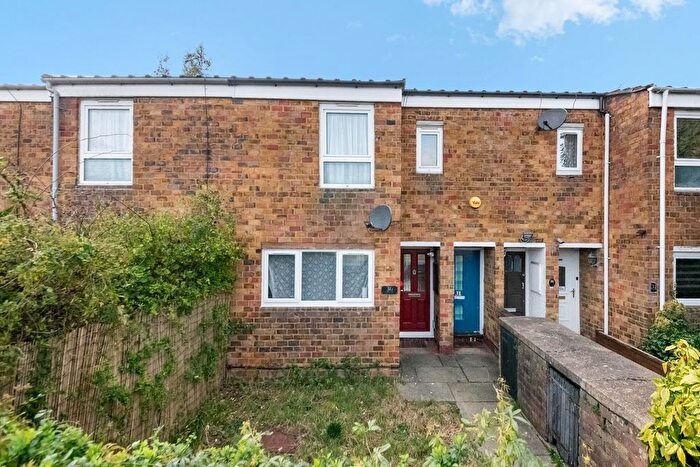
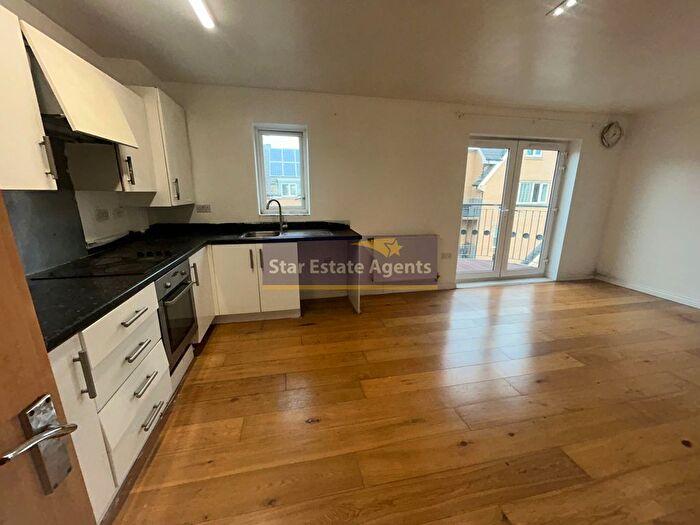
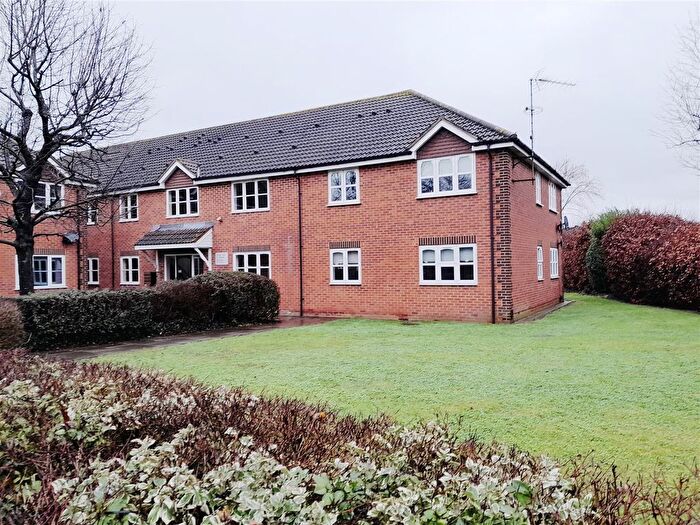
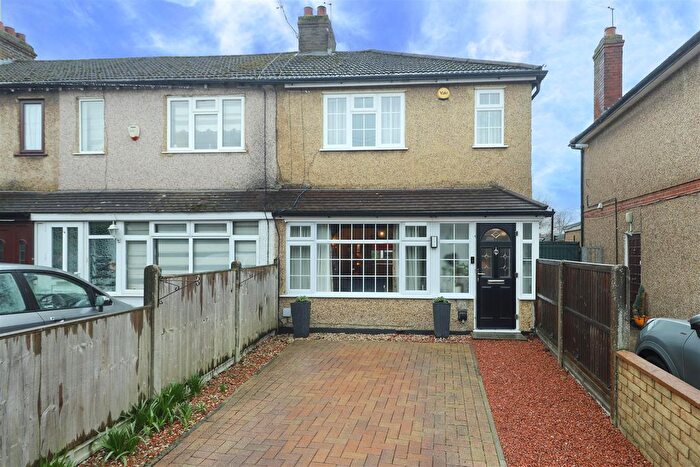
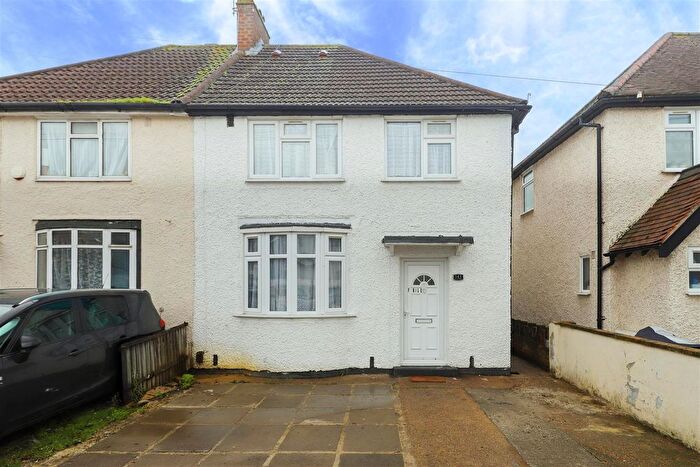
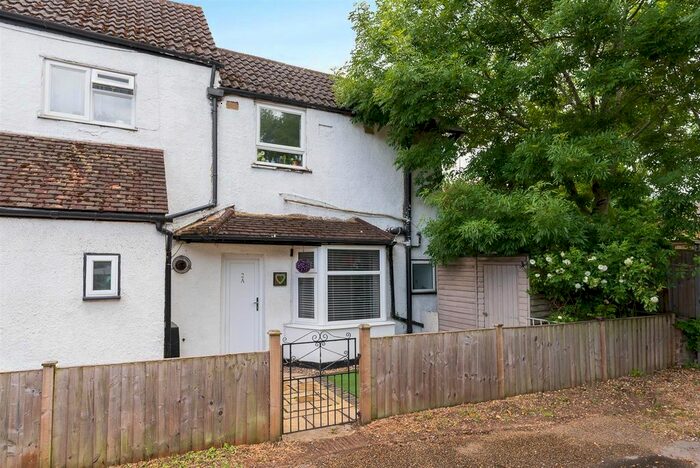
Properties for sale in Botwell
Previously listed properties in Botwell
Roads and Postcodes in Botwell
Navigate through our locations to find the location of your next house in Botwell, Uxbridge for sale or to rent.
| Streets | Postcodes |
|---|---|
| Appleby Close | UB8 3FE |
| Chester Close | UB8 3DB |
| Corwell Gardens | UB8 3JS UB8 3JT |
| Corwell Lane | UB8 3DD UB8 3DE UB8 3FB |
| Cromer Close | UB8 3DA |
| Dawley Avenue | UB8 3BS UB8 3BT UB8 3BU UB8 3BX |
| Furzeground Way | UB11 1BB UB11 1EZ UB11 1FJ UB11 1HU |
| Hardinge Close | UB8 3BZ |
| Harlington Road | UB8 3JD UB8 3JE UB8 3JG UB8 3JF |
| Judge Heath Lane | UB8 3JU |
| Lansdowne Road | UB8 3JP UB8 3JR |
| Longwalk Road | UB11 1AW UB11 1BA UB11 1DB UB11 1FE |
| Lonsdale Close | UB8 3BY |
| Purkis Close | UB8 3QJ |
| Roundwood Avenue | UB11 1AF UB11 1AS UB11 1JA |
| Roundwood Avenue Stockley Park | UB11 1FG |
| Stockley Park | UB11 1AA UB11 1AQ UB11 1BD |
| The Square | UB11 1ET UB11 1FW UB11 1TD |
| Titmus Close | UB8 3DF |
| Trinity Drive | UB8 3DT |
| West Drayton Road | UB8 3LA UB8 3LD UB8 3LE |
Transport near Botwell
-
West Drayton Station
-
Hayes and Harlington Station
-
Uxbridge Station
-
Hillingdon Station
-
Iver Station
-
Southall Station
- FAQ
- Price Paid By Year
- Property Type Price
Frequently asked questions about Botwell
What is the average price for a property for sale in Botwell?
The average price for a property for sale in Botwell is £472,950. This amount is 7% lower than the average price in Uxbridge. There are 919 property listings for sale in Botwell.
What streets have the most expensive properties for sale in Botwell?
The streets with the most expensive properties for sale in Botwell are Cromer Close at an average of £510,000, Corwell Lane at an average of £497,666 and West Drayton Road at an average of £473,883.
What streets have the most affordable properties for sale in Botwell?
The streets with the most affordable properties for sale in Botwell are Appleby Close at an average of £268,000, Corwell Gardens at an average of £357,500 and Lonsdale Close at an average of £465,625.
Which train stations are available in or near Botwell?
Some of the train stations available in or near Botwell are West Drayton, Hayes and Harlington and Iver.
Which tube stations are available in or near Botwell?
Some of the tube stations available in or near Botwell are Uxbridge and Hillingdon.
Property Price Paid in Botwell by Year
The average sold property price by year was:
| Year | Average Sold Price | Price Change |
Sold Properties
|
|---|---|---|---|
| 2025 | £487,083 | 12% |
6 Properties |
| 2024 | £427,912 | -19% |
12 Properties |
| 2023 | £508,000 | 18% |
13 Properties |
| 2022 | £414,041 | -5% |
24 Properties |
| 2021 | £433,660 | -1% |
21 Properties |
| 2020 | £438,777 | 7% |
18 Properties |
| 2019 | £406,633 | 10% |
15 Properties |
| 2018 | £367,250 | -2% |
11 Properties |
| 2017 | £373,270 | 8% |
25 Properties |
| 2016 | £342,535 | -10% |
21 Properties |
| 2015 | £375,973 | 5% |
19 Properties |
| 2014 | £355,457 | 32% |
14 Properties |
| 2013 | £242,835 | -11% |
14 Properties |
| 2012 | £270,245 | -1% |
12 Properties |
| 2011 | £271,657 | 15% |
19 Properties |
| 2010 | £230,600 | 7% |
10 Properties |
| 2009 | £213,829 | -7% |
24 Properties |
| 2008 | £228,975 | -25% |
18 Properties |
| 2007 | £286,106 | 16% |
39 Properties |
| 2006 | £240,588 | 8% |
31 Properties |
| 2005 | £221,860 | 3% |
19 Properties |
| 2004 | £215,697 | 5% |
22 Properties |
| 2003 | £204,780 | -3% |
30 Properties |
| 2002 | £211,482 | 29% |
38 Properties |
| 2001 | £149,376 | 14% |
21 Properties |
| 2000 | £127,905 | 15% |
17 Properties |
| 1999 | £108,615 | 9% |
13 Properties |
| 1998 | £98,309 | 9% |
27 Properties |
| 1997 | £89,583 | 17% |
19 Properties |
| 1996 | £73,961 | -2% |
21 Properties |
| 1995 | £75,750 | - |
17 Properties |
Property Price per Property Type in Botwell
Here you can find historic sold price data in order to help with your property search.
The average Property Paid Price for specific property types in the last three years are:
| Property Type | Average Sold Price | Sold Properties |
|---|---|---|
| Semi Detached House | £506,441.00 | 18 Semi Detached Houses |
| Detached House | £540,000.00 | 3 Detached Houses |
| Terraced House | £457,500.00 | 6 Terraced Houses |
| Flat | £295,125.00 | 4 Flats |

