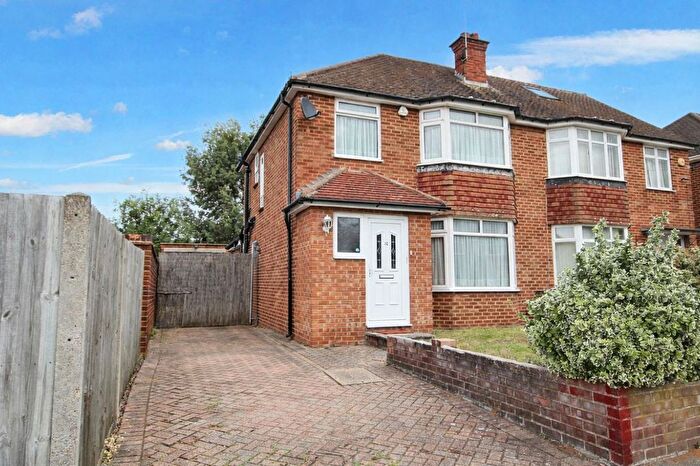
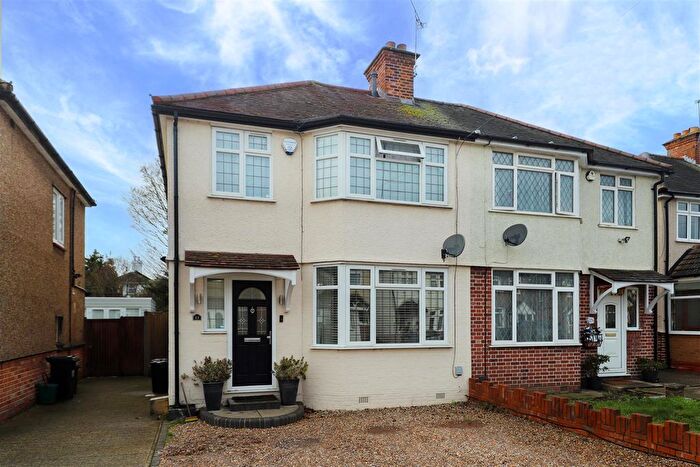
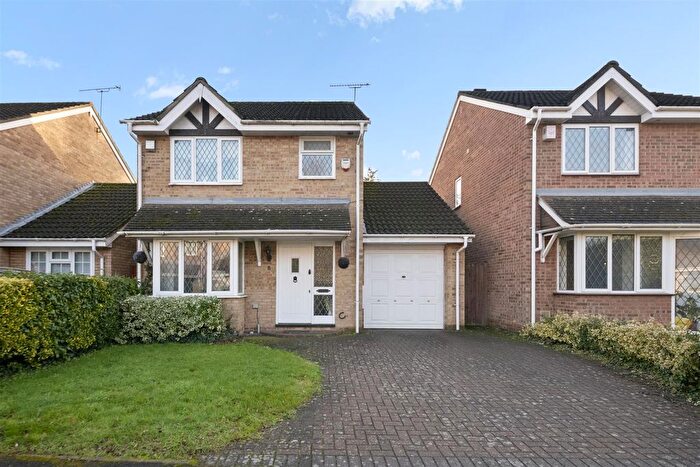
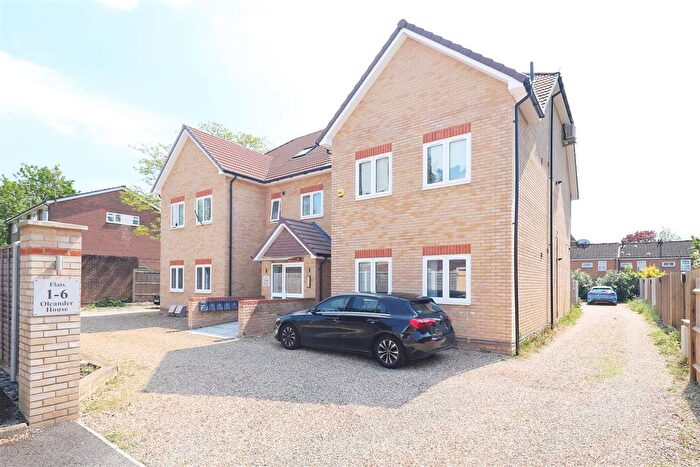
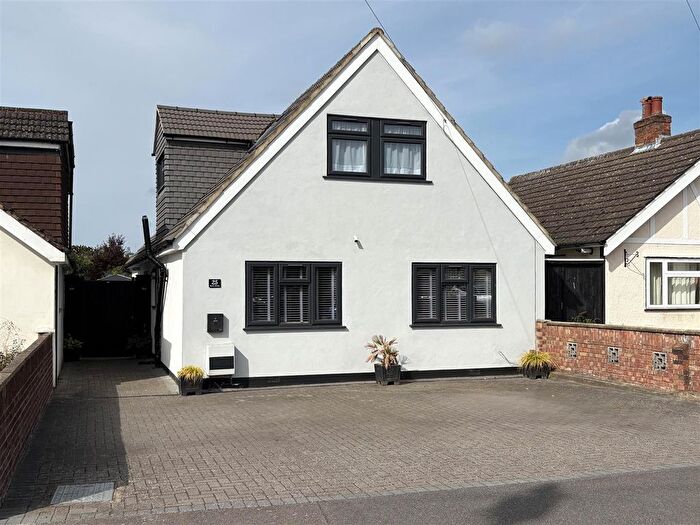
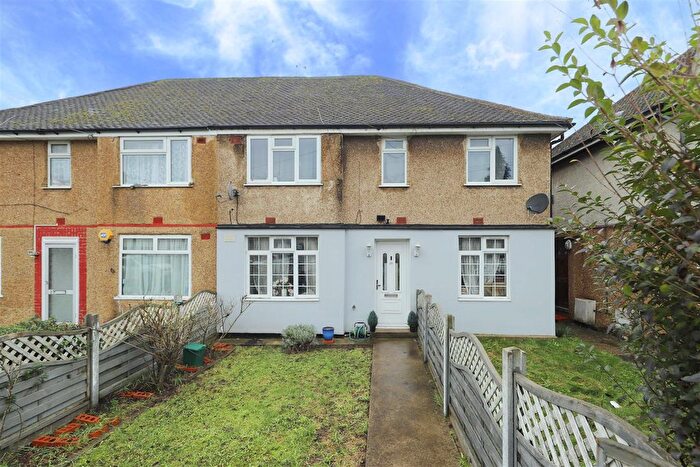
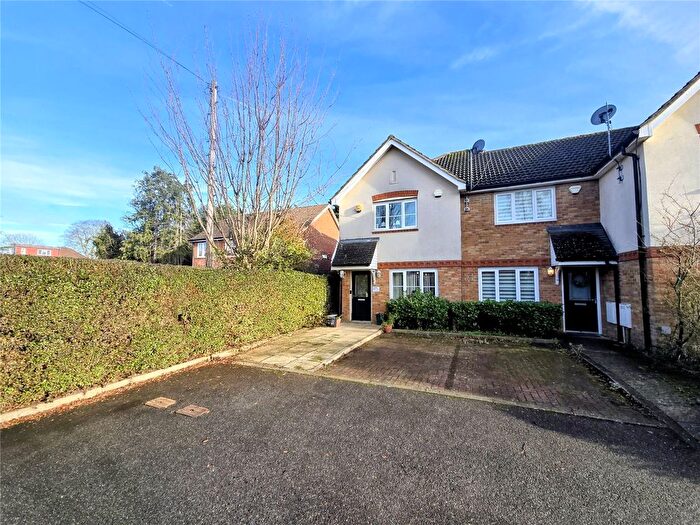
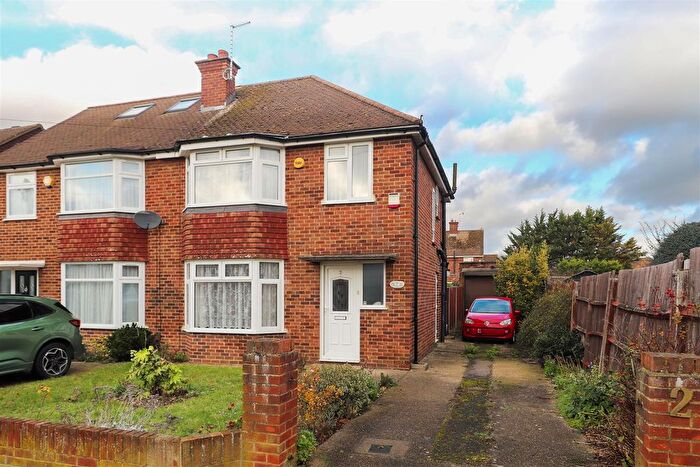
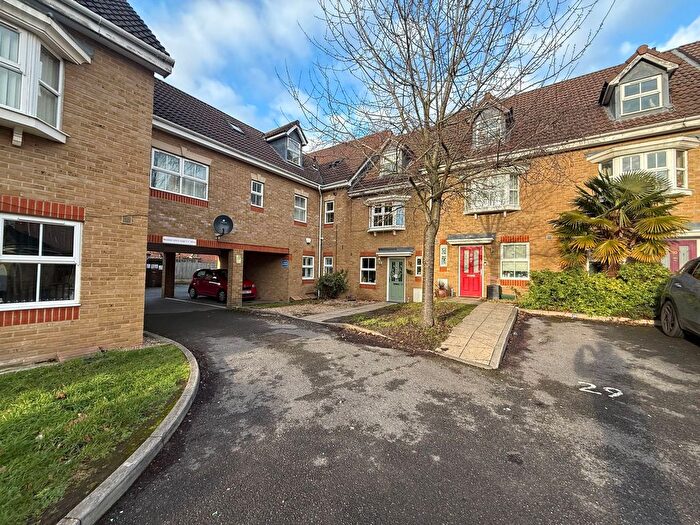
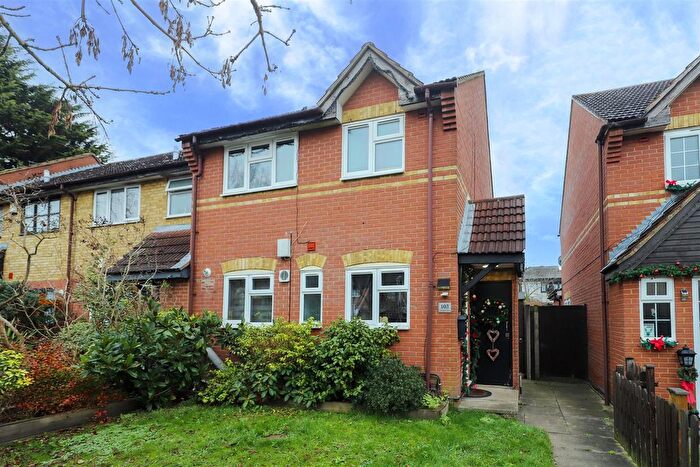
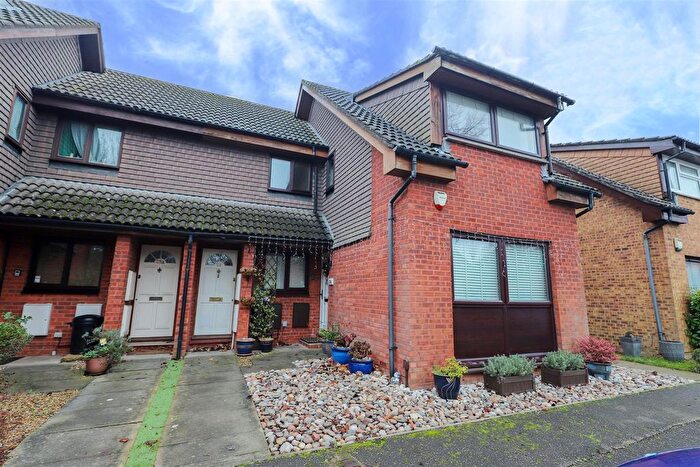
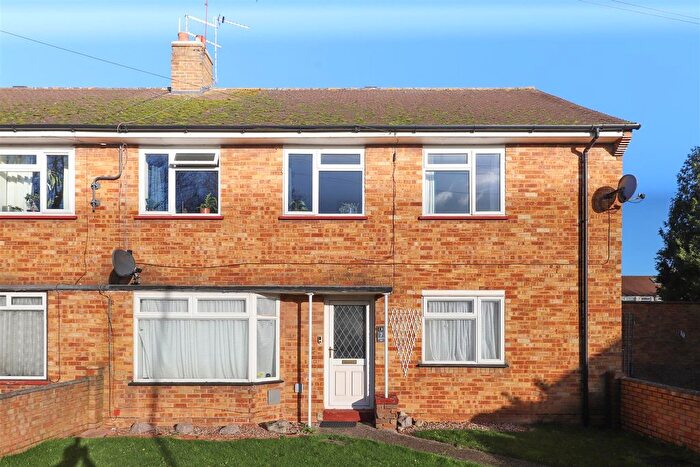
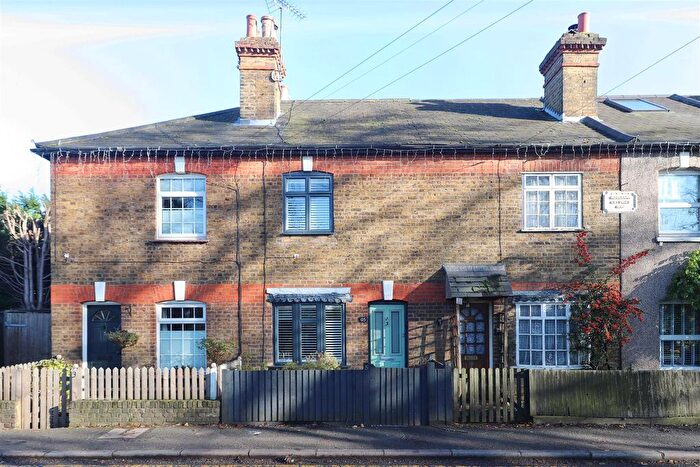
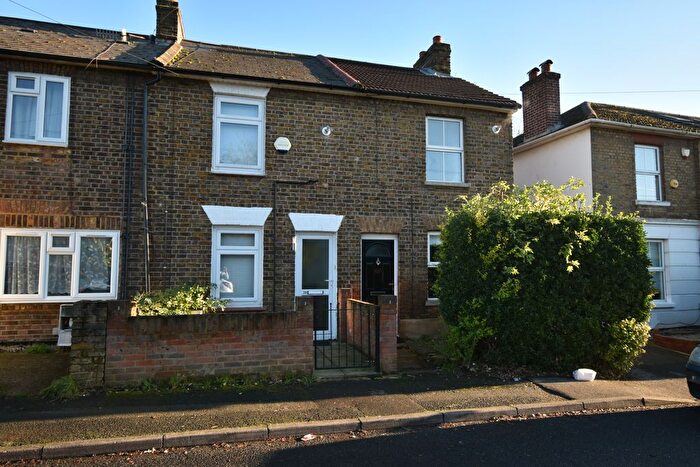
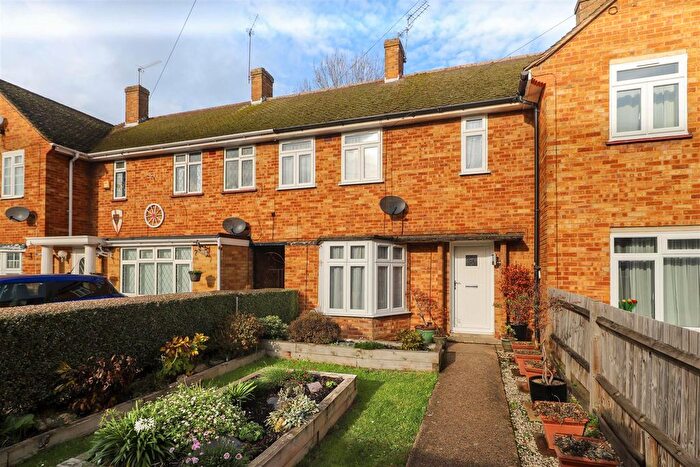
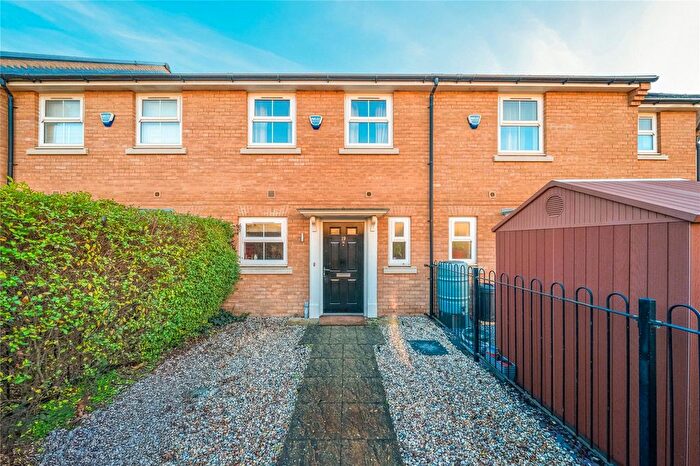
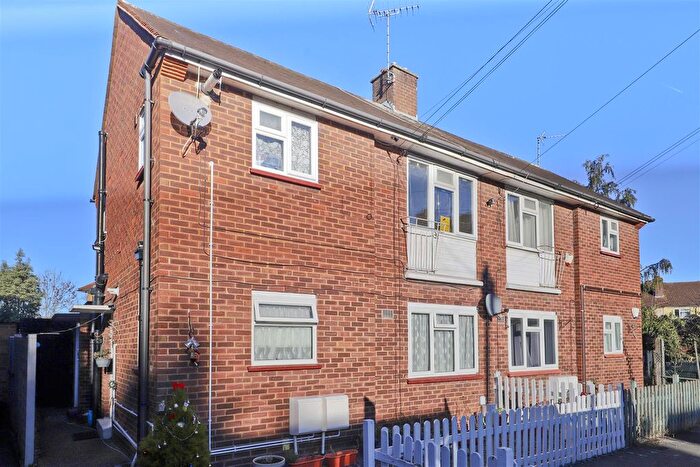
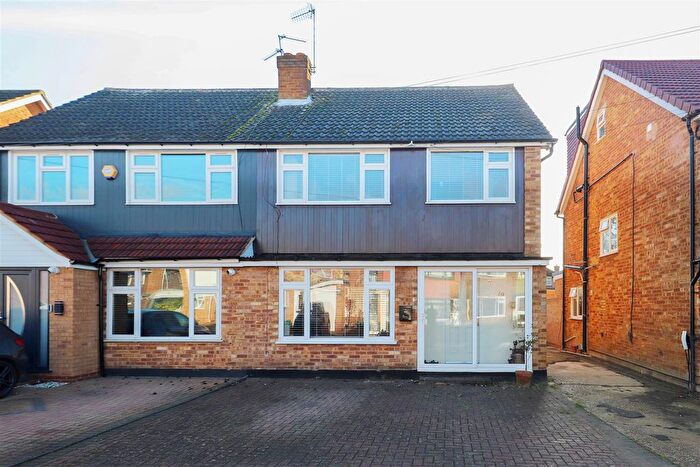
Houses for sale & to rent in Yiewsley, Uxbridge
House Prices in Yiewsley
Properties in this part of Yiewsley within Uxbridge have an average house price of £405,329.00 and had 140 Property Transactions within the last 3 years¹. This area has 1,373 households² , where the most expensive property was sold for £750,000.00.
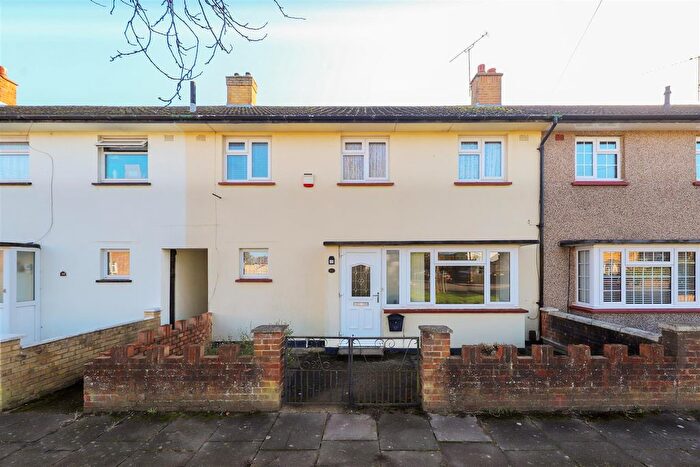
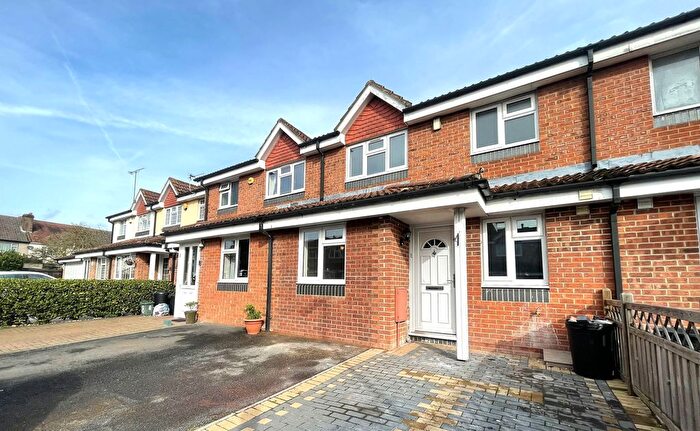
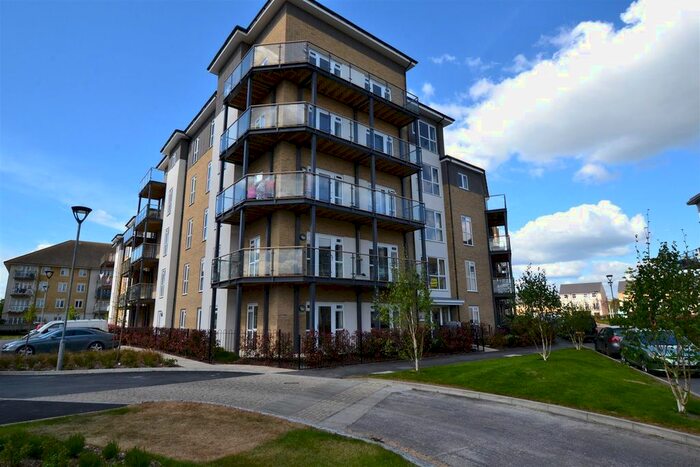
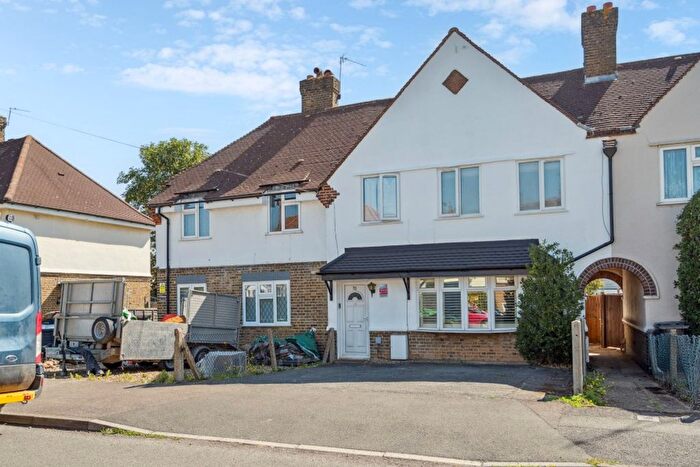
Properties for sale in Yiewsley
Previously listed properties in Yiewsley
Roads and Postcodes in Yiewsley
Navigate through our locations to find the location of your next house in Yiewsley, Uxbridge for sale or to rent.
| Streets | Postcodes |
|---|---|
| Packet Boat Lane | UB8 2JJ UB8 2JS |
| Aintree Close | UB8 3HS |
| Appletree Avenue | UB8 3PU UB8 3PX |
| Ashwood Avenue | UB8 3LS UB8 3LT |
| Beechwood Avenue | UB8 3LU UB8 3LX |
| Bramble Close | UB8 3QE UB8 3BF |
| Bryony Close | UB8 3RB |
| Campion Close | UB8 3PY |
| Chapel Lane | UB8 3DS UB8 3DR |
| Clarkes Drive | UB8 3UH UB8 3UJ UB8 3UL UB8 3UN |
| Clayfield Way | UB11 1FH |
| Colham Green Road | UB8 3QH UB8 3JY |
| Craig Drive | UB8 3HJ UB8 3HL |
| Daleham Drive | UB8 3HP UB8 3HW |
| Dickens Avenue | UB8 3BW UB8 3DH UB8 3DL UB8 3DN |
| Elmcroft Terrace | UB8 3QF |
| Evelyns Close | UB8 3LR |
| Farrier Close | UB8 3FH UB8 3XG |
| Gilfrid Close | UB8 3HN |
| Goulds Green | UB8 3DG UB8 3TP UB8 3DQ |
| Harlington Road | UB8 3HD UB8 3HF UB8 3HG UB8 3HE |
| Heather Close | UB8 3QD |
| Horseshoe Drive | UB8 3XF |
| Hubbards Close | UB8 3HB |
| Iron Bridge Road | UB11 1FP UB11 1BT UB11 1BU |
| Ironbridge Road | UB11 1BF |
| Lavender Road | UB8 3PZ |
| Moorcroft Lane | UB8 3QL |
| Myrtle Close | UB8 3QB |
| Nickleby Close | UB8 3DU |
| Old Orchard Close | UB8 3LH |
| Park View Road | UB8 3LJ UB8 3LL UB8 3GA UB8 3LN |
| Peggotty Way | UB8 3DP |
| Perry Close | UB8 3HR UB8 3RE |
| Pinewood Avenue | UB8 3LP UB8 3LW |
| Rosemary Close | UB8 3QA |
| Royal Lane | UB8 3QX UB8 3QY UB8 3QZ |
| Stockley Road | UB8 3FJ |
| Thackeray Close | UB8 3DW |
| Violet Avenue | UB8 3PP UB8 3PR UB8 3PS UB8 3PT |
| Violet Terrace | UB8 3QG |
| West Drayton Road | UB8 3LG UB8 3JZ |
Transport near Yiewsley
-
West Drayton Station
-
Hayes and Harlington Station
-
Uxbridge Station
-
Hillingdon Station
-
Iver Station
-
Ickenham Station
- FAQ
- Price Paid By Year
- Property Type Price
Frequently asked questions about Yiewsley
What is the average price for a property for sale in Yiewsley?
The average price for a property for sale in Yiewsley is £405,329. This amount is 21% lower than the average price in Uxbridge. There are 822 property listings for sale in Yiewsley.
What streets have the most expensive properties for sale in Yiewsley?
The streets with the most expensive properties for sale in Yiewsley are Old Orchard Close at an average of £750,000, West Drayton Road at an average of £525,000 and Evelyns Close at an average of £516,000.
What streets have the most affordable properties for sale in Yiewsley?
The streets with the most affordable properties for sale in Yiewsley are Clarkes Drive at an average of £203,440, Pinewood Avenue at an average of £260,611 and Heather Close at an average of £325,000.
Which train stations are available in or near Yiewsley?
Some of the train stations available in or near Yiewsley are West Drayton, Hayes and Harlington and Iver.
Which tube stations are available in or near Yiewsley?
Some of the tube stations available in or near Yiewsley are Uxbridge, Hillingdon and Ickenham.
Property Price Paid in Yiewsley by Year
The average sold property price by year was:
| Year | Average Sold Price | Price Change |
Sold Properties
|
|---|---|---|---|
| 2025 | £438,261 | 10% |
21 Properties |
| 2024 | £396,310 | 6% |
40 Properties |
| 2023 | £371,662 | -13% |
32 Properties |
| 2022 | £421,212 | 13% |
47 Properties |
| 2021 | £368,274 | -3% |
63 Properties |
| 2020 | £379,955 | 4% |
40 Properties |
| 2019 | £365,436 | 2% |
55 Properties |
| 2018 | £359,075 | -2% |
40 Properties |
| 2017 | £367,406 | 16% |
38 Properties |
| 2016 | £310,452 | -2% |
46 Properties |
| 2015 | £317,148 | 23% |
46 Properties |
| 2014 | £243,225 | 5% |
42 Properties |
| 2013 | £230,417 | -2% |
44 Properties |
| 2012 | £235,940 | -0,1% |
35 Properties |
| 2011 | £236,211 | 8% |
44 Properties |
| 2010 | £216,167 | 2% |
50 Properties |
| 2009 | £211,114 | -7% |
48 Properties |
| 2008 | £226,108 | -0,1% |
31 Properties |
| 2007 | £226,347 | 12% |
91 Properties |
| 2006 | £198,134 | 4% |
83 Properties |
| 2005 | £189,816 | 2% |
76 Properties |
| 2004 | £185,275 | 8% |
74 Properties |
| 2003 | £169,837 | 14% |
81 Properties |
| 2002 | £146,503 | 8% |
87 Properties |
| 2001 | £135,050 | 20% |
96 Properties |
| 2000 | £108,003 | 17% |
80 Properties |
| 1999 | £89,289 | 20% |
70 Properties |
| 1998 | £71,265 | 10% |
66 Properties |
| 1997 | £64,195 | 7% |
61 Properties |
| 1996 | £59,596 | -3% |
68 Properties |
| 1995 | £61,479 | - |
42 Properties |
Property Price per Property Type in Yiewsley
Here you can find historic sold price data in order to help with your property search.
The average Property Paid Price for specific property types in the last three years are:
| Property Type | Average Sold Price | Sold Properties |
|---|---|---|
| Semi Detached House | £493,742.00 | 66 Semi Detached Houses |
| Terraced House | £457,400.00 | 25 Terraced Houses |
| Flat | £252,845.00 | 48 Flats |
| Detached House | £587,500.00 | 1 Detached House |

