
Houses for sale & to rent in UB10 0LA, Chetwynd Drive, Uxbridge North, Uxbridge
House Prices in UB10 0LA, Chetwynd Drive, Uxbridge North
Properties in UB10 0LA have no sales history available within the last 3 years. UB10 0LA is a postcode in Chetwynd Drive located in Uxbridge North, an area in Uxbridge, Hillingdon London Borough, with 11 households².
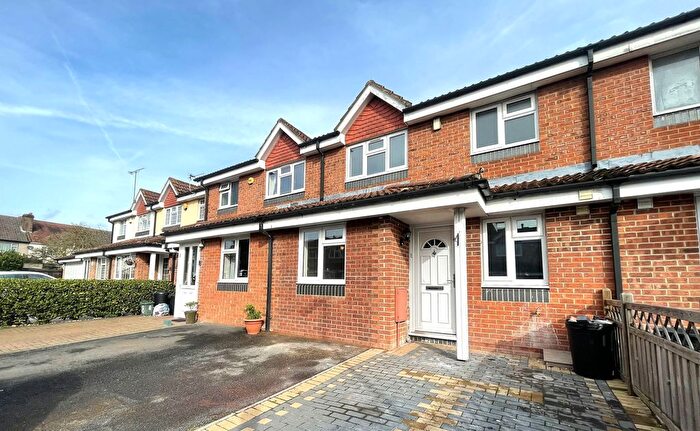
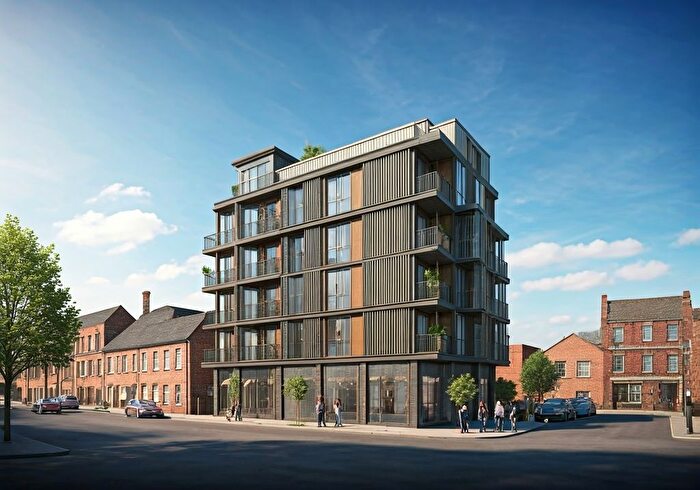
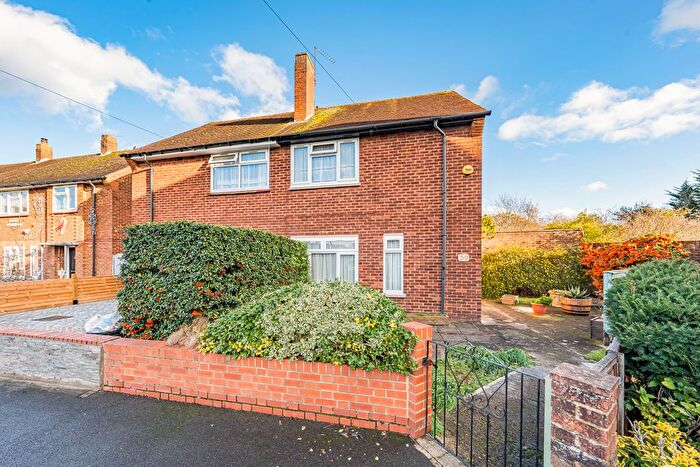
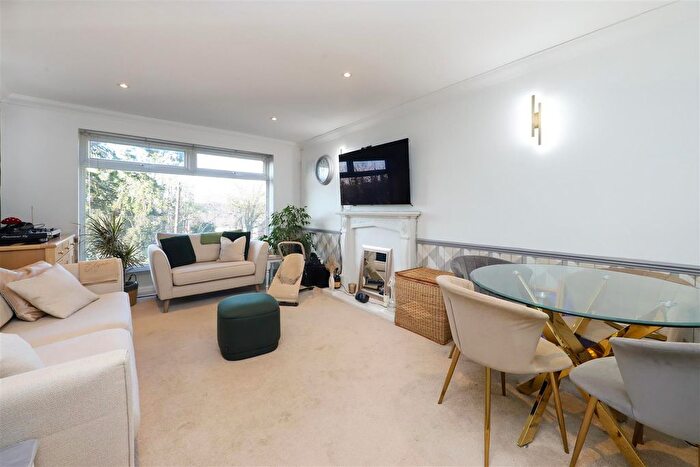
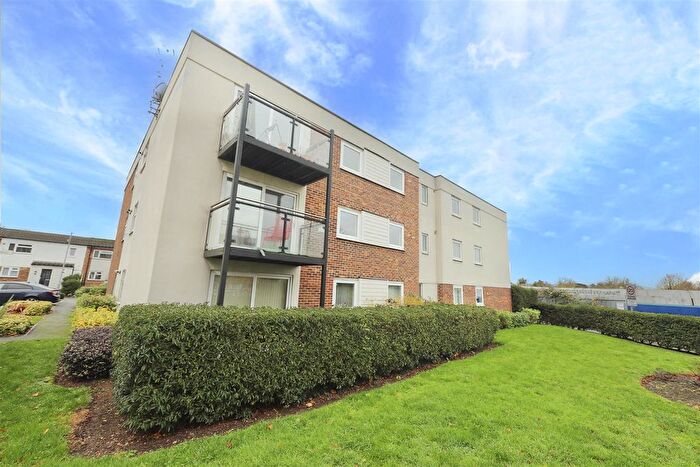
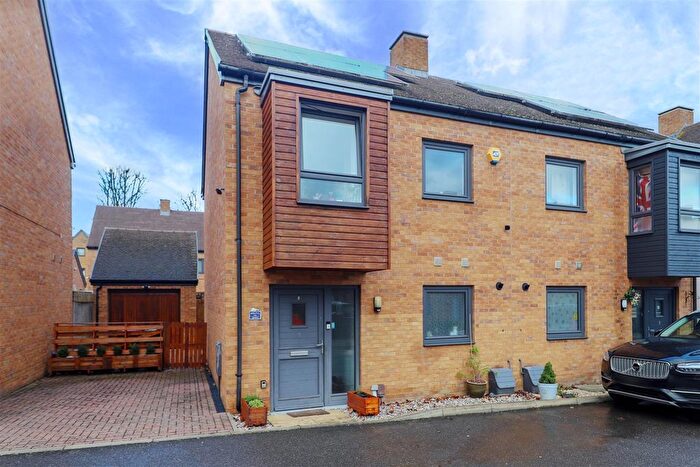
Properties for sale near UB10 0LA, Chetwynd Drive
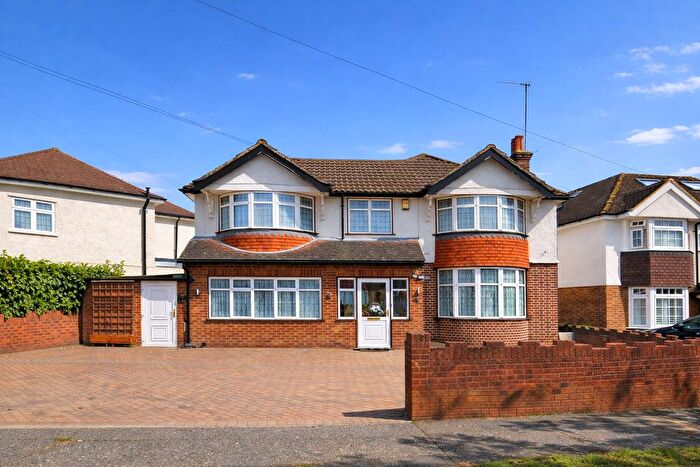
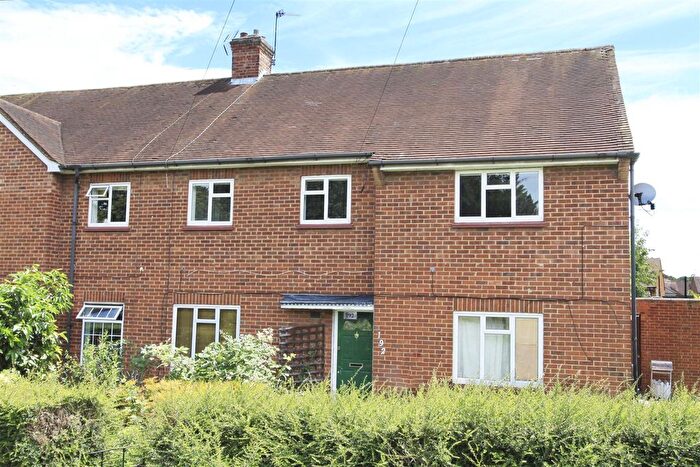
![]()
If you are looking to sell your house, let it out, or receive a property valuation, an expert can help you.
Click the button below to get started.
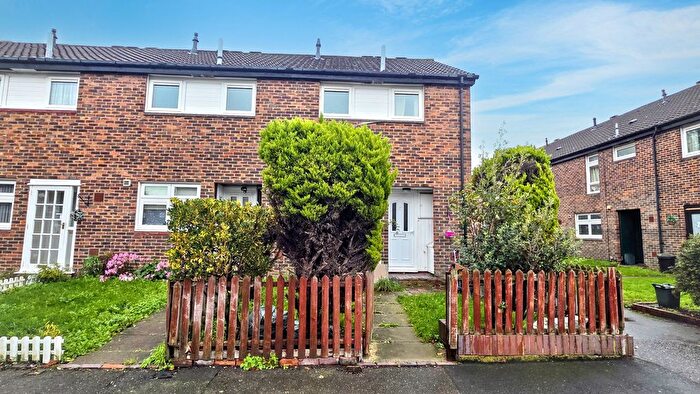
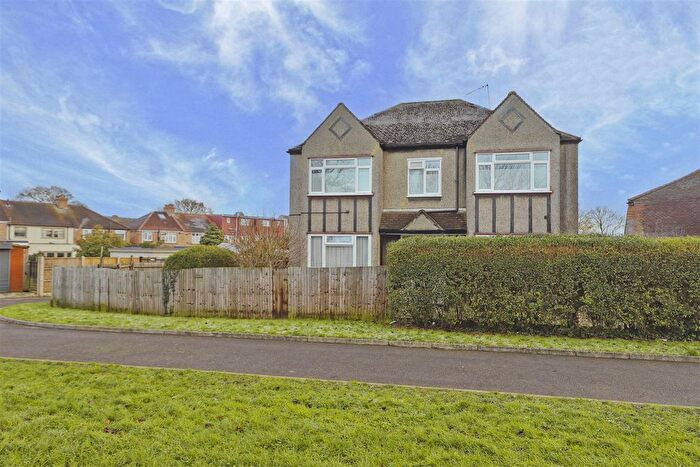
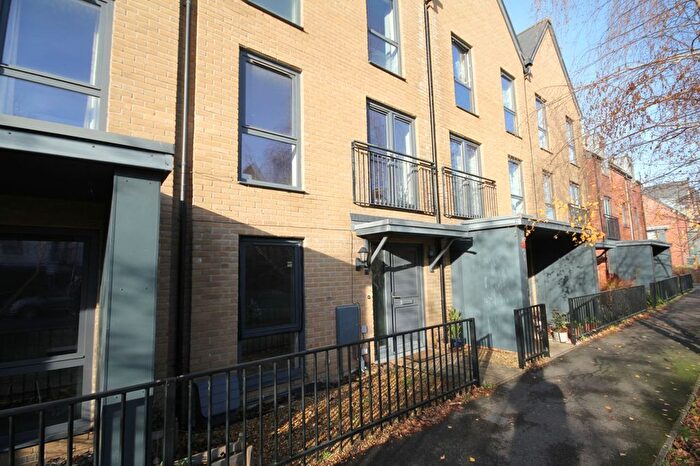
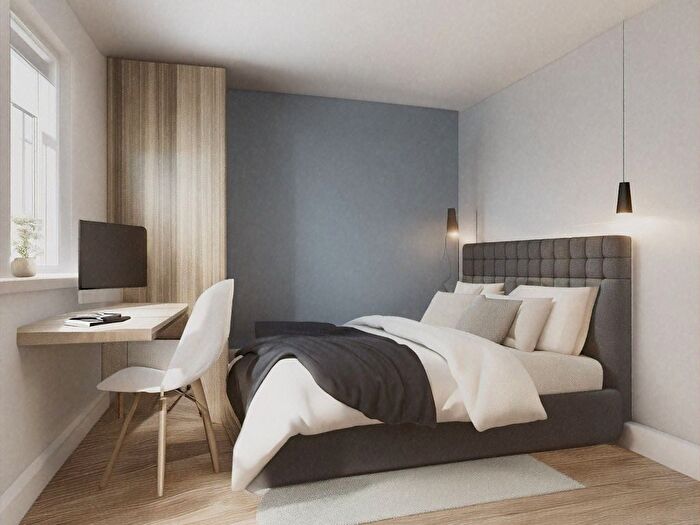
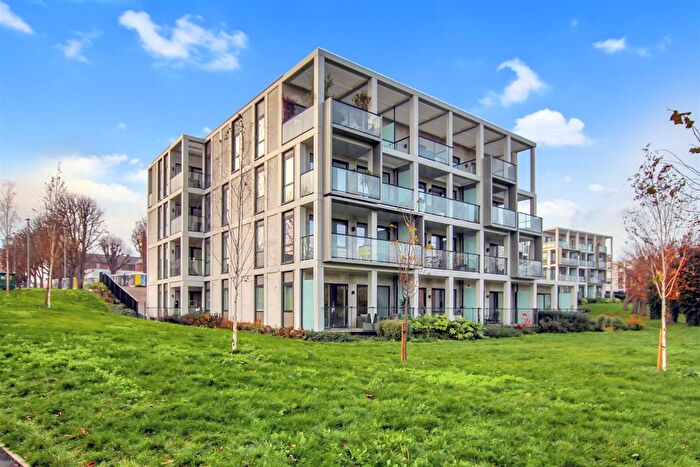
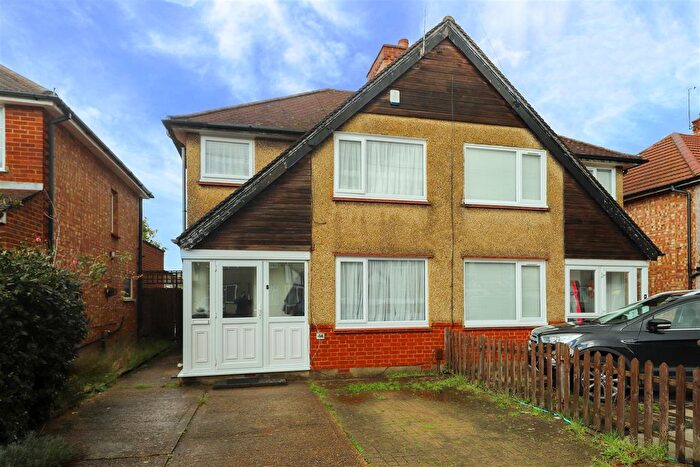
Previously listed properties near UB10 0LA, Chetwynd Drive
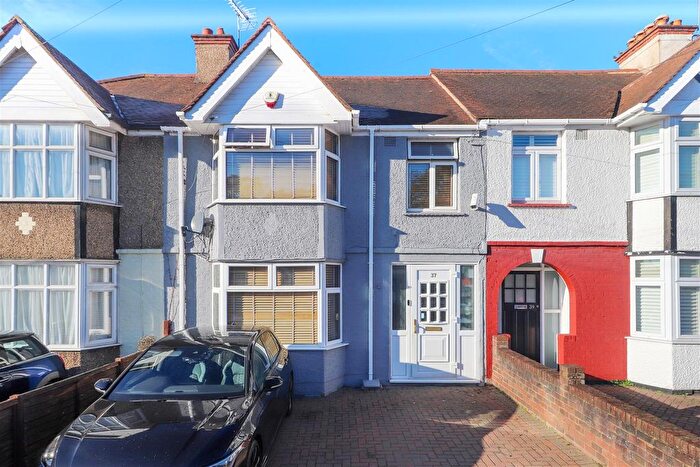
![]()
If you are looking to sell your house, let it out, or receive a property valuation, an expert can help you.
Click the button below to get started.

Price Paid in Chetwynd Drive, UB10 0LA, Uxbridge North
13 Chetwynd Drive, UB10 0LA, Uxbridge North Uxbridge
Property 13 has been sold 1 time. The last time it was sold was in 28/07/2017 and the sold price was £750,000.00.
This semi detached house, sold as a freehold on 28/07/2017, is a 129 sqm detached house with an EPC rating of D.
| Date | Price | Property Type | Tenure | Classification |
|---|---|---|---|---|
| 28/07/2017 | £750,000.00 | Semi Detached House | freehold | Established Building |
7 Chetwynd Drive, UB10 0LA, Uxbridge North Uxbridge
Property 7 has been sold 1 time. The last time it was sold was in 19/12/2014 and the sold price was £585,000.00.
This detached house, sold as a freehold on 19/12/2014, is a 110 sqm detached house with an EPC rating of E.
| Date | Price | Property Type | Tenure | Classification |
|---|---|---|---|---|
| 19/12/2014 | £585,000.00 | Detached House | freehold | Established Building |
5 Chetwynd Drive, UB10 0LA, Uxbridge North Uxbridge
Property 5 has been sold 2 times. The last time it was sold was in 14/10/2011 and the sold price was £525,000.00.
This detached house, sold as a freehold on 14/10/2011, is a 141 sqm detached house with an EPC rating of D.
| Date | Price | Property Type | Tenure | Classification |
|---|---|---|---|---|
| 14/10/2011 | £525,000.00 | Detached House | freehold | Established Building |
| 21/02/2007 | £465,000.00 | Detached House | freehold | Established Building |
14 Chetwynd Drive, UB10 0LA, Uxbridge North Uxbridge
Property 14 has been sold 1 time. The last time it was sold was in 03/07/2007 and the sold price was £520,000.00.
This is a Detached House which was sold as a freehold in 03/07/2007
| Date | Price | Property Type | Tenure | Classification |
|---|---|---|---|---|
| 03/07/2007 | £520,000.00 | Detached House | freehold | Established Building |
12 Chetwynd Drive, UB10 0LA, Uxbridge North Uxbridge
Property 12 has been sold 2 times. The last time it was sold was in 26/06/2002 and the sold price was £385,000.00.
This is a Detached House which was sold as a freehold in 26/06/2002
| Date | Price | Property Type | Tenure | Classification |
|---|---|---|---|---|
| 26/06/2002 | £385,000.00 | Detached House | freehold | Established Building |
| 15/12/1999 | £295,000.00 | Detached House | freehold | Established Building |
10 Chetwynd Drive, UB10 0LA, Uxbridge North Uxbridge
Property 10 has been sold 1 time. The last time it was sold was in 20/04/2001 and the sold price was £312,500.00.
This detached house, sold as a freehold on 20/04/2001, is a 160 sqm detached house with an EPC rating of E.
| Date | Price | Property Type | Tenure | Classification |
|---|---|---|---|---|
| 20/04/2001 | £312,500.00 | Detached House | freehold | Established Building |
11 Chetwynd Drive, UB10 0LA, Uxbridge North Uxbridge
Property 11 has been sold 1 time. The last time it was sold was in 07/11/1995 and the sold price was £166,400.00.
This is a Detached House which was sold as a freehold in 07/11/1995
| Date | Price | Property Type | Tenure | Classification |
|---|---|---|---|---|
| 07/11/1995 | £166,400.00 | Detached House | freehold | Established Building |
Transport near UB10 0LA, Chetwynd Drive
-
 Uxbridge Station
 -
Hillingdon Station
-
Ickenham Station
-

 West Drayton Station
 -
West Ruislip Station
-
Ruislip Gardens Station
-
Iver Station
-
Hayes and Harlington Station
-
South Ruislip Station
-
Ruislip Station
House price paid reports for UB10 0LA, Chetwynd Drive
Click on the buttons below to see price paid reports by year or property price:
- Price Paid By Year
Property Price Paid in UB10 0LA, Chetwynd Drive by Year
The average sold property price by year was:
| Year | Average Sold Price | Price Change |
Sold Properties
|
|---|---|---|---|
| 2017 | £750,000 | 22% |
1 Property |
| 2014 | £585,000 | 10% |
1 Property |
| 2011 | £525,000 | 6% |
1 Property |
| 2007 | £492,500 | 22% |
2 Properties |
| 2002 | £385,000 | 19% |
1 Property |
| 2001 | £312,500 | 6% |
1 Property |
| 1999 | £295,000 | 44% |
1 Property |
| 1995 | £166,400 | - |
1 Property |