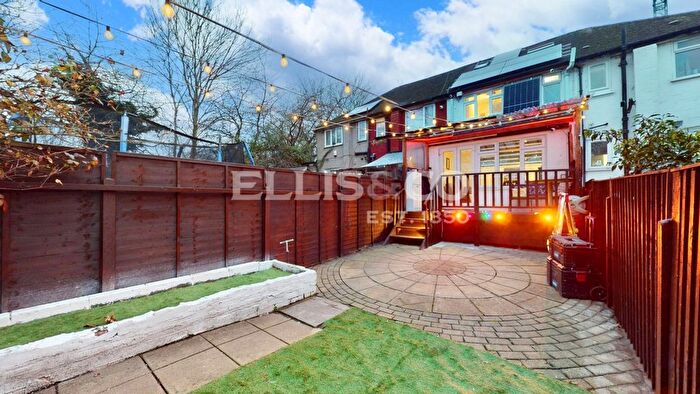
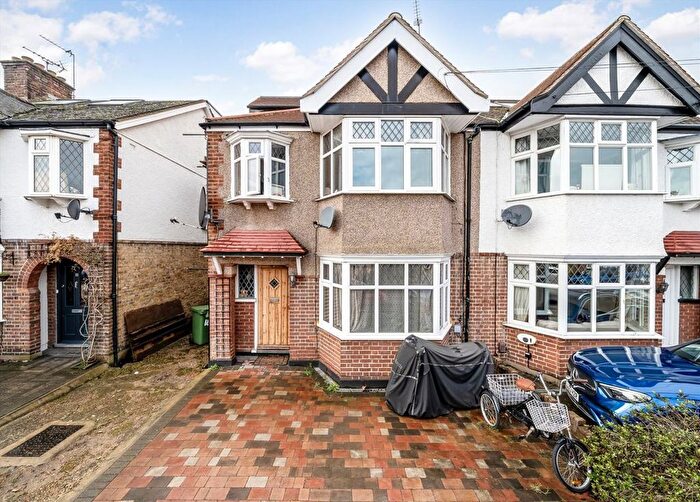
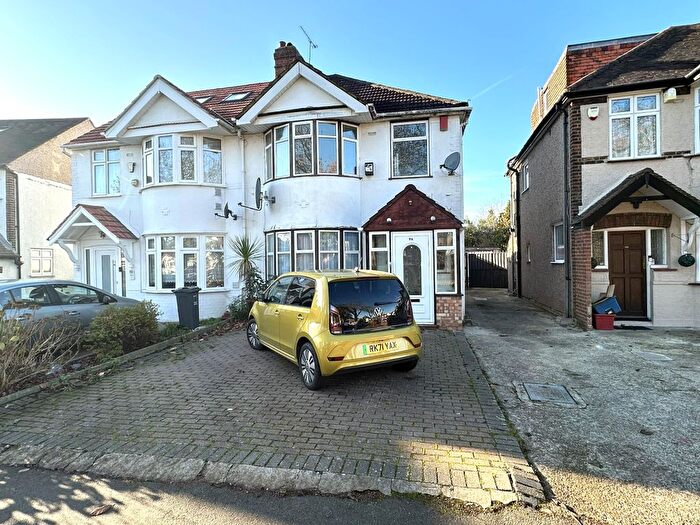
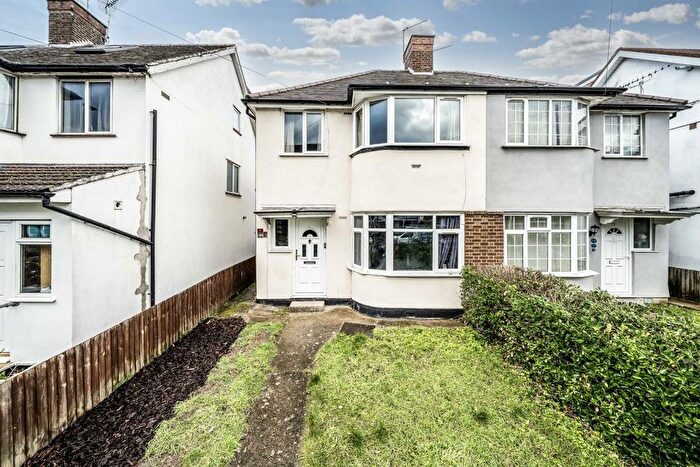
Houses for sale & to rent in Hounslow, Hounslow London Borough
House Prices in Hounslow
Properties in this part of Hounslow within the Hounslow London Borough have an average house price of £464,534.00 and had 1,362 Property Transactions within the last 3 years.¹ This area has 29,757 households² , where the most expensive property was sold for £2,075,000.00.
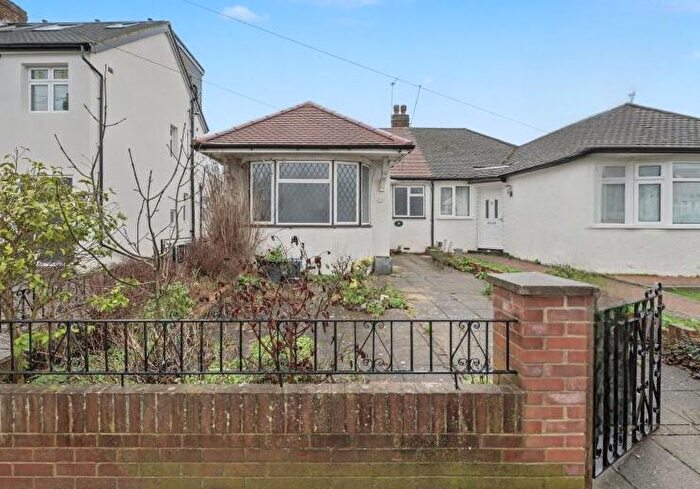
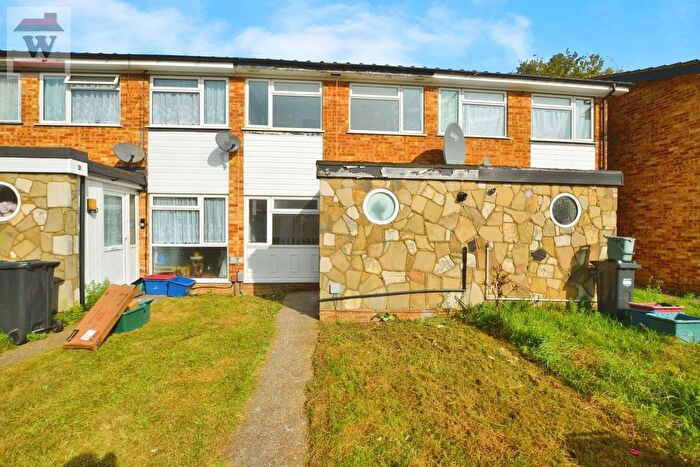
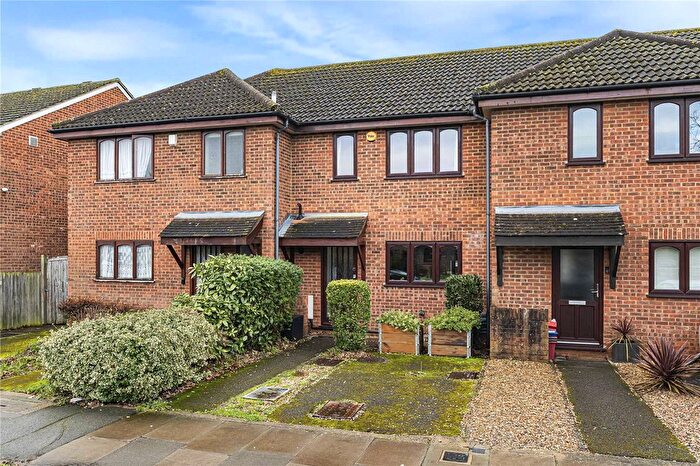
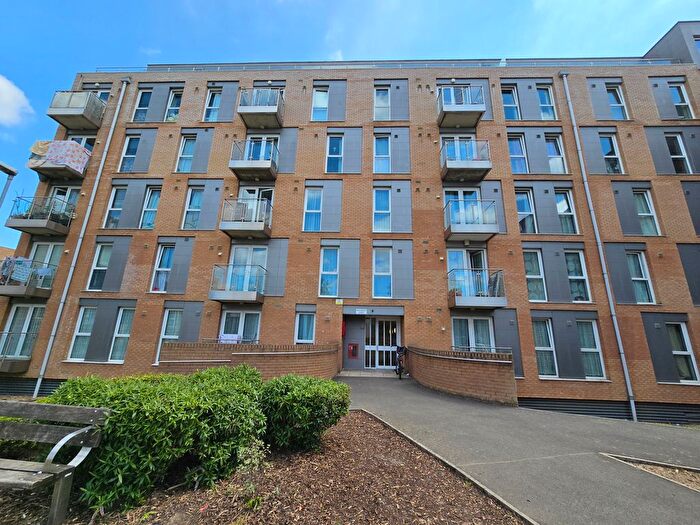
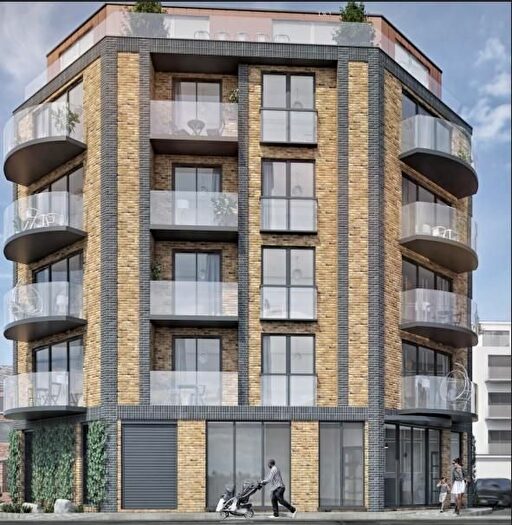
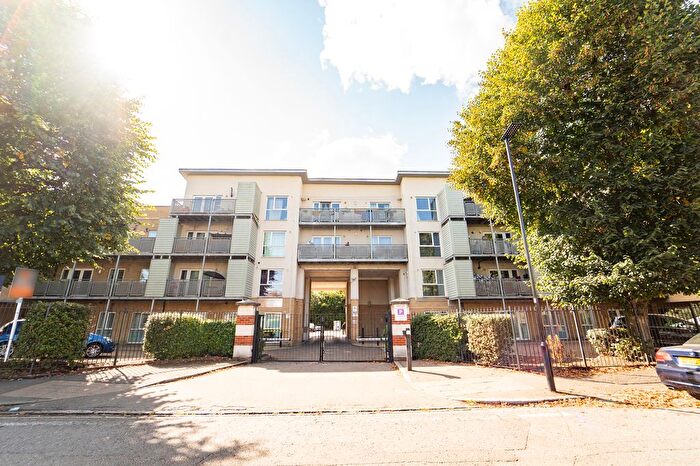
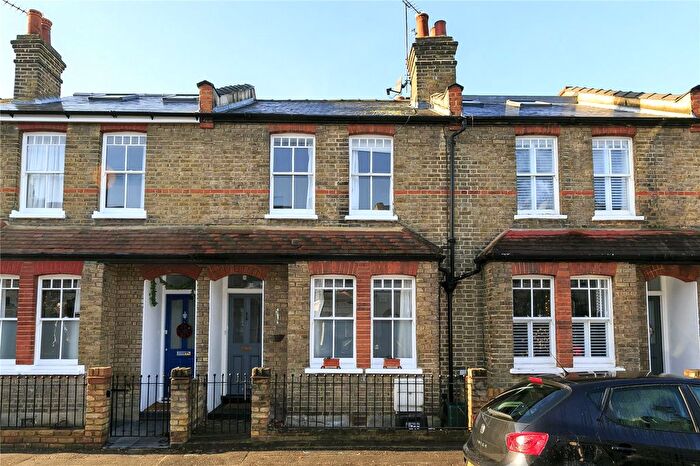
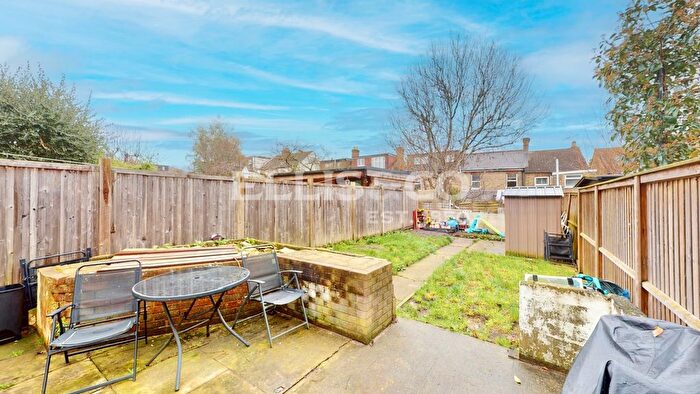
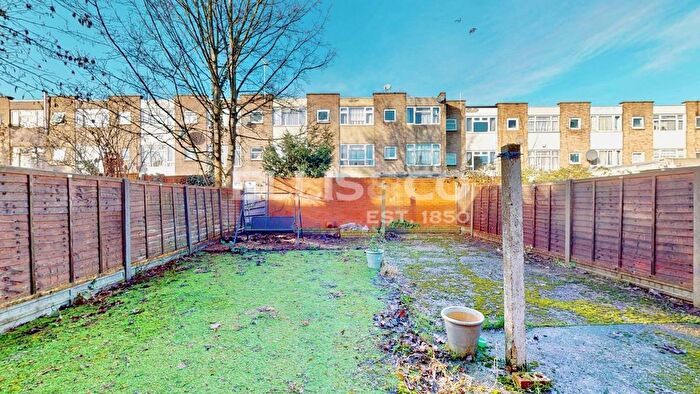
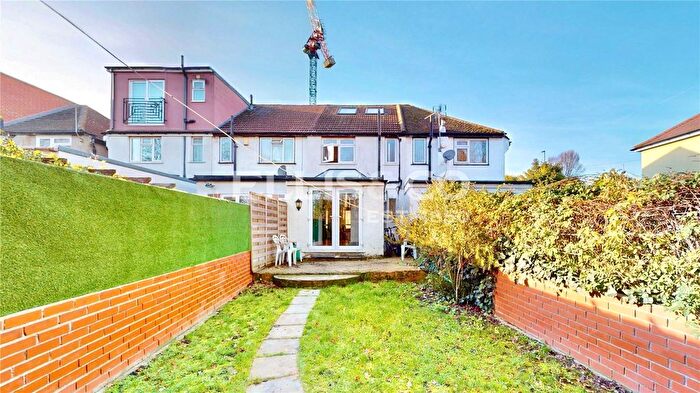
Properties for sale in Hounslow
Neighbourhoods in Hounslow
Navigate through our locations to find the location of your next house in Hounslow, Hounslow London Borough for sale or to rent.
Transport in Hounslow
Please see below transportation links in this area:
-
Hounslow Central Station
-
Hounslow West Station
-
Hounslow East Station
-
Hounslow Station
-
Osterley Station
-
Isleworth Station
-
Whitton Station
-
Hatton Cross Station
-
Syon Lane Station
-
Feltham Station
- FAQ
- Price Paid By Year
- Property Type Price
Frequently asked questions about Hounslow
What is the average price for a property for sale in Hounslow?
The average price for a property for sale in Hounslow is £464,534. This amount is 21% lower than the average price in Hounslow London Borough. There are more than 10,000 property listings for sale in Hounslow.
What locations have the most expensive properties for sale in Hounslow?
The locations with the most expensive properties for sale in Hounslow are Osterley And Spring Grove at an average of £608,346, Heston East at an average of £521,198 and Heston West at an average of £520,978.
What locations have the most affordable properties for sale in Hounslow?
The locations with the most affordable properties for sale in Hounslow are Hanworth Park at an average of £297,750, Hounslow Central at an average of £403,194 and Hounslow West at an average of £412,623.
Which train stations are available in or near Hounslow?
Some of the train stations available in or near Hounslow are Hounslow, Isleworth and Whitton.
Which tube stations are available in or near Hounslow?
Some of the tube stations available in or near Hounslow are Hounslow Central, Hounslow West and Hounslow East.
Property Price Paid in Hounslow by Year
The average sold property price by year was:
| Year | Average Sold Price | Price Change |
Sold Properties
|
|---|---|---|---|
| 2025 | £449,235 | -4% |
409 Properties |
| 2024 | £467,749 | -2% |
532 Properties |
| 2023 | £475,336 | 9% |
421 Properties |
| 2022 | £430,554 | -2% |
547 Properties |
| 2021 | £437,227 | 6% |
684 Properties |
| 2020 | £411,376 | 9% |
489 Properties |
| 2019 | £374,490 | 3% |
562 Properties |
| 2018 | £364,245 | 9% |
603 Properties |
| 2017 | £329,672 | - |
865 Properties |
| 2016 | £329,687 | 1% |
798 Properties |
| 2015 | £326,588 | 15% |
769 Properties |
| 2014 | £278,302 | 4% |
711 Properties |
| 2013 | £268,371 | 7% |
574 Properties |
| 2012 | £248,916 | -0,3% |
481 Properties |
| 2011 | £249,777 | 2% |
463 Properties |
| 2010 | £243,742 | 3% |
518 Properties |
| 2009 | £235,278 | -3% |
359 Properties |
| 2008 | £242,718 | -3% |
552 Properties |
| 2007 | £250,553 | 8% |
1,395 Properties |
| 2006 | £230,702 | 5% |
1,162 Properties |
| 2005 | £219,167 | 3% |
1,009 Properties |
| 2004 | £211,794 | 1% |
1,139 Properties |
| 2003 | £208,806 | 18% |
1,165 Properties |
| 2002 | £171,622 | 13% |
1,385 Properties |
| 2001 | £148,494 | 13% |
1,220 Properties |
| 2000 | £129,093 | 16% |
1,131 Properties |
| 1999 | £108,127 | 17% |
1,180 Properties |
| 1998 | £90,275 | 10% |
975 Properties |
| 1997 | £81,131 | 11% |
1,235 Properties |
| 1996 | £71,852 | 4% |
994 Properties |
| 1995 | £68,896 | - |
809 Properties |
Property Price per Property Type in Hounslow
Here you can find historic sold price data in order to help with your property search.
The average Property Paid Price for specific property types in the last three years are:
| Property Type | Average Sold Price | Sold Properties |
|---|---|---|
| Semi Detached House | £582,396.00 | 496 Semi Detached Houses |
| Terraced House | £480,230.00 | 384 Terraced Houses |
| Detached House | £733,925.00 | 60 Detached Houses |
| Flat | £273,421.00 | 422 Flats |

