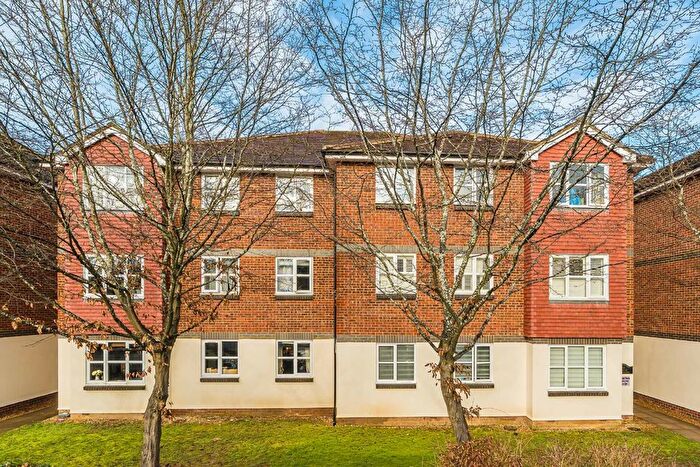
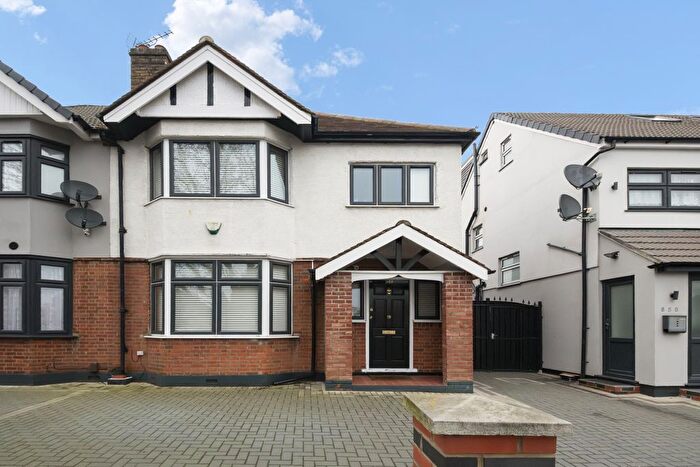
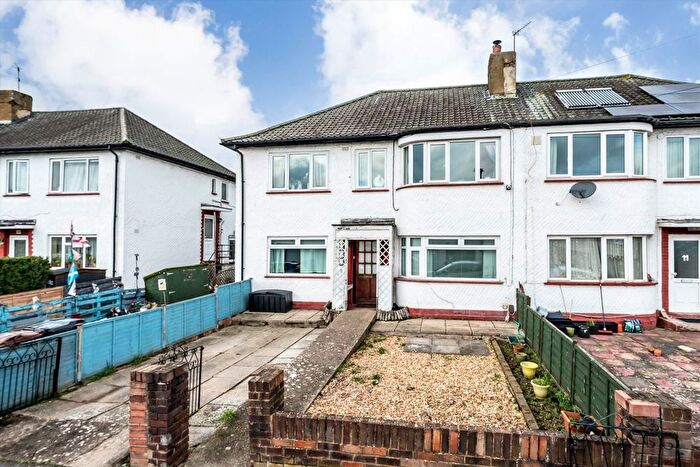
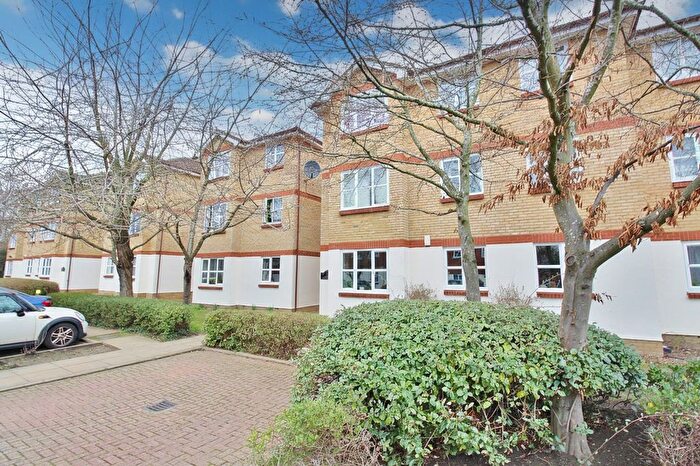
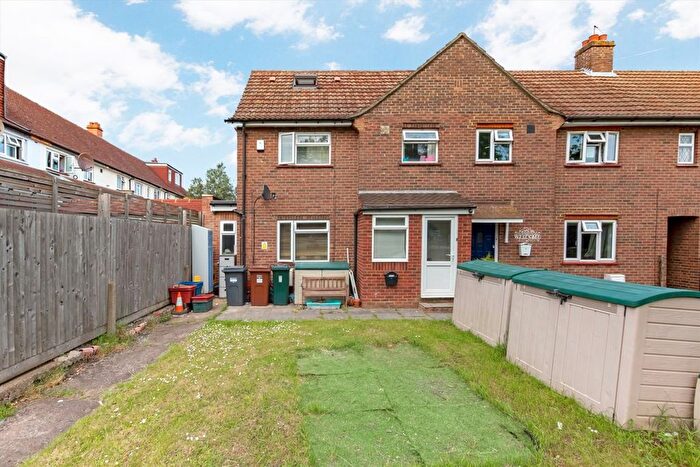
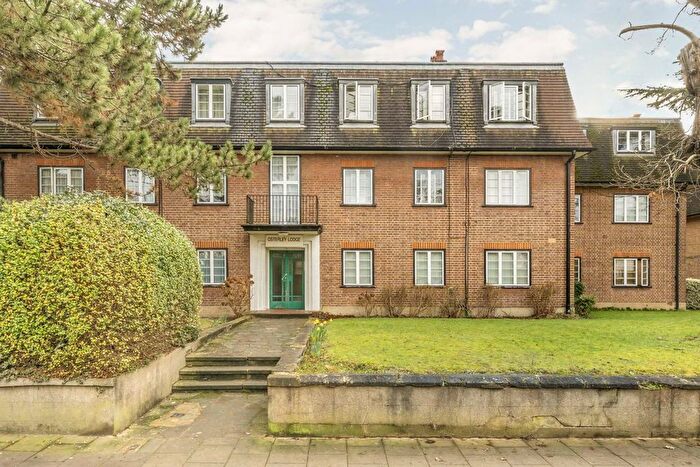
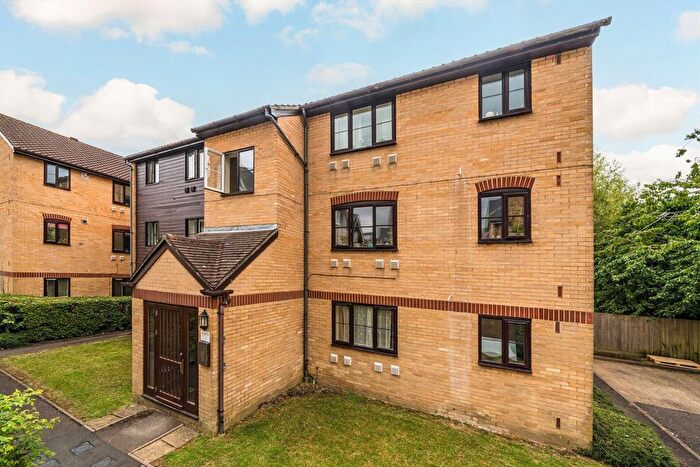
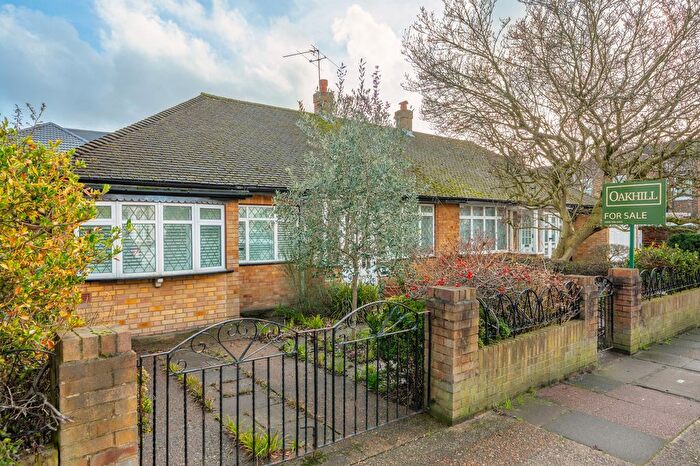
Houses for sale & to rent in Osterley And Spring Grove, Hounslow
House Prices in Osterley And Spring Grove
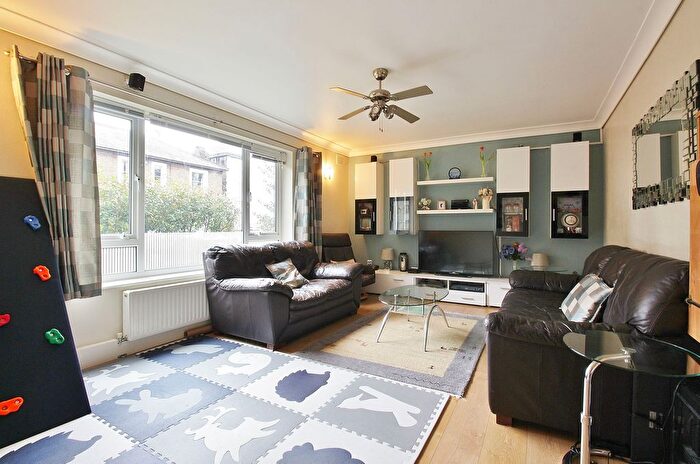
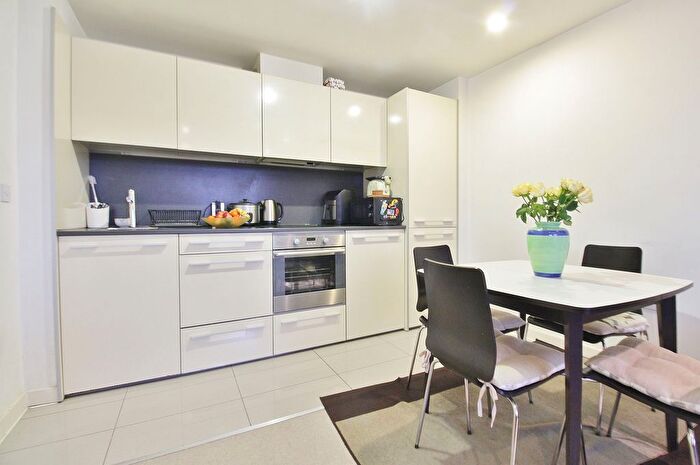
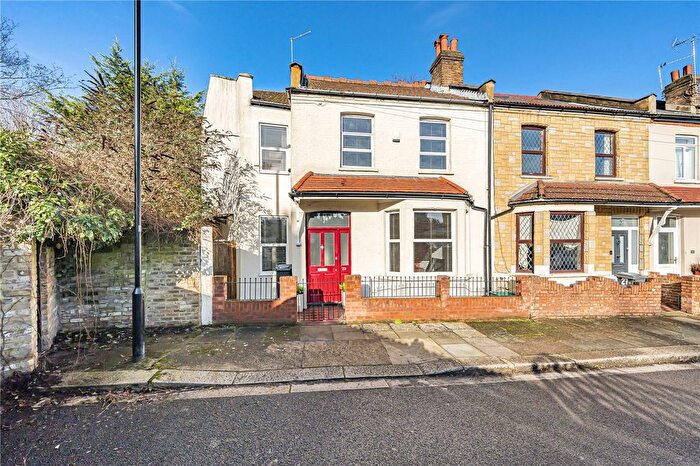
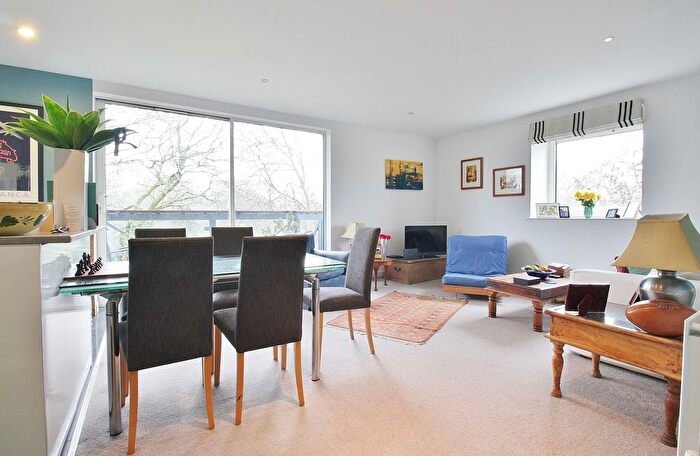
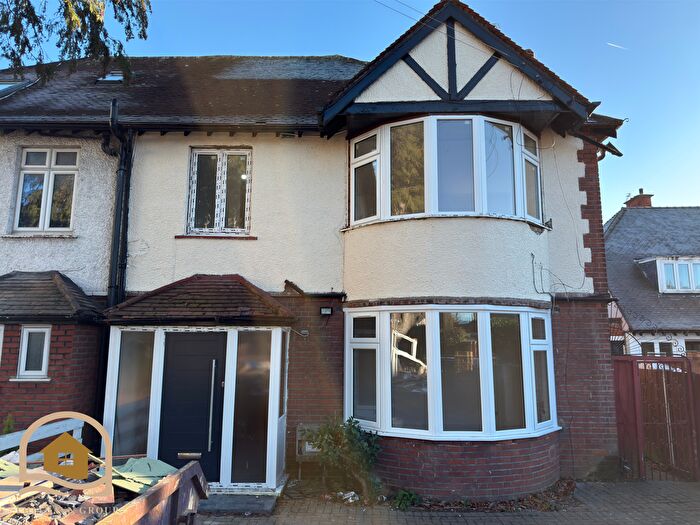
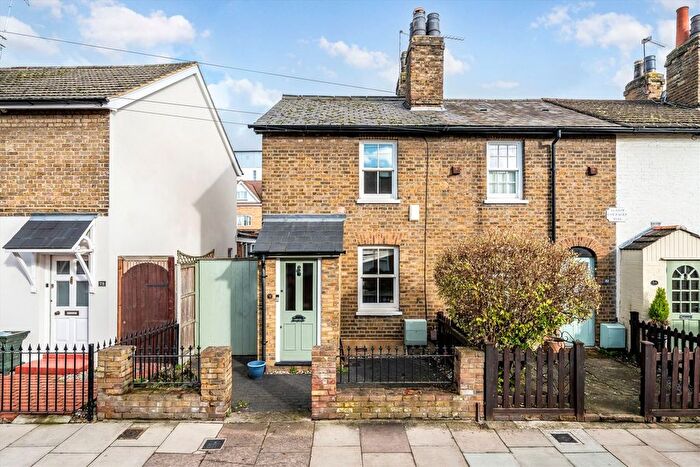
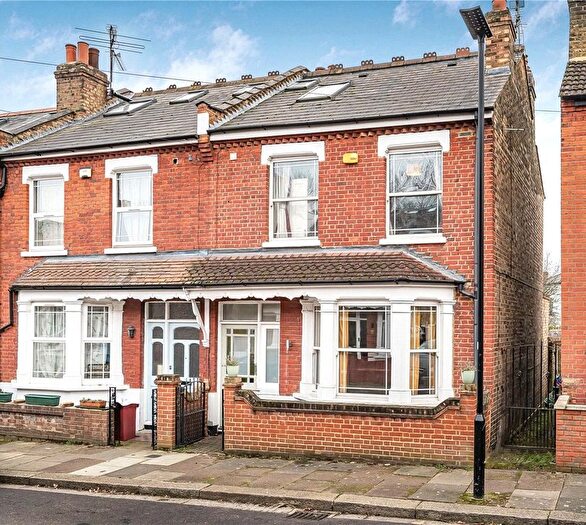
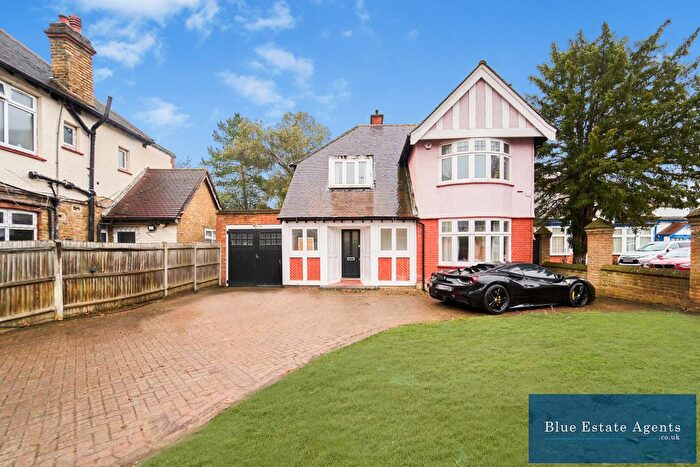
Properties in this part of Osterley And Spring Grove within Hounslow have an average house price of £608,346.00 and had 13 Property Transactions within the last 3 years¹. This area has 204 households² , where the most expensive property was sold for £1,050,000.00.
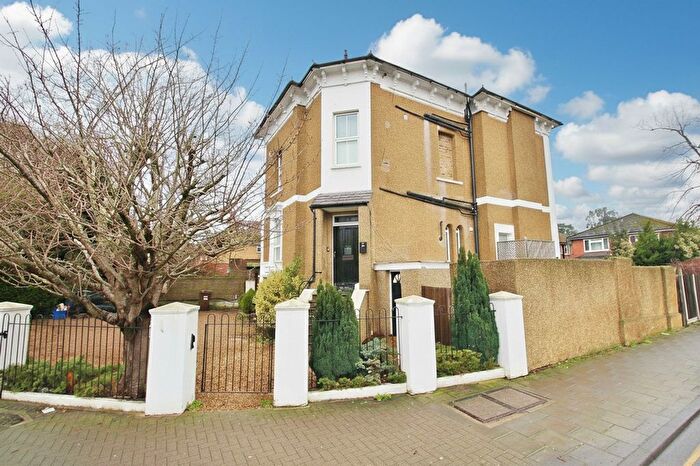
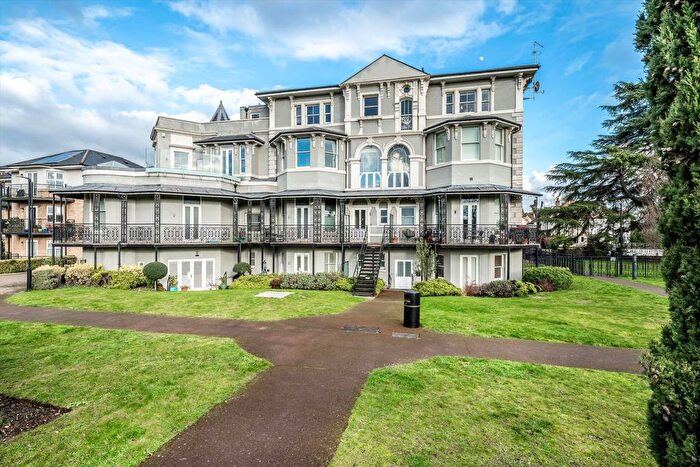
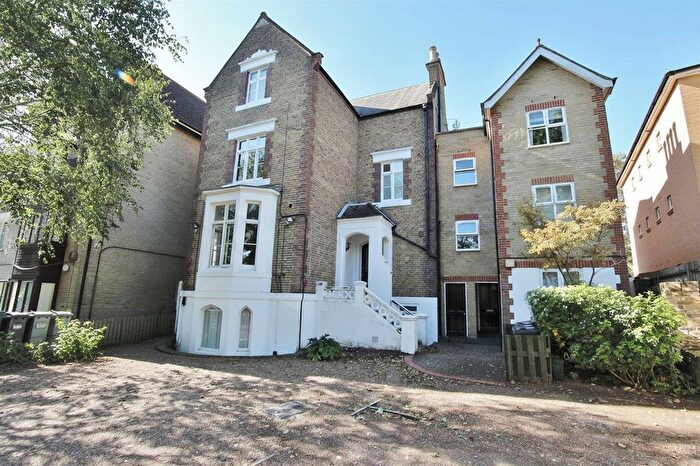
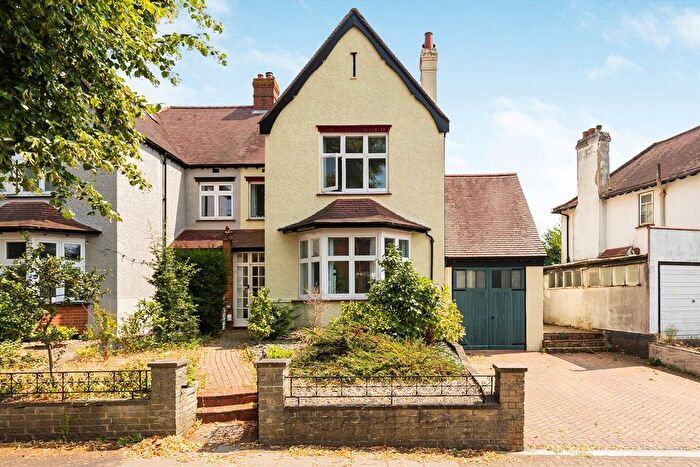
Properties for sale in Osterley And Spring Grove
Roads and Postcodes in Osterley And Spring Grove
Navigate through our locations to find the location of your next house in Osterley And Spring Grove, Hounslow for sale or to rent.
| Streets | Postcodes |
|---|---|
| Amalgamated Drive | TW8 9EZ |
| Brentside Executive Centre | TW8 9DR |
| Great West Road | TW5 0TH TW5 0TJ TW5 0TL TW5 0TQ TW8 9DN TW8 9DU TW8 9EA TW8 9EG TW8 9EP TW8 9ES TW8 9EU |
| Harlequin Avenue | TW8 9EW |
| Jersey Road | TW5 0TW TW5 0TP |
| Lulworth Avenue | TW5 0TY TW5 0TZ |
| New Horizons Court | TW8 9ET |
| Ryan Drive | TW8 9ZB |
| Shield Drive | TW8 9EX |
| Stucley Road | TW5 0TN |
| Syon Gate Way | TW8 9DD |
| Transport Avenue | TW8 9HA TW8 9HF |
| West Cross Way | TW8 9DE |
| Windsor Close | TW8 9DZ |
| TW8 9GH |
Transport near Osterley And Spring Grove
-
Syon Lane Station
-
Isleworth Station
-
Osterley Station
-
Boston Manor Station
-
Brentford Station
-
Hounslow East Station
-
Northfields Station
-
Hounslow Central Station
-
South Ealing Station
-
Hounslow Station
- FAQ
- Price Paid By Year
- Property Type Price
Frequently asked questions about Osterley And Spring Grove
What is the average price for a property for sale in Osterley And Spring Grove?
The average price for a property for sale in Osterley And Spring Grove is £608,346. This amount is 31% higher than the average price in Hounslow. There are 1,796 property listings for sale in Osterley And Spring Grove.
What streets have the most expensive properties for sale in Osterley And Spring Grove?
The streets with the most expensive properties for sale in Osterley And Spring Grove are Lulworth Avenue at an average of £801,666 and Stucley Road at an average of £735,000.
What streets have the most affordable properties for sale in Osterley And Spring Grove?
The street with the most affordable properties for sale in Osterley And Spring Grove is Great West Road at an average of £464,812.
Which train stations are available in or near Osterley And Spring Grove?
Some of the train stations available in or near Osterley And Spring Grove are Syon Lane, Isleworth and Brentford.
Which tube stations are available in or near Osterley And Spring Grove?
Some of the tube stations available in or near Osterley And Spring Grove are Osterley, Boston Manor and Hounslow East.
Property Price Paid in Osterley And Spring Grove by Year
The average sold property price by year was:
| Year | Average Sold Price | Price Change |
Sold Properties
|
|---|---|---|---|
| 2025 | £675,000 | 22% |
3 Properties |
| 2024 | £524,428 | -41% |
7 Properties |
| 2023 | £737,500 | 17% |
3 Properties |
| 2022 | £612,500 | 9% |
2 Properties |
| 2021 | £557,000 | 3% |
5 Properties |
| 2020 | £542,500 | -26% |
2 Properties |
| 2019 | £683,333 | 51% |
3 Properties |
| 2018 | £335,750 | -30% |
4 Properties |
| 2017 | £438,000 | -14% |
5 Properties |
| 2016 | £498,333 | -31% |
3 Properties |
| 2015 | £653,000 | 32% |
4 Properties |
| 2014 | £443,750 | 17% |
4 Properties |
| 2013 | £367,750 | -16% |
6 Properties |
| 2011 | £428,000 | 14% |
3 Properties |
| 2010 | £366,750 | 23% |
2 Properties |
| 2009 | £280,625 | -9% |
8 Properties |
| 2008 | £305,500 | 2% |
6 Properties |
| 2007 | £298,600 | -26% |
5 Properties |
| 2006 | £376,385 | 10% |
14 Properties |
| 2005 | £340,575 | -16% |
6 Properties |
| 2004 | £393,750 | 27% |
4 Properties |
| 2003 | £285,683 | 2% |
11 Properties |
| 2002 | £280,954 | 8% |
11 Properties |
| 2001 | £259,573 | 24% |
13 Properties |
| 2000 | £197,062 | 12% |
8 Properties |
| 1999 | £172,912 | 17% |
12 Properties |
| 1998 | £143,245 | -9% |
10 Properties |
| 1997 | £155,755 | 33% |
10 Properties |
| 1996 | £103,744 | 6% |
9 Properties |
| 1995 | £97,362 | - |
8 Properties |
Property Price per Property Type in Osterley And Spring Grove
Here you can find historic sold price data in order to help with your property search.
The average Property Paid Price for specific property types in the last three years are:
| Property Type | Average Sold Price | Sold Properties |
|---|---|---|
| Semi Detached House | £881,250.00 | 4 Semi Detached Houses |
| Terraced House | £670,000.00 | 1 Terraced House |
| Flat | £363,083.00 | 6 Flats |
| Detached House | £767,500.00 | 2 Detached Houses |

