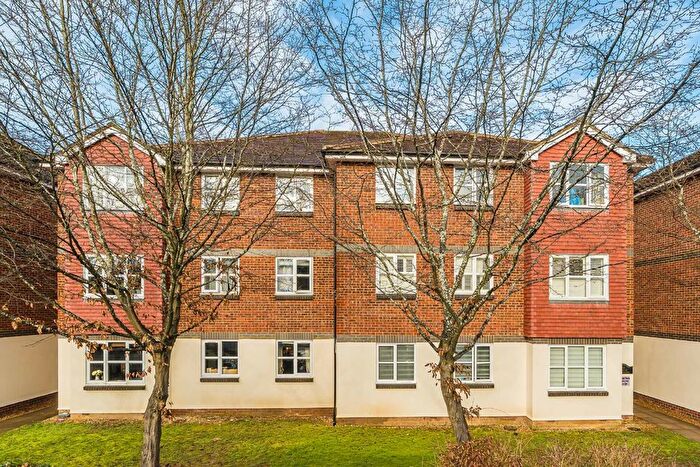
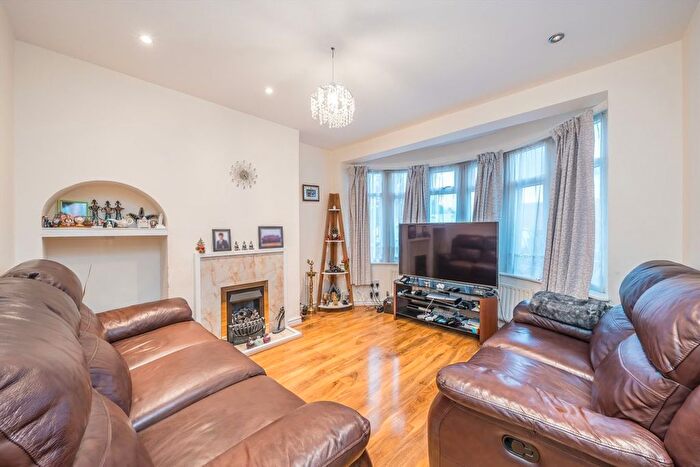
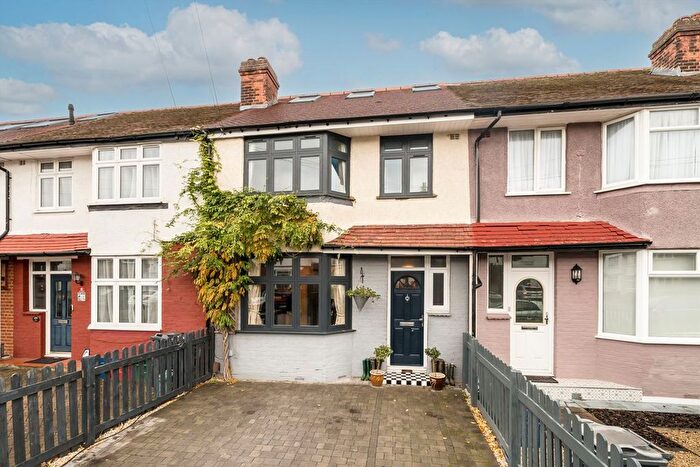
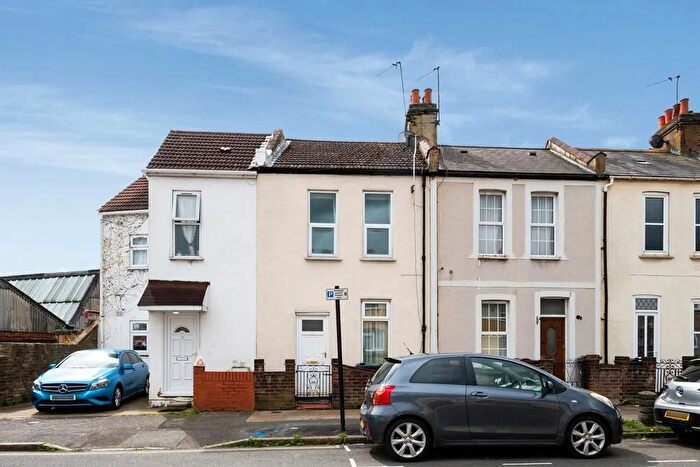
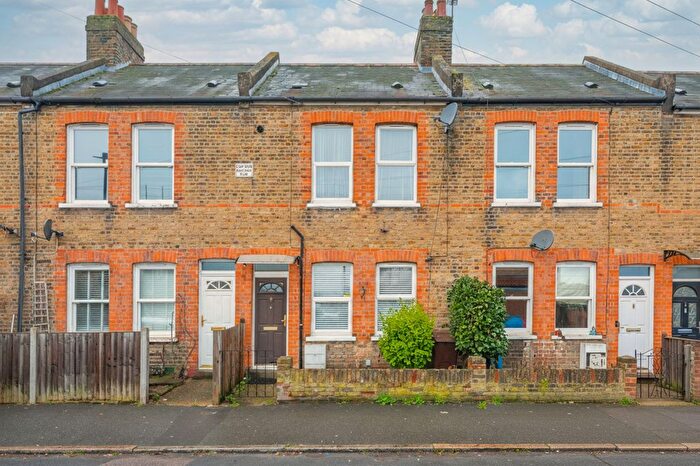
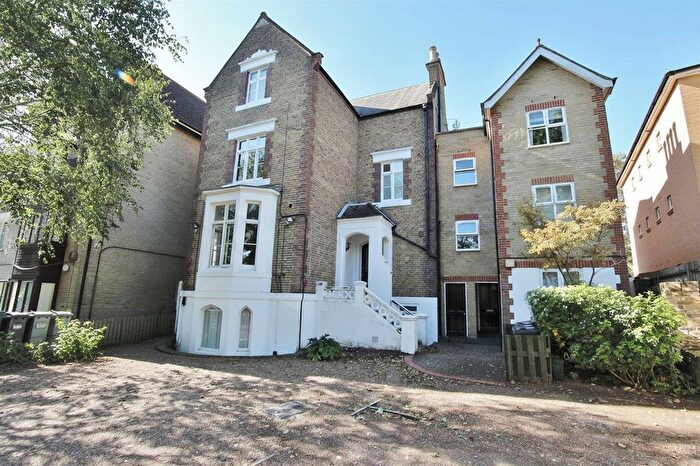
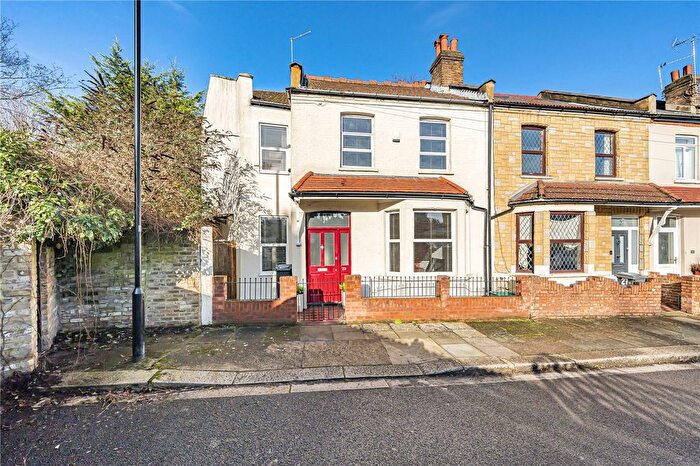
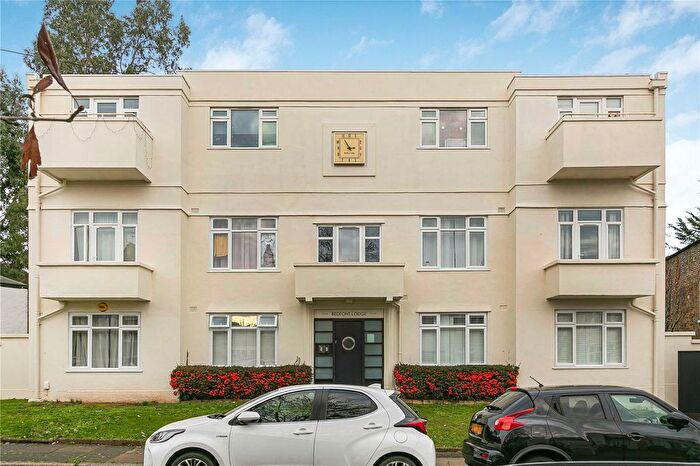
Houses for sale & to rent in Hounslow South, Isleworth
House Prices in Hounslow South
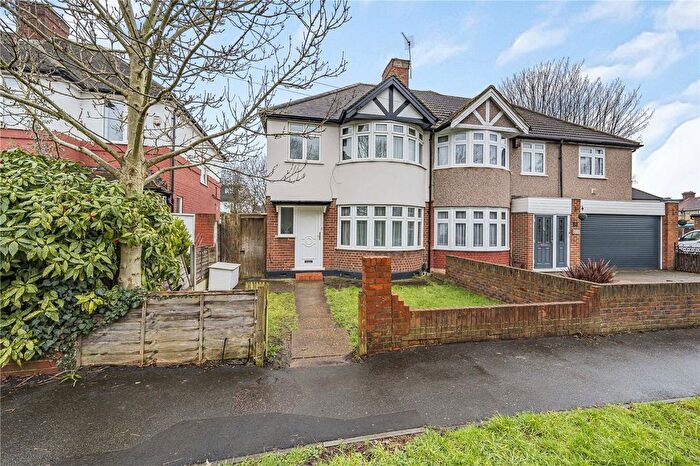
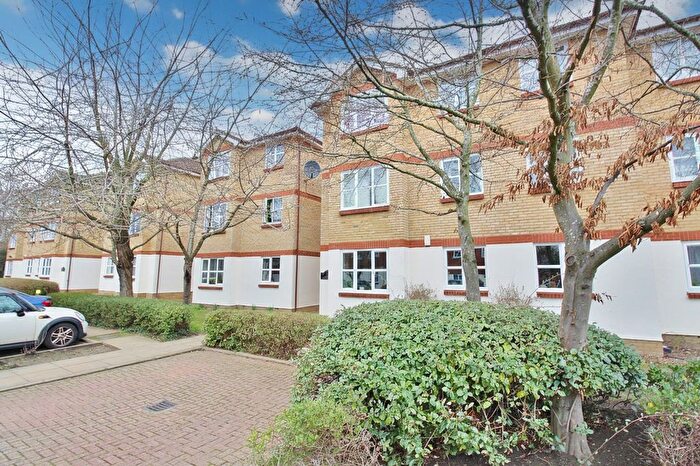
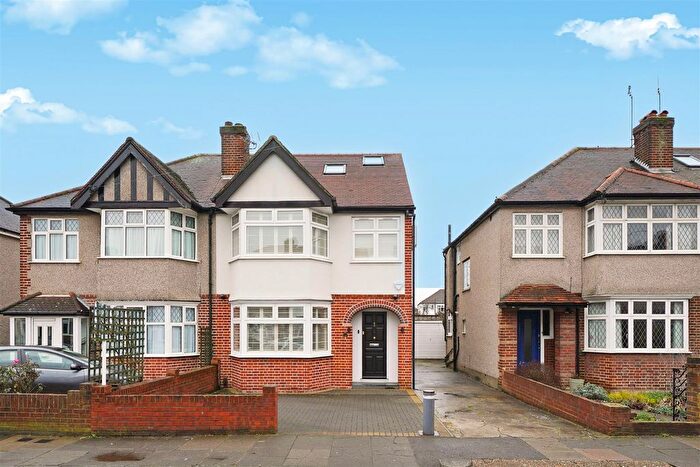
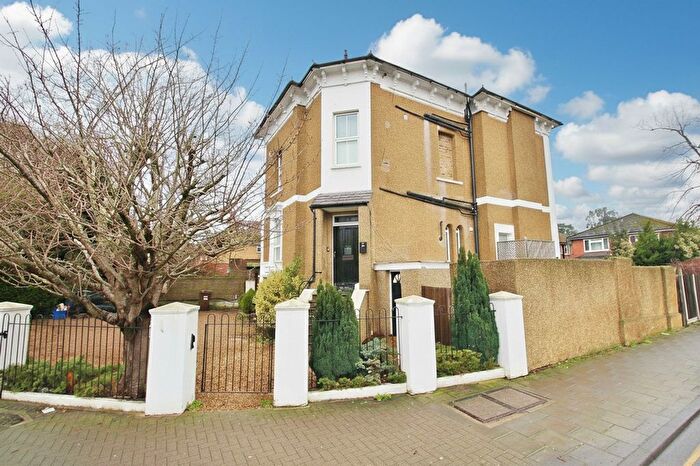
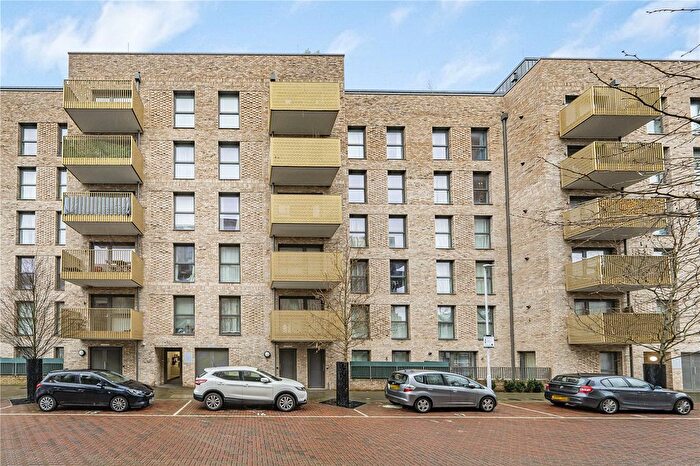
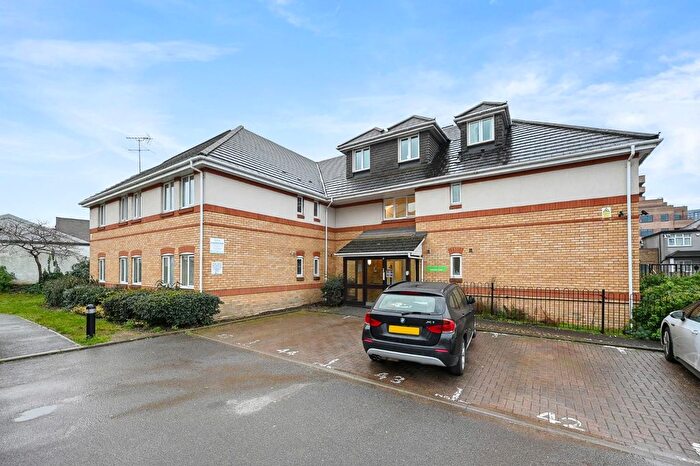
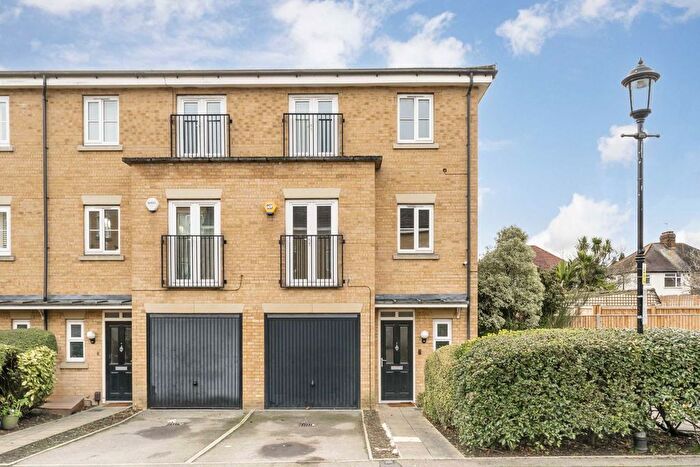
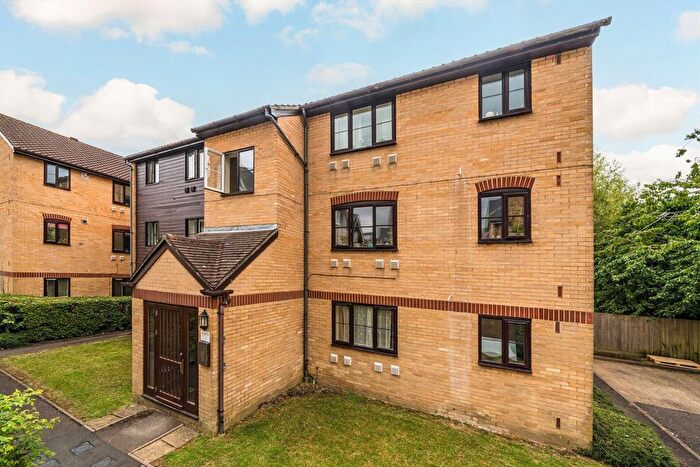
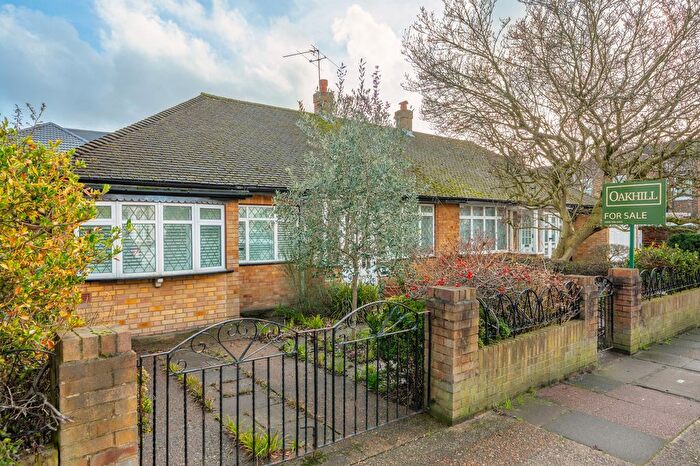
Properties in this part of Hounslow South within Isleworth have an average house price of £557,663.00 and had 135 Property Transactions within the last 3 years¹. This area has 1,779 households² , where the most expensive property was sold for £1,450,000.00.
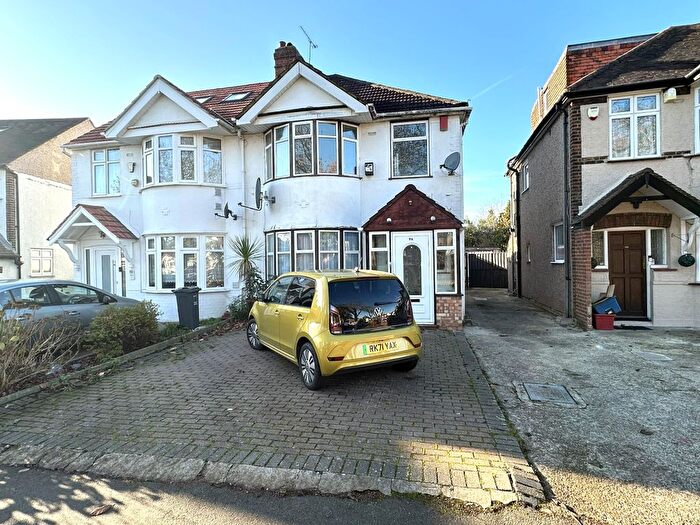
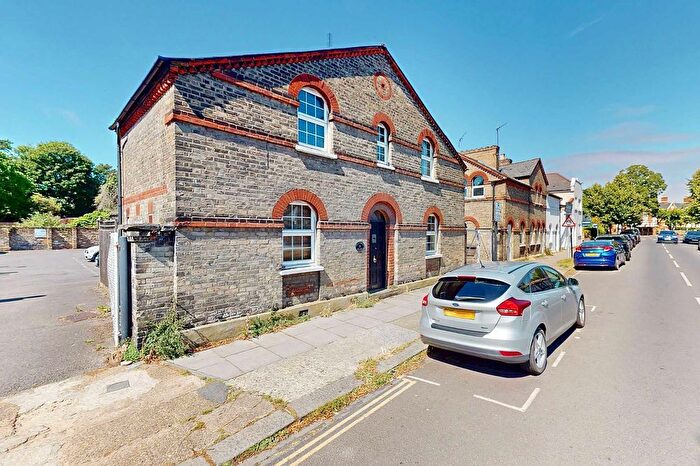
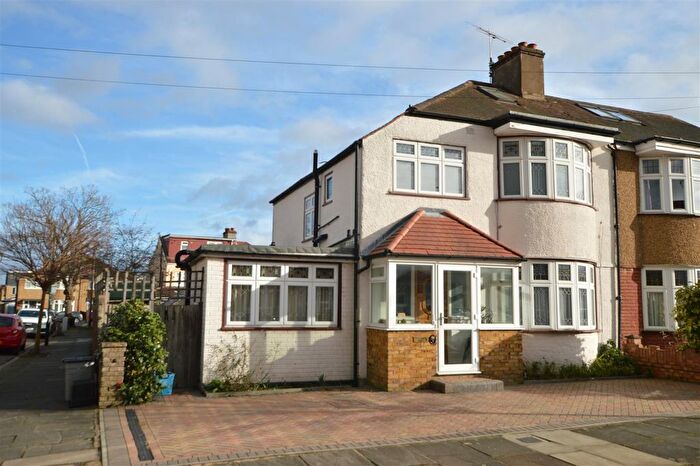
Properties for sale in Hounslow South
Roads and Postcodes in Hounslow South
Navigate through our locations to find the location of your next house in Hounslow South, Isleworth for sale or to rent.
| Streets | Postcodes |
|---|---|
| Abinger Gardens | TW7 6LH TW7 6LQ TW7 6LG |
| Amberside Close | TW7 7NY |
| Arnold Crescent | TW7 7NS TW7 7NT TW7 7NU |
| Aylett Road | TW7 6NP |
| Bracken End | TW7 7PW |
| Bridge Road | TW7 6HE TW7 6HF |
| Clayton Road | TW7 6LE |
| Consort Mews | TW7 7NA |
| Constable Gardens | TW7 7NH |
| County Gardens | TW7 7EH |
| Crofters Close | TW7 7PH |
| Elmer Gardens | TW7 6EY TW7 6EZ TW7 6HA TW7 6HB |
| Essex Avenue | TW7 6LF |
| Farnell Road | TW7 6EX |
| Gainsborough Gardens | TW7 7PE |
| Gibson Close | TW7 6LZ TW7 6NE TW7 6LY |
| Glen Walk | TW7 7PT |
| Hall Road | TW7 7PA TW7 7PB TW7 7PD TW7 7PF TW7 7PG TW7 7PQ |
| Harlequin Close | TW7 7LA |
| Harvesters Close | TW7 7PP TW7 7PS |
| Heather Close | TW7 7PR |
| Kneller Gardens | TW7 7NP TW7 7NR TW7 7NW |
| Munnings Gardens | TW7 7NQ |
| Paget Lane | TW7 6ED |
| Ploughmans End | TW7 7PJ |
| Queensbridge Park | TW7 7LY TW7 7NB |
| Reapers Way | TW7 7PN |
| Regency Mews | TW7 7LX |
| Riverside Walk | TW7 6HP TW7 6HR TW7 6HW |
| St Johns Road | TW7 6NB |
| Sussex Avenue | TW7 6LA TW7 6LB TW7 6LD TW7 6LJ |
| Thatchers Way | TW7 7PL |
| Wainwright Grove | TW7 7PU |
| Whitton Dene | TW7 7LU TW7 7ND TW7 7NE TW7 7NF TW7 7NG |
| Woodland Gardens | TW7 6LL TW7 6LN TW7 6LP TW7 6LR TW7 6LS TW7 6LT TW7 6LU TW7 6LW TW7 6LX |
| Woodlands Grove | TW7 6NS TW7 6NT TW7 6NU |
| Woodlands Road | TW7 6JT TW7 6JU TW7 6JX TW7 6JY TW7 6JZ TW7 6NR TW7 6JS |
| Worton Road | TW7 6ER TW7 6HG TW7 6HJ TW7 6HL TW7 6HN TW7 6HQ TW7 6GA |
| Yeomans Mews | TW7 7LZ |
Transport near Hounslow South
-
Hounslow Station
-
Hounslow East Station
-
Isleworth Station
-
Hounslow Central Station
-
Osterley Station
-
Whitton Station
-
Twickenham Station
-
St Margarets Station
-
Syon Lane Station
-
Strawberry Hill Station
- FAQ
- Price Paid By Year
- Property Type Price
Frequently asked questions about Hounslow South
What is the average price for a property for sale in Hounslow South?
The average price for a property for sale in Hounslow South is £557,663. This amount is 7% higher than the average price in Isleworth. There are 2,411 property listings for sale in Hounslow South.
What streets have the most expensive properties for sale in Hounslow South?
The streets with the most expensive properties for sale in Hounslow South are Woodlands Road at an average of £729,750, Riverside Walk at an average of £689,750 and Woodland Gardens at an average of £684,232.
What streets have the most affordable properties for sale in Hounslow South?
The streets with the most affordable properties for sale in Hounslow South are Gibson Close at an average of £256,125, Glen Walk at an average of £320,500 and Harvesters Close at an average of £345,003.
Which train stations are available in or near Hounslow South?
Some of the train stations available in or near Hounslow South are Hounslow, Isleworth and Whitton.
Which tube stations are available in or near Hounslow South?
Some of the tube stations available in or near Hounslow South are Hounslow East, Hounslow Central and Osterley.
Property Price Paid in Hounslow South by Year
The average sold property price by year was:
| Year | Average Sold Price | Price Change |
Sold Properties
|
|---|---|---|---|
| 2025 | £582,125 | 3% |
40 Properties |
| 2024 | £563,808 | 5% |
43 Properties |
| 2023 | £533,766 | 1% |
52 Properties |
| 2022 | £527,660 | 0,2% |
63 Properties |
| 2021 | £526,419 | 5% |
71 Properties |
| 2020 | £500,851 | 6% |
47 Properties |
| 2019 | £470,198 | -4% |
45 Properties |
| 2018 | £487,526 | 3% |
63 Properties |
| 2017 | £473,697 | 0,4% |
59 Properties |
| 2016 | £471,997 | 8% |
57 Properties |
| 2015 | £435,618 | 12% |
59 Properties |
| 2014 | £383,477 | 12% |
65 Properties |
| 2013 | £338,660 | 6% |
65 Properties |
| 2012 | £317,604 | 12% |
65 Properties |
| 2011 | £280,998 | 0,3% |
55 Properties |
| 2010 | £280,290 | 8% |
41 Properties |
| 2009 | £256,798 | -13% |
43 Properties |
| 2008 | £289,369 | -7% |
40 Properties |
| 2007 | £308,573 | 18% |
113 Properties |
| 2006 | £252,177 | 7% |
88 Properties |
| 2005 | £235,617 | 1% |
63 Properties |
| 2004 | £233,832 | 12% |
88 Properties |
| 2003 | £205,640 | 12% |
81 Properties |
| 2002 | £181,181 | -3% |
107 Properties |
| 2001 | £186,504 | 23% |
93 Properties |
| 2000 | £143,179 | 14% |
67 Properties |
| 1999 | £123,172 | 10% |
115 Properties |
| 1998 | £110,992 | 18% |
78 Properties |
| 1997 | £90,504 | 15% |
83 Properties |
| 1996 | £77,361 | 4% |
90 Properties |
| 1995 | £74,112 | - |
67 Properties |
Property Price per Property Type in Hounslow South
Here you can find historic sold price data in order to help with your property search.
The average Property Paid Price for specific property types in the last three years are:
| Property Type | Average Sold Price | Sold Properties |
|---|---|---|
| Semi Detached House | £625,749.00 | 69 Semi Detached Houses |
| Detached House | £919,580.00 | 5 Detached Houses |
| Terraced House | £520,941.00 | 42 Terraced Houses |
| Flat | £296,342.00 | 19 Flats |

