
Houses for sale & to rent in Isleworth, Isleworth
House Prices in Isleworth
Properties in this part of Isleworth within Isleworth have an average house price of £519k and had 362 Property Transactions within the last 3 years¹. This area has 4,639 households² , where the most expensive property was sold for £2.5M.
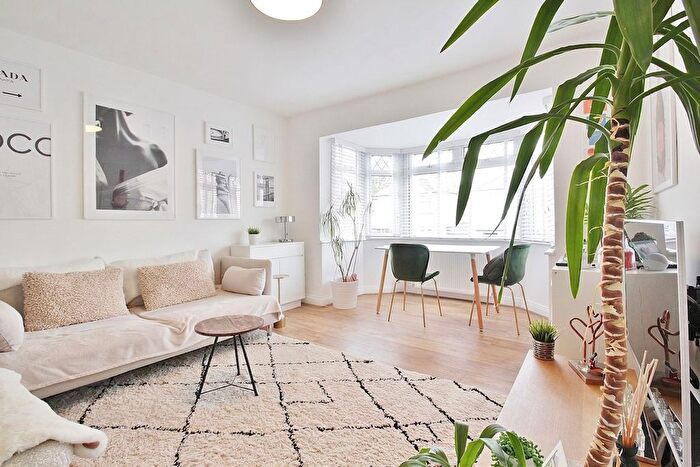
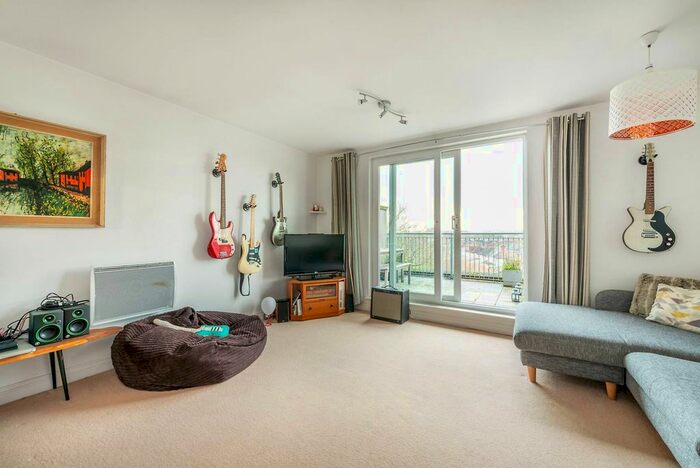
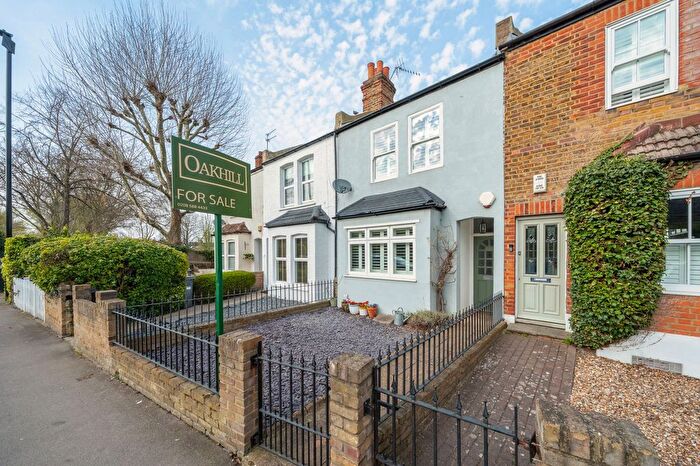
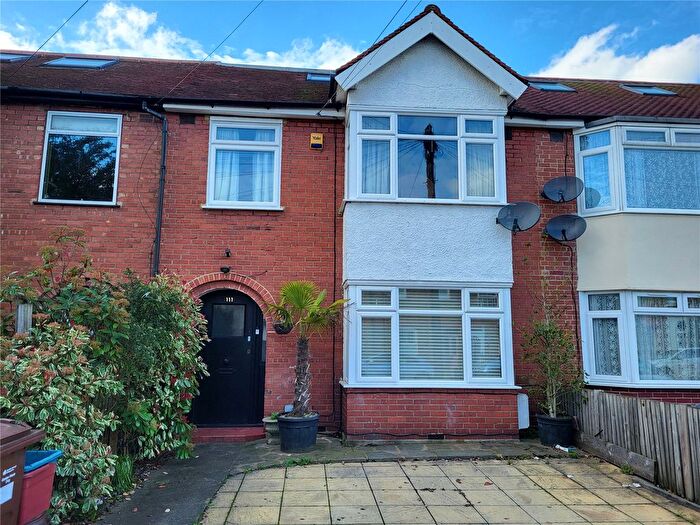
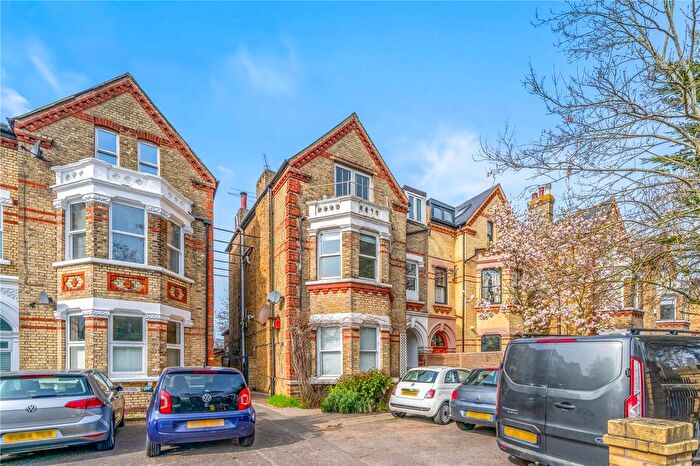
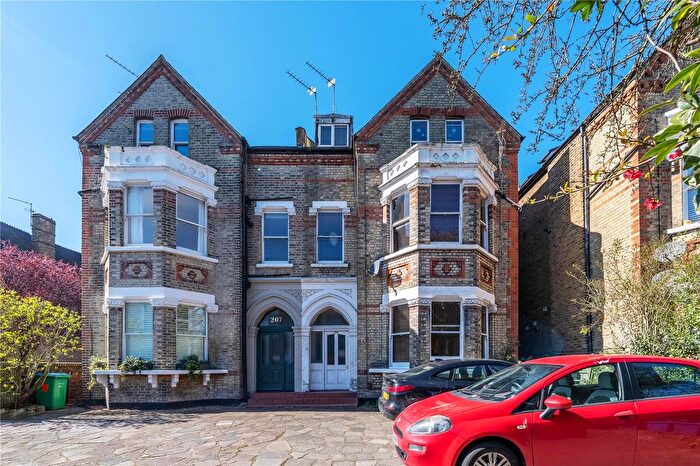
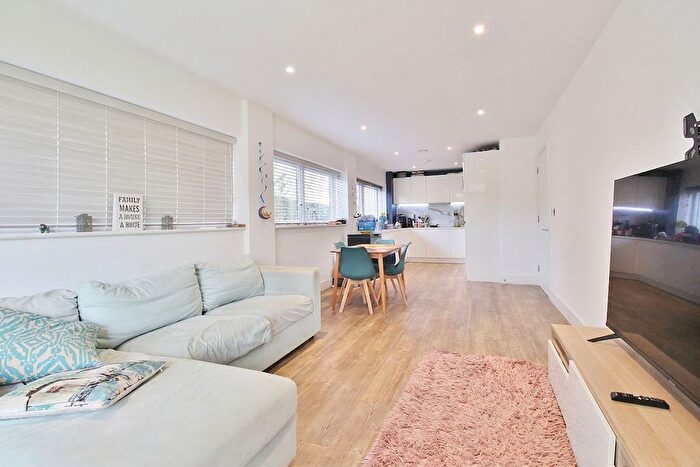
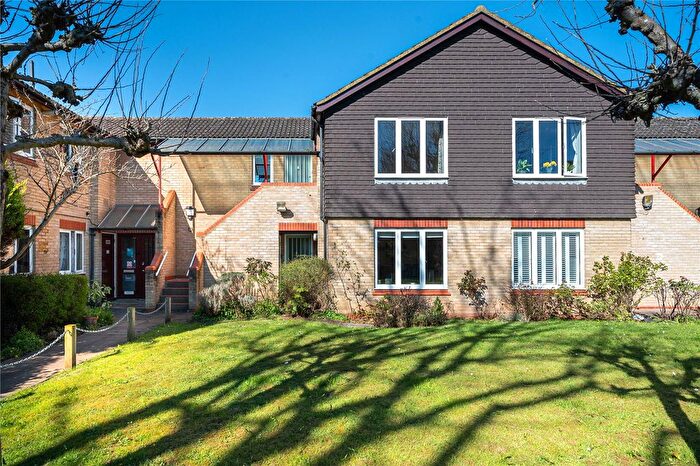
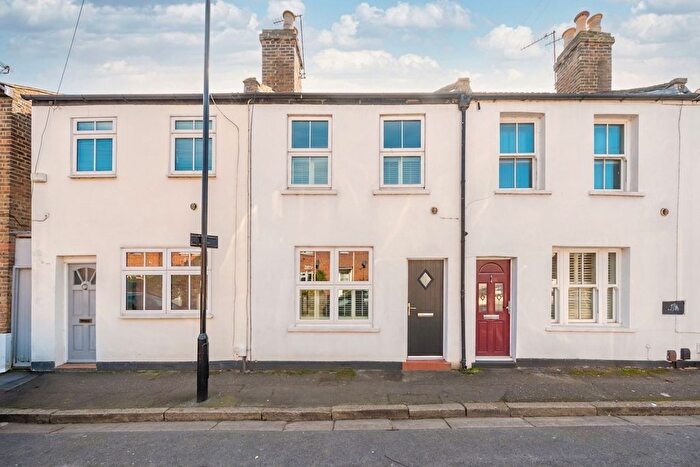
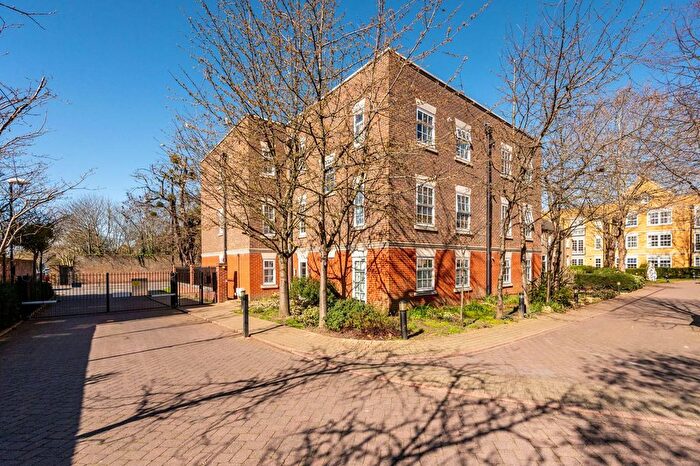
Properties for sale in Isleworth
![]()
If you are looking to sell your house, let it out, or receive a property valuation, an expert can help you.
Click the button below to get started.
Roads and Postcodes in Isleworth
Navigate through our locations to find the location of your next house in Isleworth, Isleworth for sale or to rent.
Transport near Isleworth
-
 Isleworth Station
 -
St Margarets Station
-
Twickenham Station
-
Syon Lane Station
-
 Hounslow East Station
 -
 Richmond Station
 -
Hounslow Station
-
Osterley Station
-
Hounslow Central Station
-
Whitton Station
- FAQ
- Price Paid By Year
- Property Type Price
Frequently asked questions about Isleworth
What is the average price for a property for sale in Isleworth?
The average price for a property for sale in Isleworth is £519,306. This amount is 0.61% lower than the average price in Isleworth. There are 2,927 property listings for sale in Isleworth.
What streets have the most expensive properties for sale in Isleworth?
The streets with the most expensive properties for sale in Isleworth are Egerton Drive at an average of £1,453,333, Church Street at an average of £1,387,500 and Herons Place at an average of £1,043,750.
What streets have the most affordable properties for sale in Isleworth?
The streets with the most affordable properties for sale in Isleworth are South Street at an average of £252,666, Shrewsbury Walk at an average of £275,000 and Braddock Close at an average of £276,666.
Which train stations are available in or near Isleworth?
Some of the train stations available in or near Isleworth are Isleworth, St Margarets and Twickenham.
Which tube stations are available in or near Isleworth?
Some of the tube stations available in or near Isleworth are Hounslow East, Richmond and Osterley.
Property Price Paid in Isleworth by Year
The average sold property price by year was:
| Year | Average Sold Price | Price Change |
Sold Properties
|
|---|---|---|---|
| 2026 | £383,750 | -32% |
2 Properties |
| 2025 | £506,863 | -4% |
113 Properties |
| 2024 | £528,114 | 1% |
142 Properties |
| 2023 | £523,367 | -11% |
105 Properties |
| 2022 | £578,614 | 18% |
116 Properties |
| 2021 | £476,300 | -2% |
190 Properties |
| 2020 | £488,162 | -12% |
169 Properties |
| 2019 | £544,317 | -10% |
235 Properties |
| 2018 | £600,768 | 1% |
159 Properties |
| 2017 | £597,588 | 20% |
127 Properties |
| 2016 | £478,717 | 17% |
166 Properties |
| 2015 | £396,528 | 8% |
126 Properties |
| 2014 | £364,502 | 3% |
176 Properties |
| 2013 | £353,617 | 11% |
149 Properties |
| 2012 | £314,870 | 6% |
139 Properties |
| 2011 | £296,493 | 5% |
109 Properties |
| 2010 | £281,646 | 0,3% |
144 Properties |
| 2009 | £280,896 | 1% |
82 Properties |
| 2008 | £277,123 | -1% |
97 Properties |
| 2007 | £280,666 | 9% |
252 Properties |
| 2006 | £254,642 | 9% |
269 Properties |
| 2005 | £231,918 | 1% |
202 Properties |
| 2004 | £228,960 | 2% |
226 Properties |
| 2003 | £224,696 | 12% |
264 Properties |
| 2002 | £198,203 | 15% |
260 Properties |
| 2001 | £168,033 | 14% |
241 Properties |
| 2000 | £145,102 | 10% |
258 Properties |
| 1999 | £130,976 | 11% |
191 Properties |
| 1998 | £117,149 | 22% |
190 Properties |
| 1997 | £90,796 | 6% |
177 Properties |
| 1996 | £85,337 | 11% |
273 Properties |
| 1995 | £76,230 | - |
283 Properties |
Property Price per Property Type in Isleworth
Here you can find historic sold price data in order to help with your property search.
The average Property Paid Price for specific property types in the last three years are:
| Property Type | Average Sold Price | Sold Properties |
|---|---|---|
| Flat | £355,781.00 | 171 Flats |
| Semi Detached House | £627,290.00 | 50 Semi Detached Houses |
| Detached House | £1,345,833.00 | 6 Detached Houses |
| Terraced House | £649,709.00 | 135 Terraced Houses |