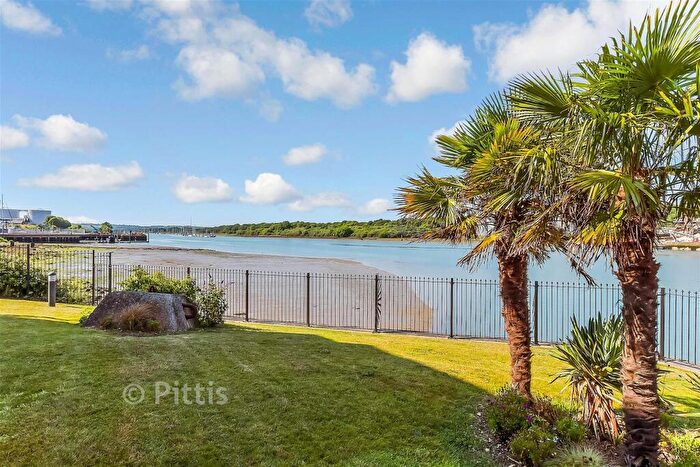
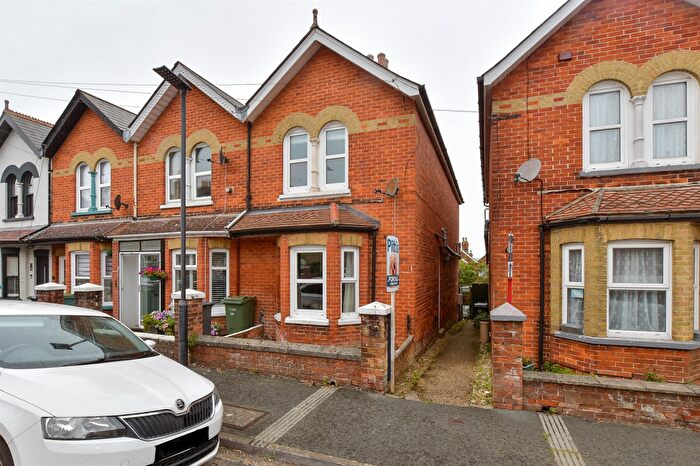
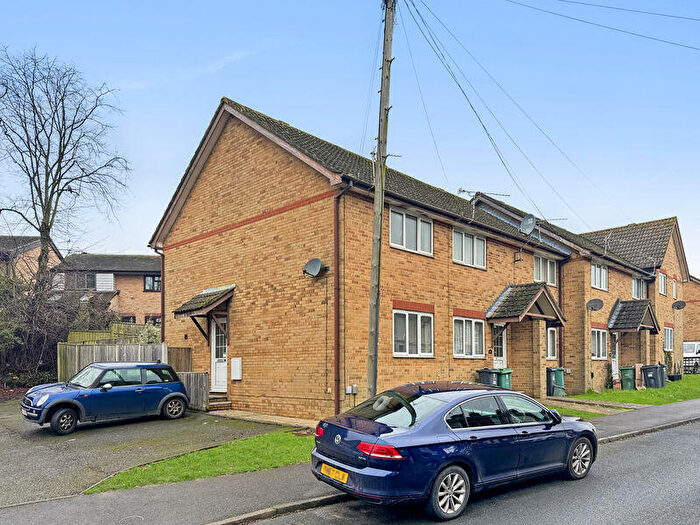
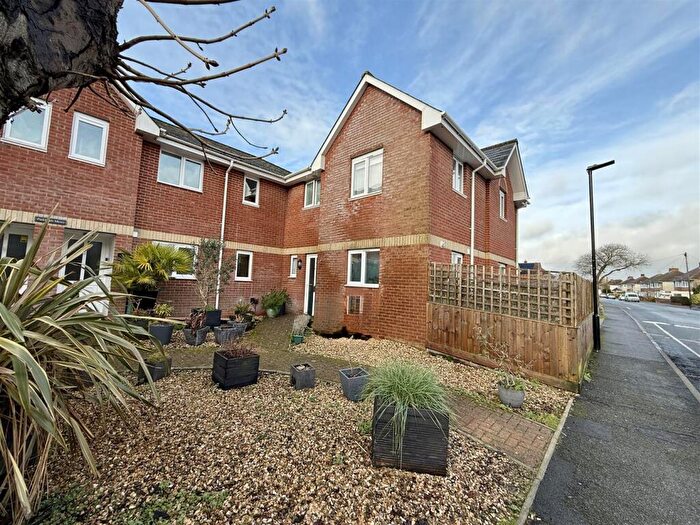
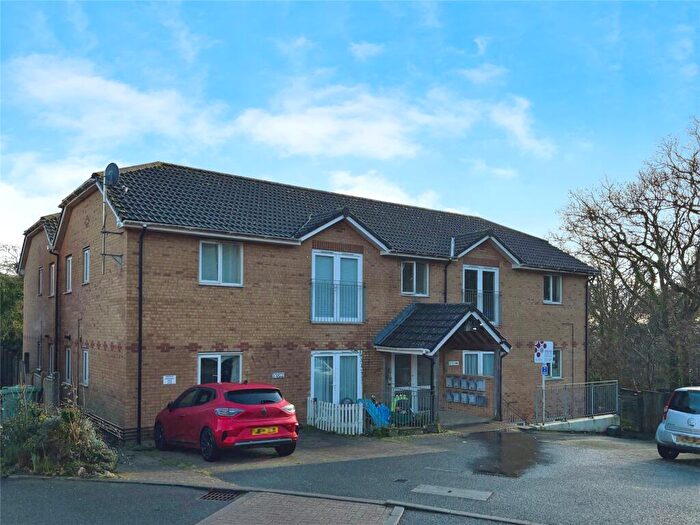
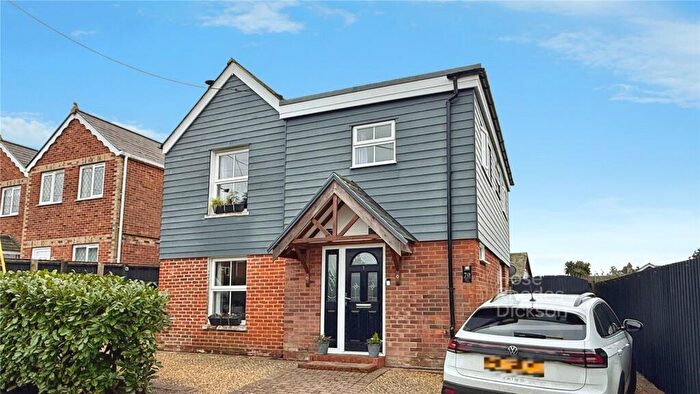
Houses for sale & to rent in Cowes, Isle of Wight
House Prices in Cowes
Properties in Cowes have an average house price of £343,546.00 and had 681 Property Transactions within the last 3 years.¹
Cowes is an area in Isle of Wight with 6,534 households², where the most expensive property was sold for £2,225,000.00.
Properties for sale in Cowes
Neighbourhoods in Cowes
Navigate through our locations to find the location of your next house in Cowes, Isle of Wight for sale or to rent.
Transport in Cowes
Please see below transportation links in this area:
-
Ryde Pier Head Station
-
Ryde Esplanade Station
-
Ryde St.John's Road Station
-
Smallbrook Junction Station
-
Hamble Station
-
Netley Station
-
Fareham Station
-
Swanwick Station
-
Bursledon Station
-
Brading Station
- FAQ
- Price Paid By Year
- Property Type Price
Frequently asked questions about Cowes
What is the average price for a property for sale in Cowes?
The average price for a property for sale in Cowes is £343,546. This amount is 16% higher than the average price in Isle of Wight. There are 3,039 property listings for sale in Cowes.
What locations have the most expensive properties for sale in Cowes?
The locations with the most expensive properties for sale in Cowes are Cowes West And Gurnard at an average of £465,509 and Cowes North at an average of £337,894.
What locations have the most affordable properties for sale in Cowes?
The locations with the most affordable properties for sale in Cowes are Cowes Medina at an average of £257,618 and Cowes South And Northwood at an average of £313,292.
Which train stations are available in or near Cowes?
Some of the train stations available in or near Cowes are Ryde Pier Head, Ryde Esplanade and Ryde St.John's Road.
Property Price Paid in Cowes by Year
The average sold property price by year was:
| Year | Average Sold Price | Price Change |
Sold Properties
|
|---|---|---|---|
| 2025 | £330,564 | -6% |
206 Properties |
| 2024 | £351,704 | 1% |
222 Properties |
| 2023 | £346,958 | 5% |
253 Properties |
| 2022 | £331,172 | 7% |
309 Properties |
| 2021 | £307,958 | 2% |
364 Properties |
| 2020 | £301,845 | 15% |
357 Properties |
| 2019 | £256,449 | -2% |
323 Properties |
| 2018 | £262,006 | 0,1% |
342 Properties |
| 2017 | £261,681 | 5% |
357 Properties |
| 2016 | £248,808 | 5% |
376 Properties |
| 2015 | £237,184 | -1% |
326 Properties |
| 2014 | £240,435 | 8% |
386 Properties |
| 2013 | £220,828 | 3% |
306 Properties |
| 2012 | £215,133 | -2% |
245 Properties |
| 2011 | £220,317 | 1% |
275 Properties |
| 2010 | £217,162 | 8% |
286 Properties |
| 2009 | £199,193 | -14% |
297 Properties |
| 2008 | £226,308 | 0,4% |
302 Properties |
| 2007 | £225,513 | 16% |
535 Properties |
| 2006 | £189,590 | 3% |
450 Properties |
| 2005 | £184,601 | 5% |
425 Properties |
| 2004 | £174,670 | 14% |
524 Properties |
| 2003 | £149,824 | 16% |
455 Properties |
| 2002 | £126,021 | 14% |
518 Properties |
| 2001 | £107,963 | 10% |
468 Properties |
| 2000 | £97,014 | 19% |
401 Properties |
| 1999 | £78,492 | 10% |
462 Properties |
| 1998 | £70,366 | 9% |
423 Properties |
| 1997 | £63,900 | 17% |
445 Properties |
| 1996 | £52,947 | -1% |
406 Properties |
| 1995 | £53,608 | - |
291 Properties |
Property Price per Property Type in Cowes
Here you can find historic sold price data in order to help with your property search.
The average Property Paid Price for specific property types in the last three years are:
| Property Type | Average Sold Price | Sold Properties |
|---|---|---|
| Semi Detached House | £306,044.00 | 190 Semi Detached Houses |
| Detached House | £529,659.00 | 185 Detached Houses |
| Terraced House | £269,160.00 | 181 Terraced Houses |
| Flat | £232,813.00 | 125 Flats |

