
Houses for sale in Isle of Wight, England
House Prices in Isle of Wight
Properties in Isle of Wight have
an average house price of
£295k
and had 6,830 Property Transactions
within the last 3 years.¹
Isle of Wight is a location in
England with
61,036 households², where the most expensive property was sold for £2.65M.
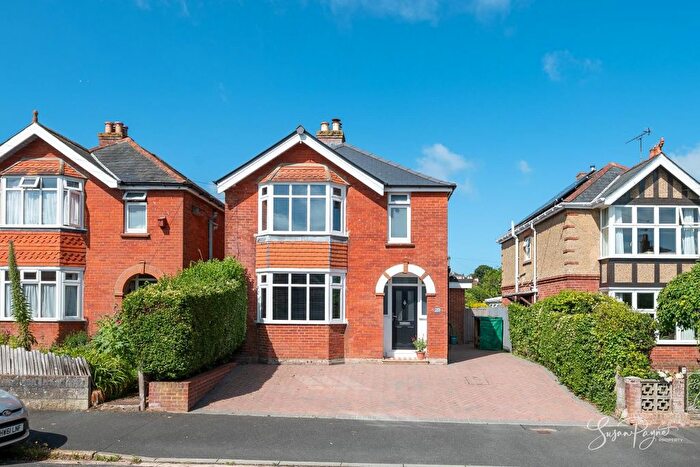
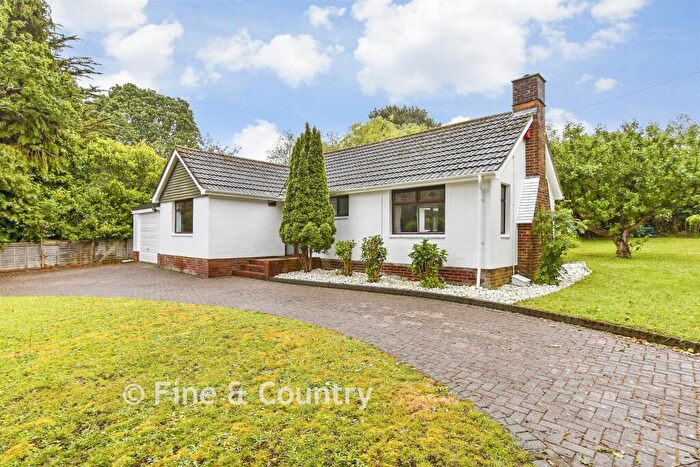
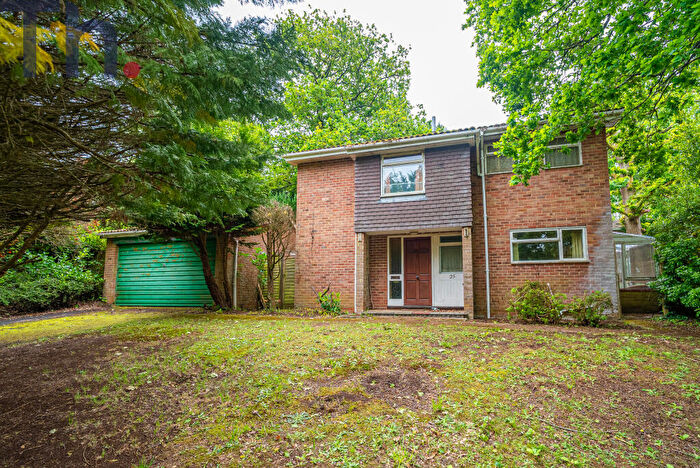
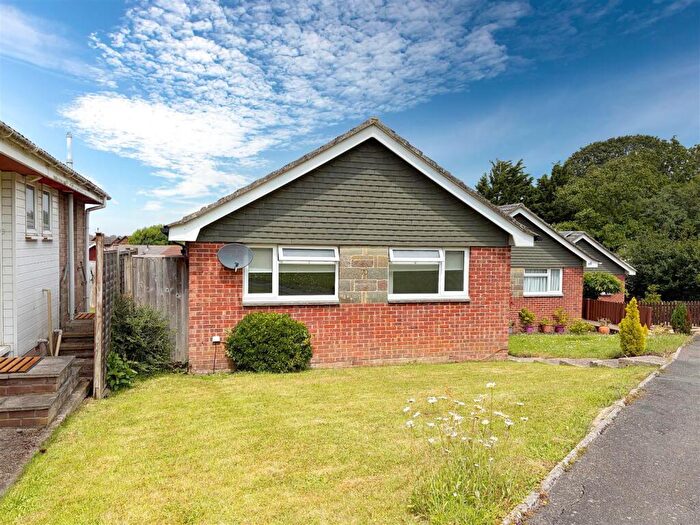
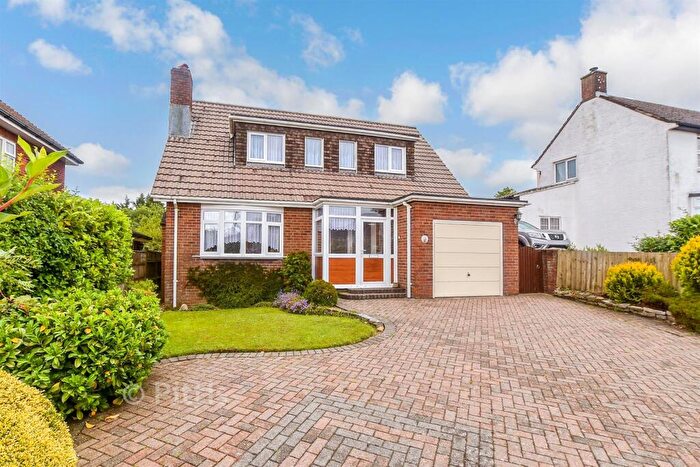
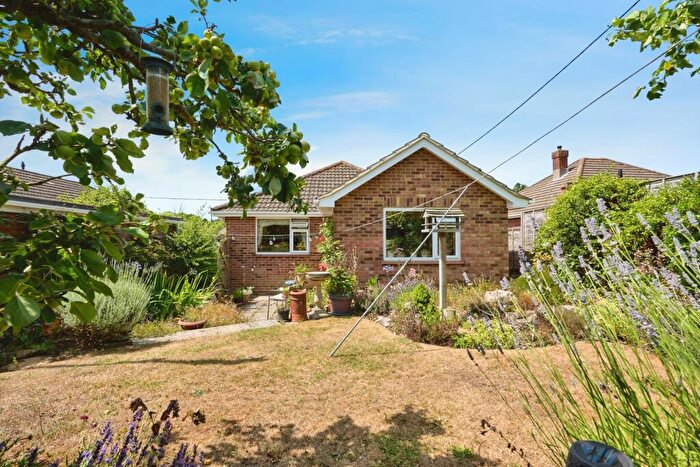
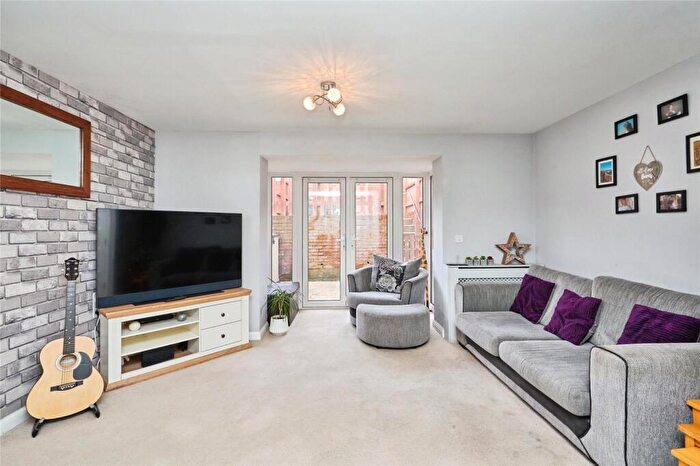
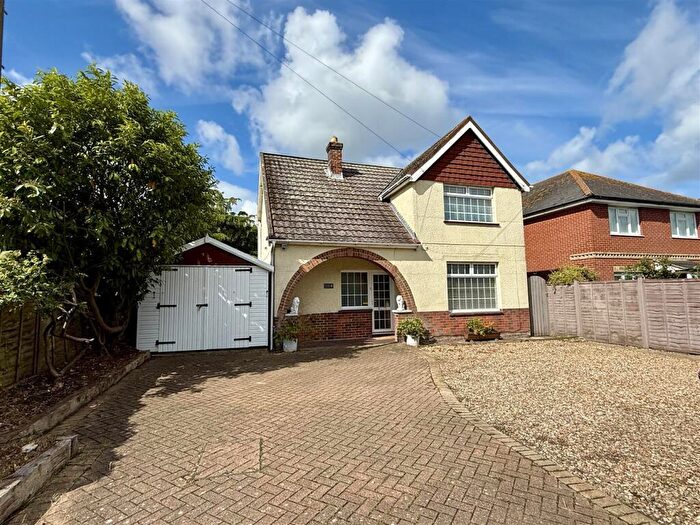
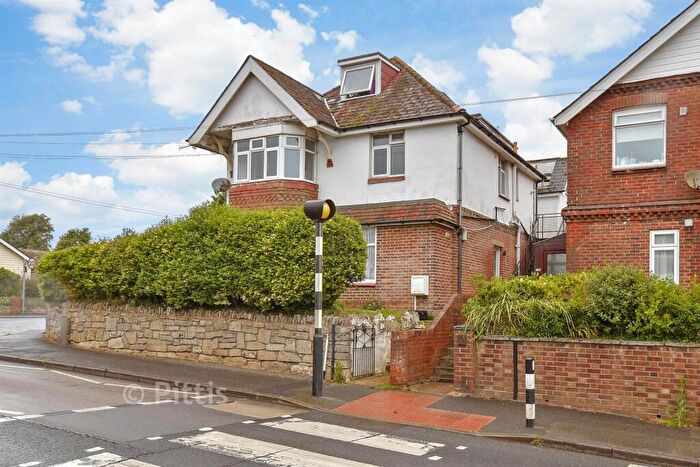
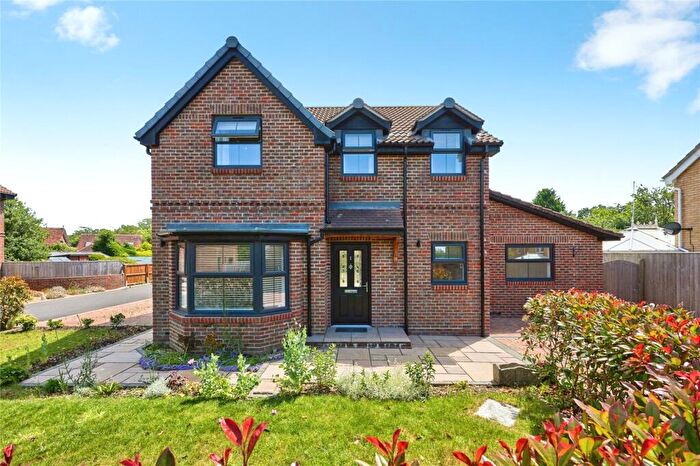
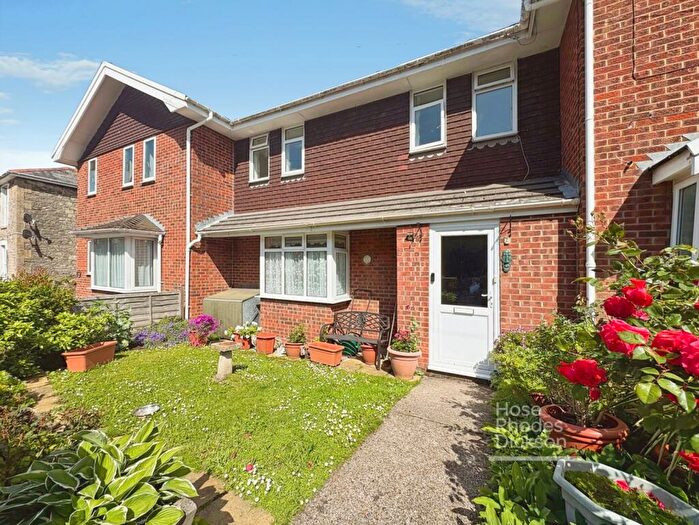
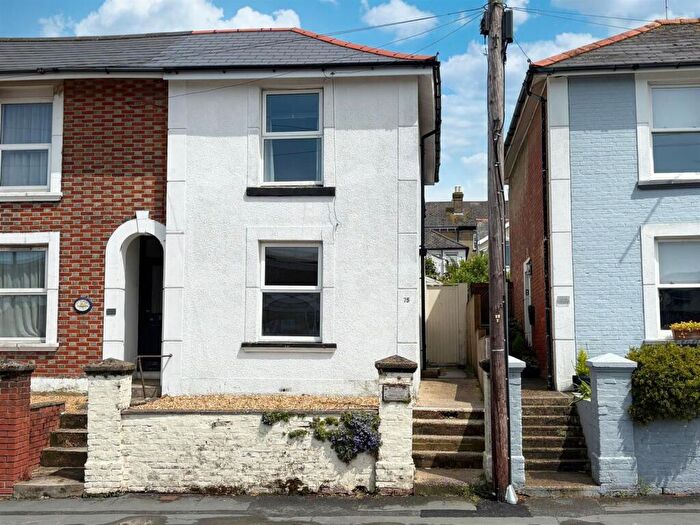
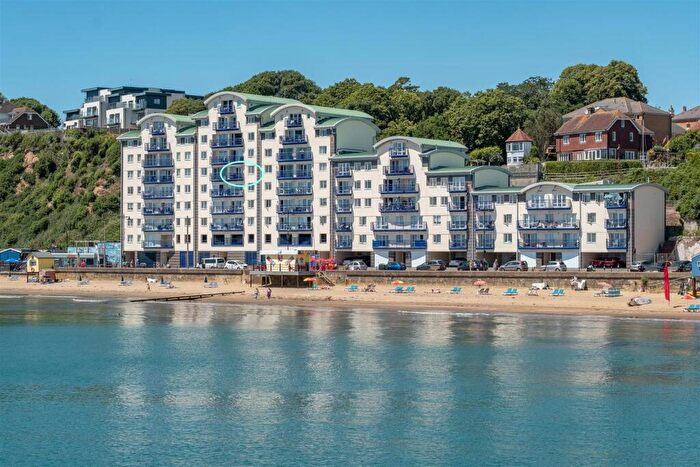
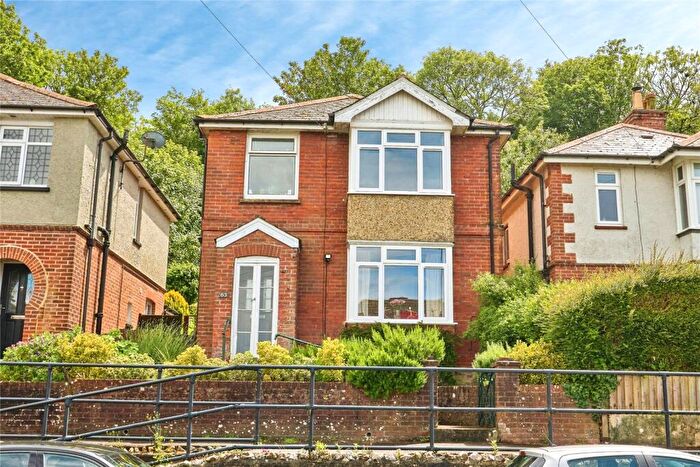
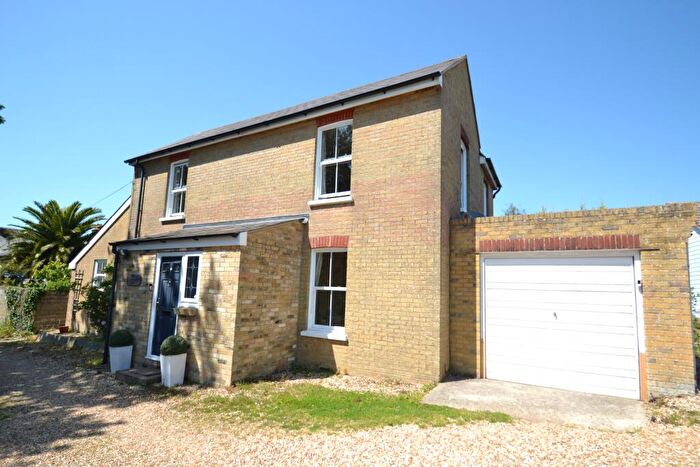
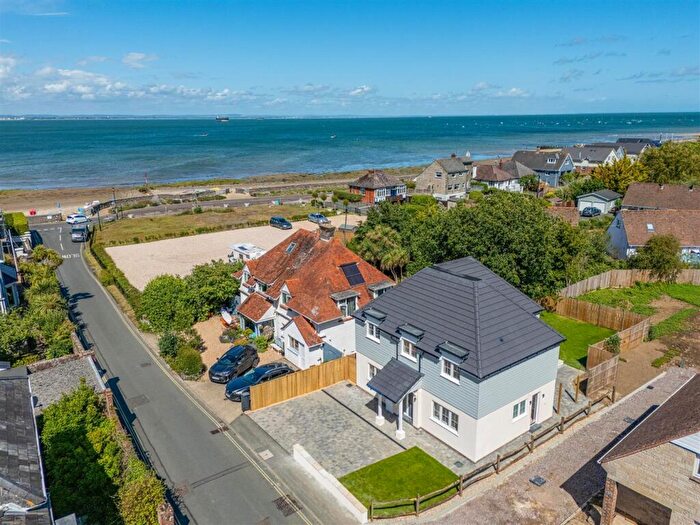
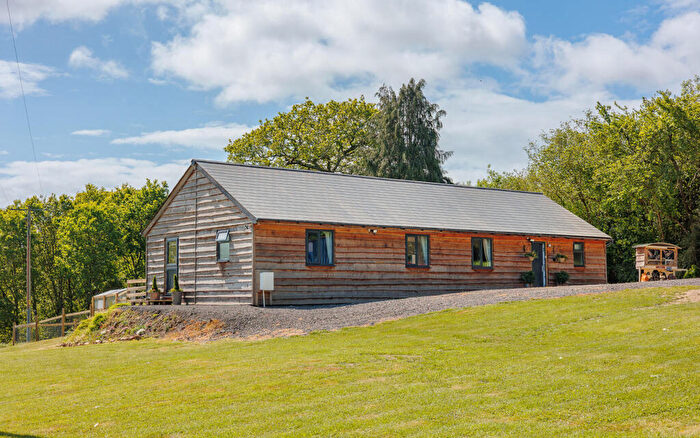
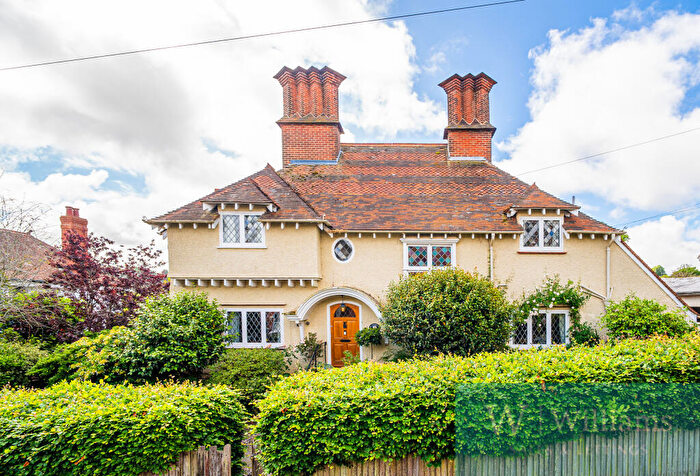
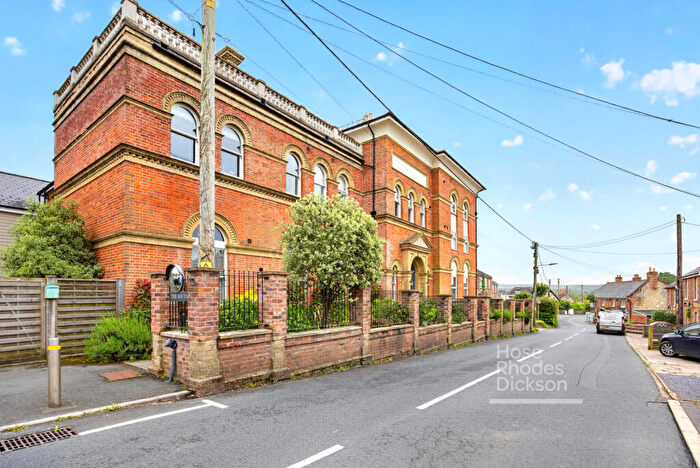
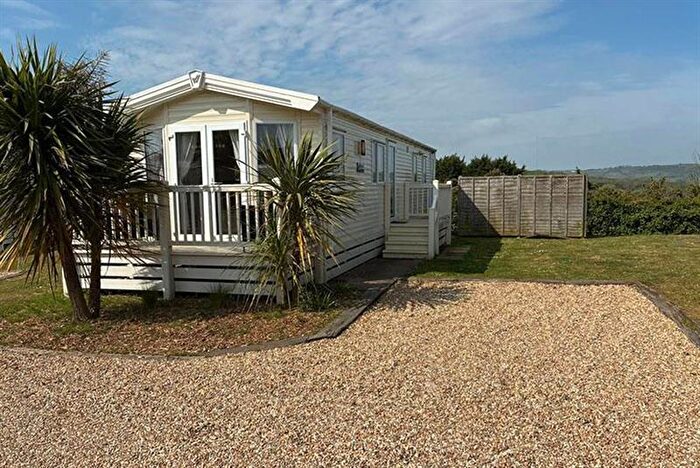
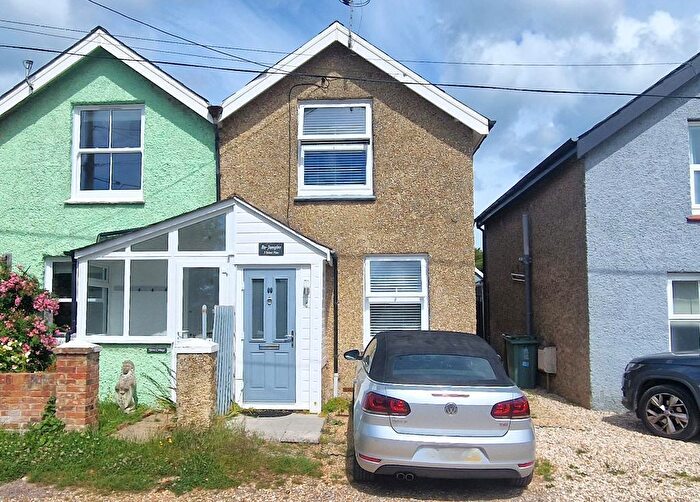
Properties for sale in Isle of Wight
![]()
If you are looking to sell your house, let it out, or receive a property valuation, an expert can help you.
Click the button below to get started.

Towns in Isle of Wight
Navigate through our locations to find the location of your next house in Isle of Wight, England for sale or to rent.
Property price trends in Isle of Wight
According to the latest Land Registry data, the average home in Isle of Wight sold for £269,666 in 2026. That figure comes from a substantial record of 97,252 sales logged over the past 31 years.
Prices have fallen back over the last three years. Compared with 2023, when the typical sale came in around £303,800, that's a fall of roughly 11.2%.
Looking back five years, average prices are down about 7.6% since 2021, a drop of around £22,057 in cash terms.
Zoom out to the past decade for the fuller picture. Back in 2016, homes here averaged £221,312, so the typical sold price has climbed about 21.8% since then, roughly 2% a year. Stretch the view to fifteen years and that annual pace holds at about 1.9%.
Frequently asked questions about Isle of Wight
What is the average price for a property for sale in Isle of Wight?
The average price for a property for sale in Isle of Wight is £295,096. This amount is 18% lower than the average price in England. There are more than 10,000 property listings for sale in Isle of Wight.
What locations have the most expensive properties for sale in Isle of Wight?
The locations with the most expensive properties for sale in Isle of Wight are Bembridge at an average of £491,922, Yarmouth at an average of £481,708 and Seaview at an average of £475,658.
What locations have the most affordable properties for sale in Isle of Wight?
The locations with the most affordable properties for sale in Isle of Wight are East Cowes at an average of £240,105, Newport at an average of £252,259 and Ryde at an average of £267,216.
Which train stations are available in or near Isle of Wight?
Some of the train stations available in or near Isle of Wight are Sandown, Smallbrook Junction and Lake.
Property Price Paid in Isle of Wight by Year
The average sold property price by year was:
| Year | Average Sold Price | Price Change |
Sold Properties
|
|---|---|---|---|
| 2026 | £269,666 | -7% |
337 Properties |
| 2025 | £289,507 | -2% |
2,128 Properties |
| 2024 | £295,842 | -3% |
2,203 Properties |
| 2023 | £303,800 | -1% |
2,162 Properties |
| 2022 | £306,628 | 5% |
2,840 Properties |
| 2021 | £291,723 | 8% |
3,586 Properties |
| 2020 | £267,694 | 10% |
2,735 Properties |
| 2019 | £241,327 | 2% |
2,885 Properties |
| 2018 | £236,639 | 4% |
2,953 Properties |
| 2017 | £228,095 | 3% |
3,311 Properties |
Property Price per Property Type in Isle of Wight
Here you can find historic sold price data in order to help with your property search.
The average Property Paid Price for specific property types in the last three years are:
| Property Type | Average Sold Price | Sold Properties |
|---|---|---|
| Semi Detached House | £274,598.00 | 1,845 Semi Detached Houses |
| Terraced House | £230,926.00 | 1,416 Terraced Houses |
| Detached House | £440,915.00 | 2,154 Detached Houses |
| Flat | £164,062.00 | 1,415 Flats |
Transport in Isle of Wight
Please see below transportation links in this area:
