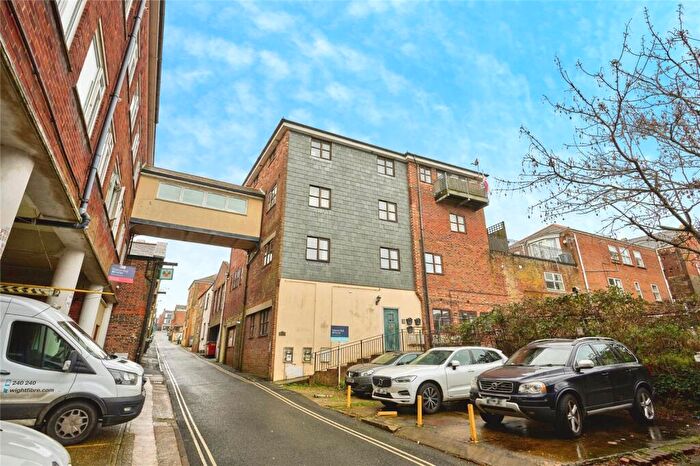
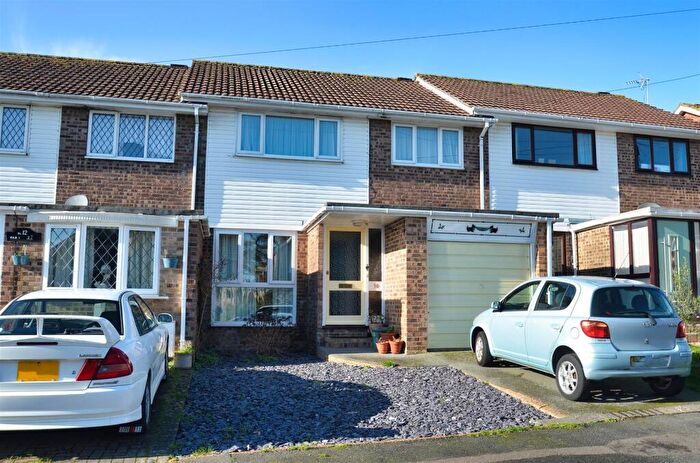
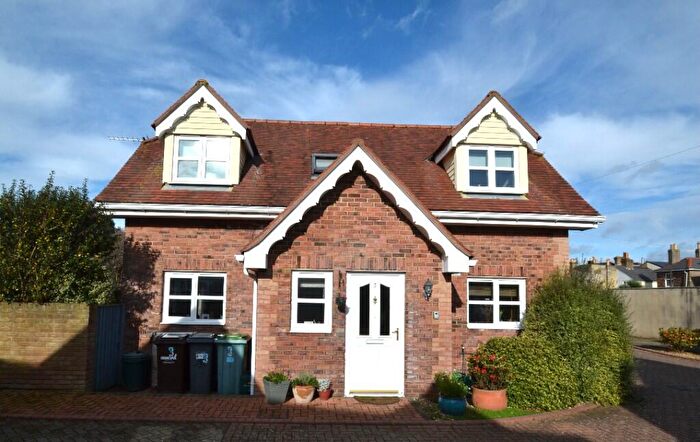
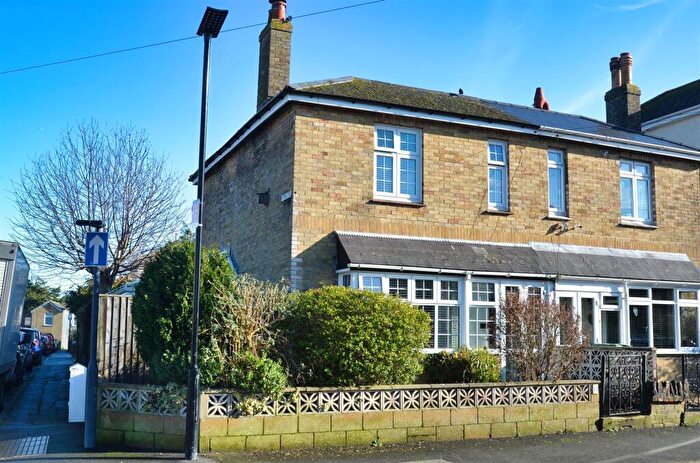
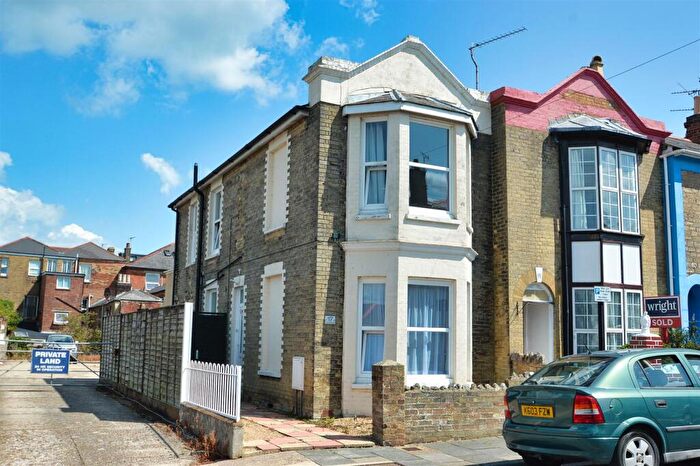
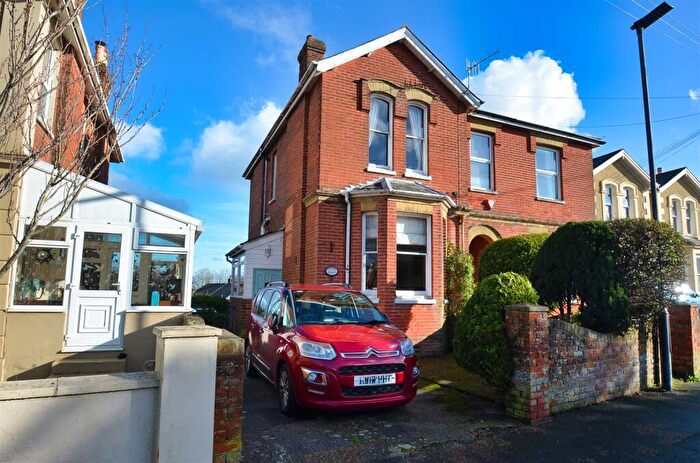
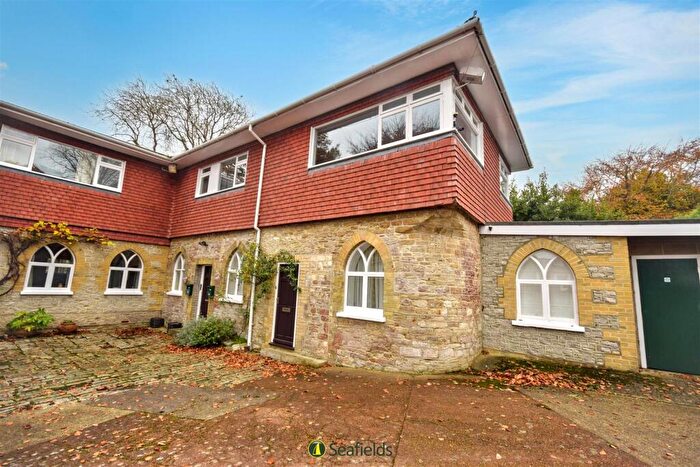
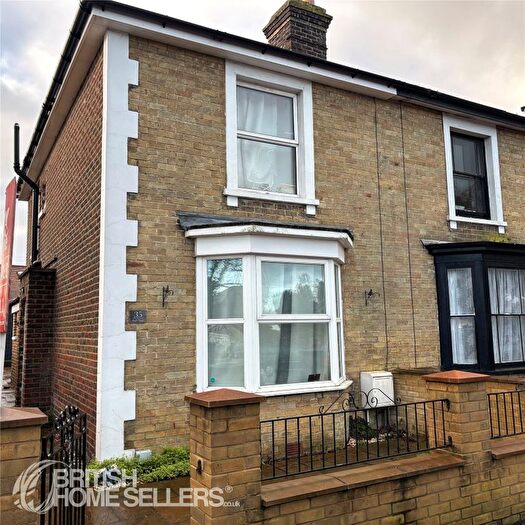
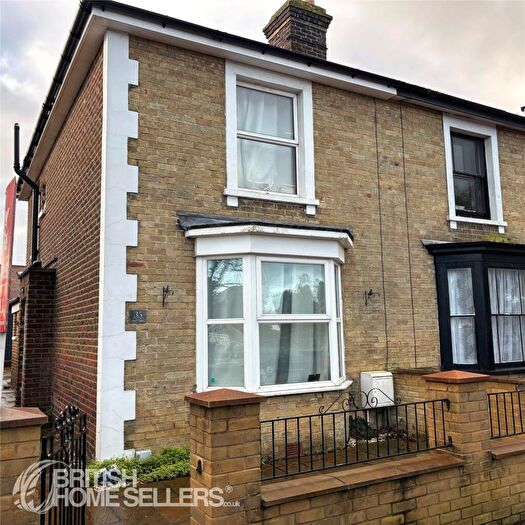
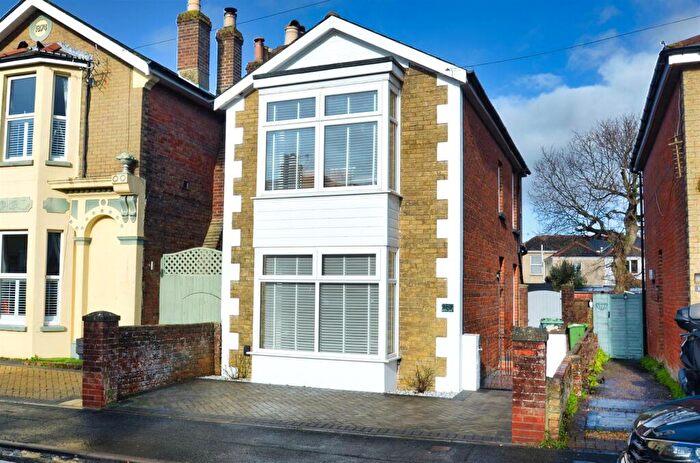
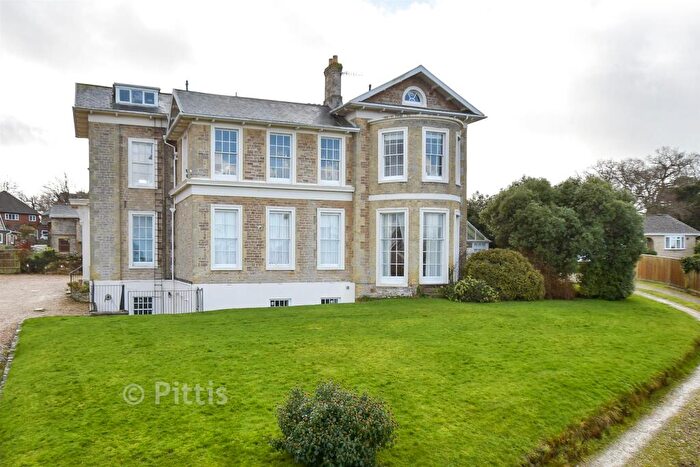
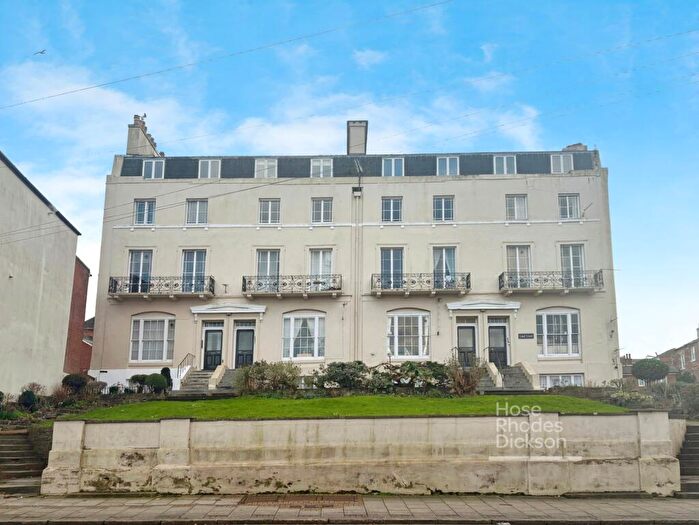
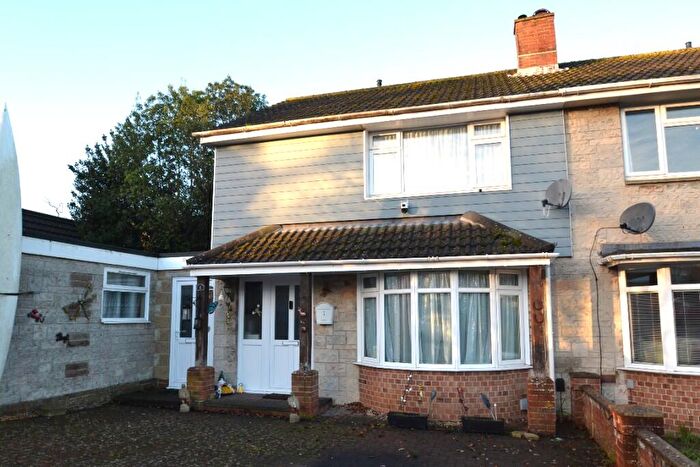
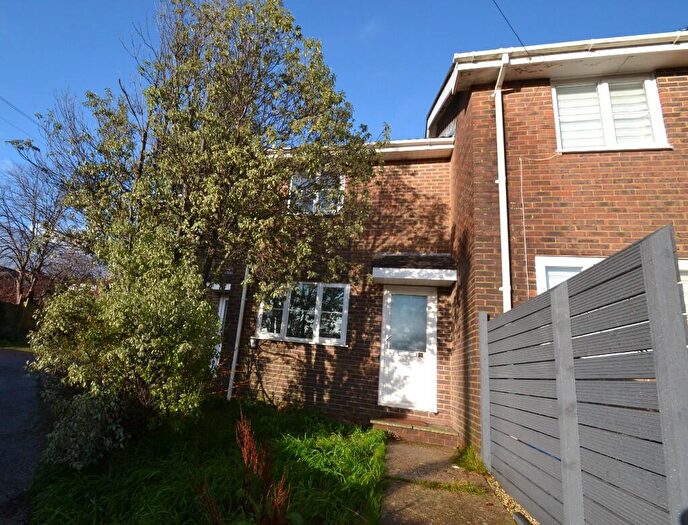
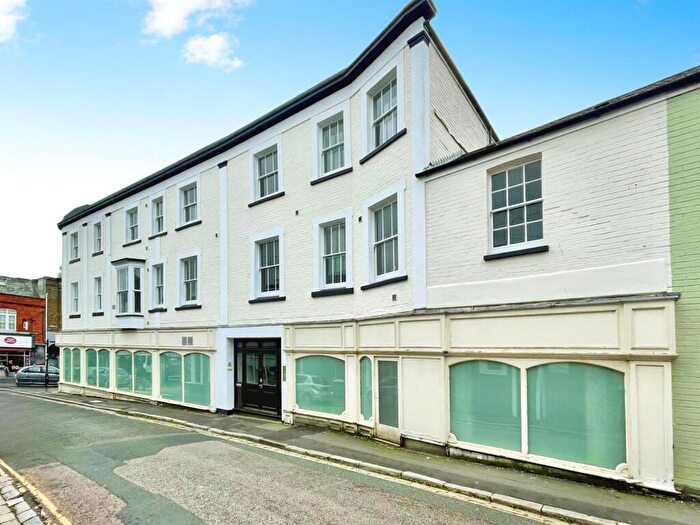
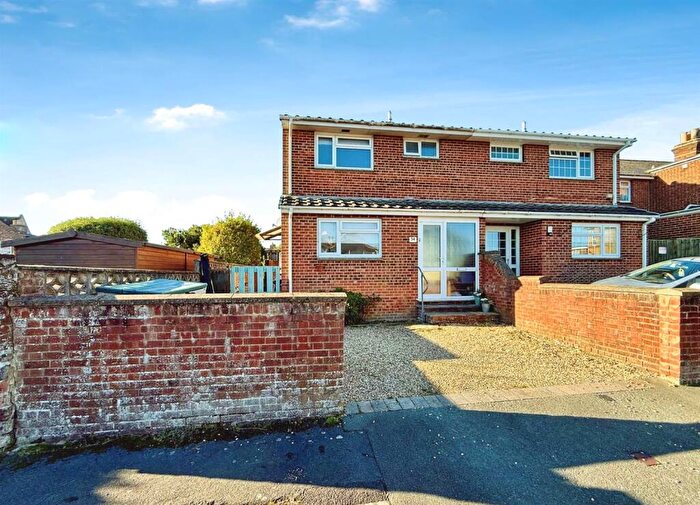
Houses for sale & to rent in Ryde West, Ryde
House Prices in Ryde West
Properties in Ryde West have an average house price of £236,109.00 and had 166 Property Transactions within the last 3 years¹.
Ryde West is an area in Ryde, Isle of Wight with 1,654 households², where the most expensive property was sold for £1,100,000.00.
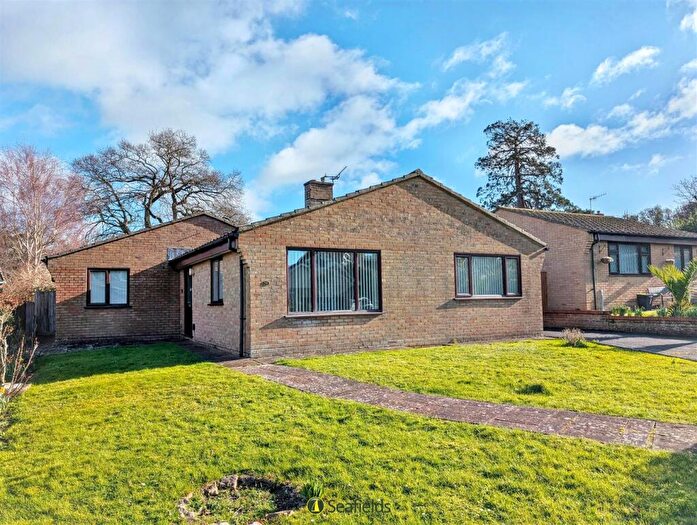
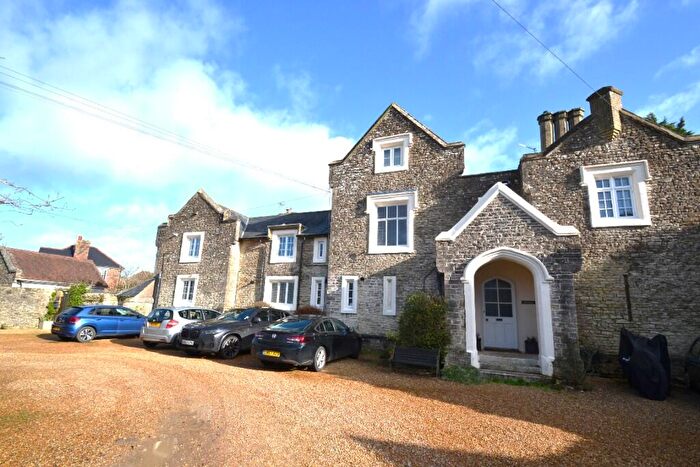
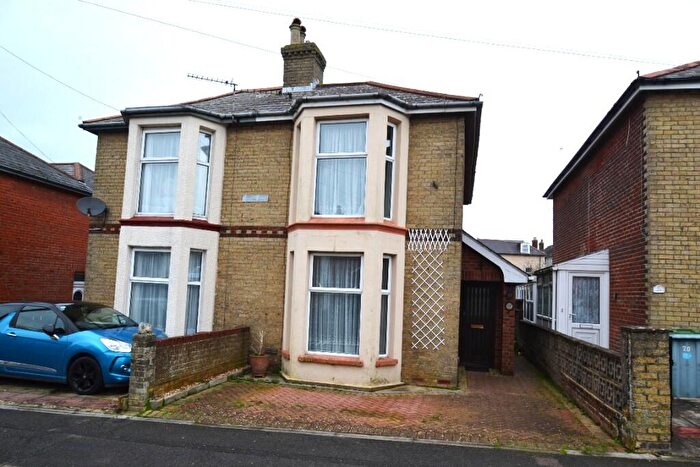
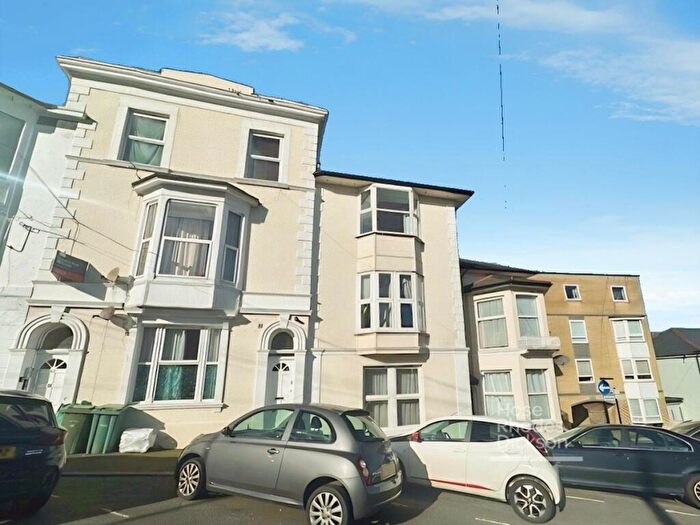
Properties for sale in Ryde West
Roads and Postcodes in Ryde West
Navigate through our locations to find the location of your next house in Ryde West, Ryde for sale or to rent.
| Streets | Postcodes |
|---|---|
| Adelaide Place | PO33 3DJ PO33 3DP PO33 3DG PO33 3DQ |
| Arthur Street | PO33 2QP |
| Bank Gardens | PO33 2SY |
| Bank Place | PO33 2TA |
| Beatrice Close | PO33 3PB |
| Binstead Road | PO33 3NA PO33 3NB PO33 3NJ PO33 3PD |
| Broadway Crescent | PO33 3QS PO33 3QT PO33 3QU PO33 3PU PO33 3PZ |
| Bucklers Drive | PO33 3DB |
| Coach House Lane | PO33 3LU |
| Corbett Road | PO33 3LE |
| Grange Avenue | PO33 3LS |
| Green Street | PO33 2QT |
| Hamilton Road | PO33 3QX PO33 3QY PO33 3QZ |
| High Street | PO33 2SU PO33 2SZ |
| Hill Street | PO33 2QN |
| Hillrise Avenue | PO33 3UH PO33 3UJ PO33 3UL |
| Jellicoe Close | PO33 3FB |
| Jellicoe Road | PO33 3NY PO33 3NZ |
| King George V Close | PO33 3DE |
| Maybrick Road | PO33 3PY |
| Mayfield Road | PO33 3PP PO33 3PR |
| Meadowbrook | PO33 3NN |
| Milligan Road | PO33 2QW |
| Mountbatten Drive | PO33 3LR |
| Nelson Crescent | PO33 3QN |
| Nursery Gardens | PO33 2DF |
| Osborne Close | PO33 2AY |
| Osborne Road | PO33 2FB PO33 2TH |
| Partlands Avenue | PO33 3DS |
| Partlands Close | PO33 2UB |
| Pell Lane | PO33 3LL PO33 3LN PO33 3LT PO33 3LW |
| Pellhurst Road | PO33 3BN PO33 3BP PO33 3BS PO33 3BW PO33 3DR PO33 3DT |
| Playstreet Lane | PO33 3LG PO33 3LJ PO33 3LQ |
| Pound Mead | PO33 3HH |
| Ratcliffe Avenue | PO33 3DN PO33 3DW |
| Ringwood Road | PO33 3NU PO33 3NX PO33 3PA |
| Sherbourne Avenue | PO33 3PW PO33 3PX |
| Sovereign Way | PO33 3DL |
| St Vincents Road | PO33 3PS PO33 3PT |
| Stonelands Park | PO33 3BD |
| Sun Place | PO33 2TB |
| Swanmore Road | PO33 2FP PO33 2TE PO33 2TG PO33 2TQ PO33 2FD |
| Tandy Close | PO33 3LP |
| Tennyson Close | PO33 3QB |
| The Orchards | PO33 3DU |
| Trafalgar Drive | PO33 3QW |
| Upton Road | PO33 3HF |
| Victory Close | PO33 3RA |
| Waterloo Crescent | PO33 3QP |
| Weeks Road | PO33 2TJ PO33 2TL PO33 2TP |
| Wellington Road | PO33 3QH PO33 3QJ PO33 3QL PO33 3QR |
| West Street | PO33 2PQ PO33 2QF PO33 2UH PO33 2FT PO33 2UG PO33 2UQ PO33 2US |
| Windsor Mews | PO33 2QX |
| Winston Avenue | PO33 3QE PO33 3QG PO33 3QQ |
| Winston Close | PO33 3QF |
Transport near Ryde West
-
Ryde St.John's Road Station
-
Ryde Esplanade Station
-
Ryde Pier Head Station
-
Smallbrook Junction Station
- FAQ
- Price Paid By Year
- Property Type Price
Frequently asked questions about Ryde West
What is the average price for a property for sale in Ryde West?
The average price for a property for sale in Ryde West is £236,109. This amount is 12% lower than the average price in Ryde. There are 1,442 property listings for sale in Ryde West.
What streets have the most expensive properties for sale in Ryde West?
The streets with the most expensive properties for sale in Ryde West are King George V Close at an average of £430,000, Pellhurst Road at an average of £397,416 and Mayfield Road at an average of £362,166.
What streets have the most affordable properties for sale in Ryde West?
The streets with the most affordable properties for sale in Ryde West are High Street at an average of £95,714, Tandy Close at an average of £114,375 and Green Street at an average of £128,687.
Which train stations are available in or near Ryde West?
Some of the train stations available in or near Ryde West are Ryde St.John's Road, Ryde Esplanade and Ryde Pier Head.
Property Price Paid in Ryde West by Year
The average sold property price by year was:
| Year | Average Sold Price | Price Change |
Sold Properties
|
|---|---|---|---|
| 2025 | £208,876 | -18% |
51 Properties |
| 2024 | £246,055 | -2% |
59 Properties |
| 2023 | £250,432 | -3% |
56 Properties |
| 2022 | £258,183 | 8% |
58 Properties |
| 2021 | £237,622 | 12% |
107 Properties |
| 2020 | £208,365 | -1% |
49 Properties |
| 2019 | £209,687 | 0,2% |
63 Properties |
| 2018 | £209,234 | 13% |
47 Properties |
| 2017 | £181,463 | -1% |
68 Properties |
| 2016 | £182,623 | -2% |
78 Properties |
| 2015 | £186,996 | 6% |
72 Properties |
| 2014 | £175,116 | 4% |
75 Properties |
| 2013 | £168,846 | 4% |
64 Properties |
| 2012 | £162,648 | 0,5% |
56 Properties |
| 2011 | £161,903 | 7% |
61 Properties |
| 2010 | £150,336 | 10% |
57 Properties |
| 2009 | £135,742 | -32% |
67 Properties |
| 2008 | £178,790 | -1% |
40 Properties |
| 2007 | £181,402 | 6% |
105 Properties |
| 2006 | £170,498 | 11% |
130 Properties |
| 2005 | £152,363 | 1% |
81 Properties |
| 2004 | £151,539 | 11% |
83 Properties |
| 2003 | £134,755 | 24% |
96 Properties |
| 2002 | £102,072 | 19% |
80 Properties |
| 2001 | £82,248 | 10% |
95 Properties |
| 2000 | £73,834 | 8% |
104 Properties |
| 1999 | £67,744 | 10% |
94 Properties |
| 1998 | £60,908 | -0,2% |
85 Properties |
| 1997 | £61,017 | 16% |
84 Properties |
| 1996 | £51,473 | 14% |
75 Properties |
| 1995 | £44,076 | - |
40 Properties |
Property Price per Property Type in Ryde West
Here you can find historic sold price data in order to help with your property search.
The average Property Paid Price for specific property types in the last three years are:
| Property Type | Average Sold Price | Sold Properties |
|---|---|---|
| Semi Detached House | £244,012.00 | 75 Semi Detached Houses |
| Detached House | £342,574.00 | 31 Detached Houses |
| Terraced House | £195,128.00 | 37 Terraced Houses |
| Flat | £132,769.00 | 23 Flats |

