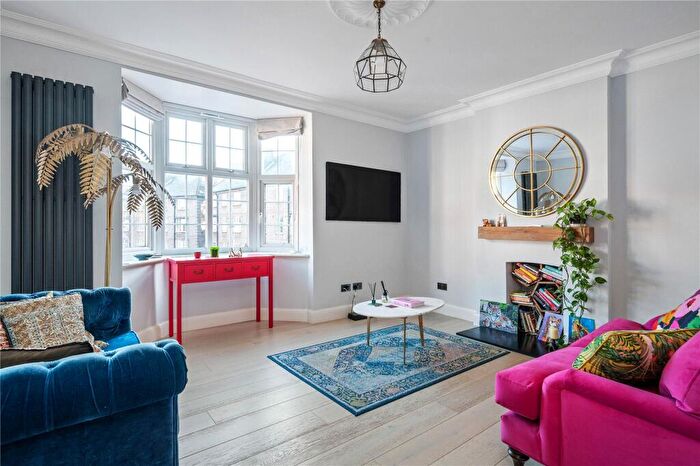
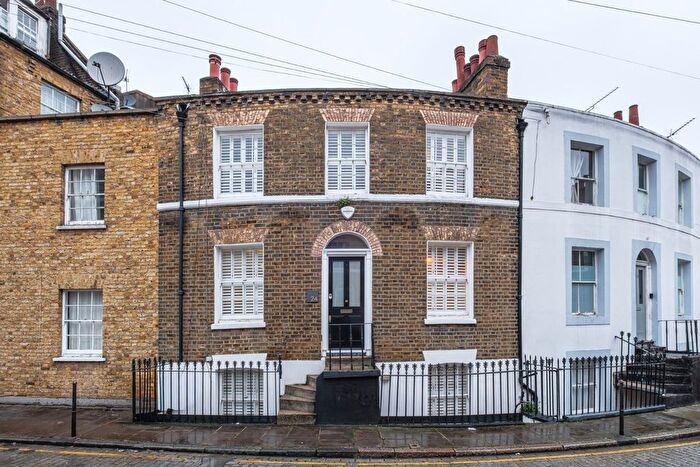
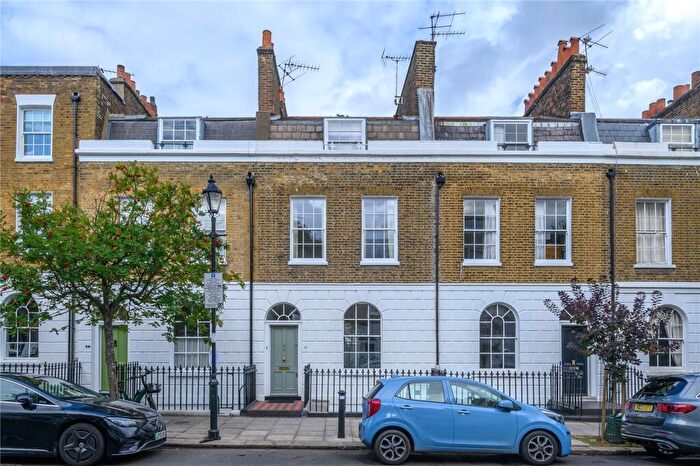
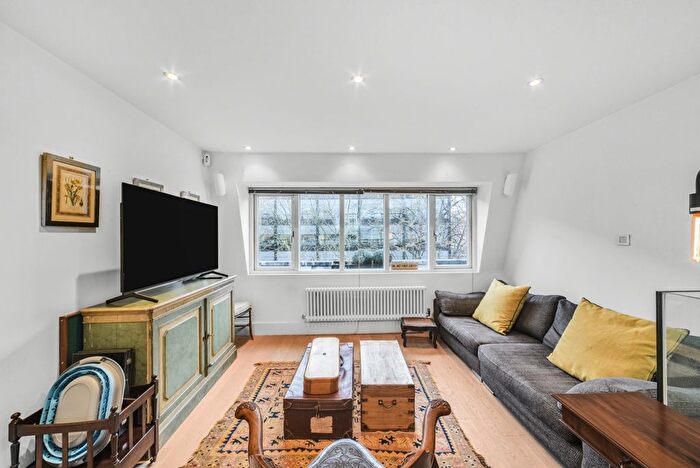
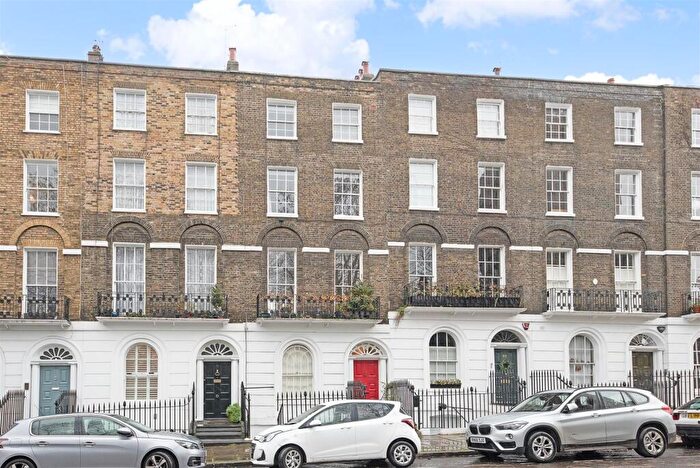
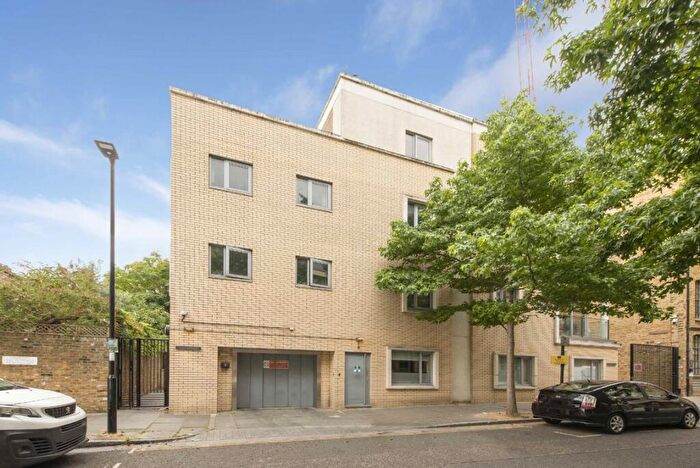
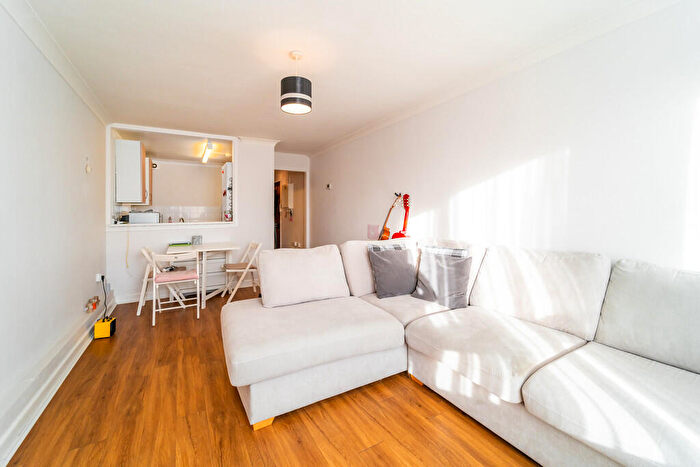
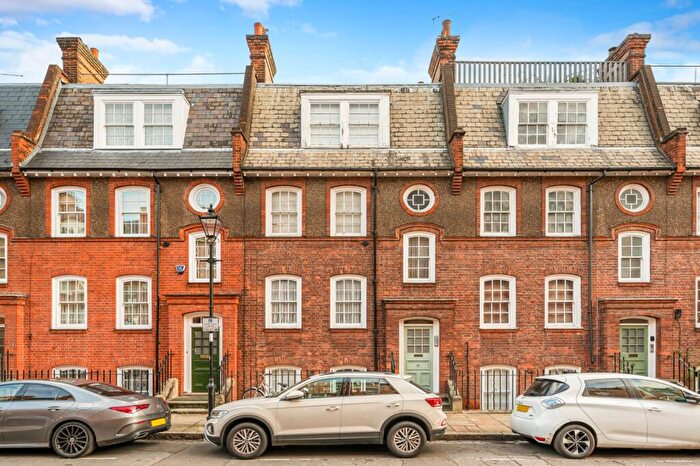
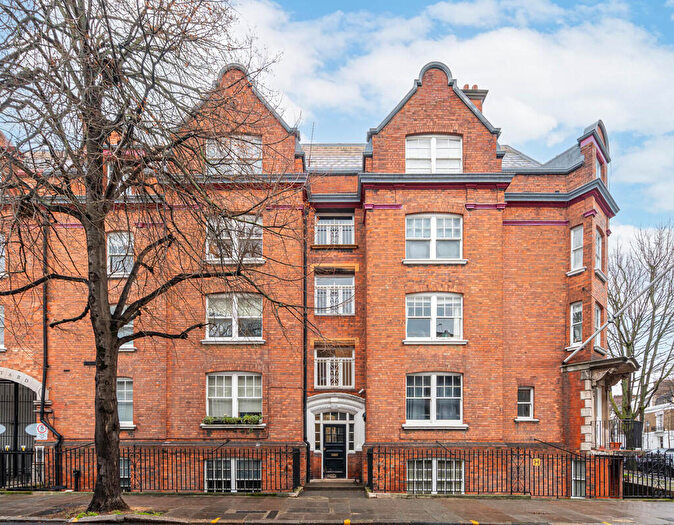
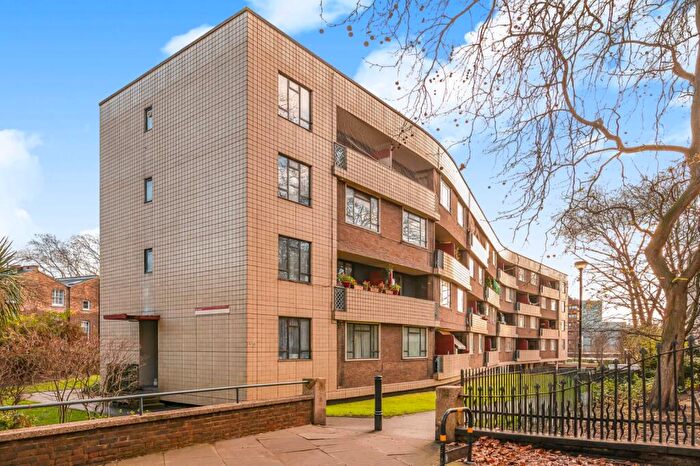
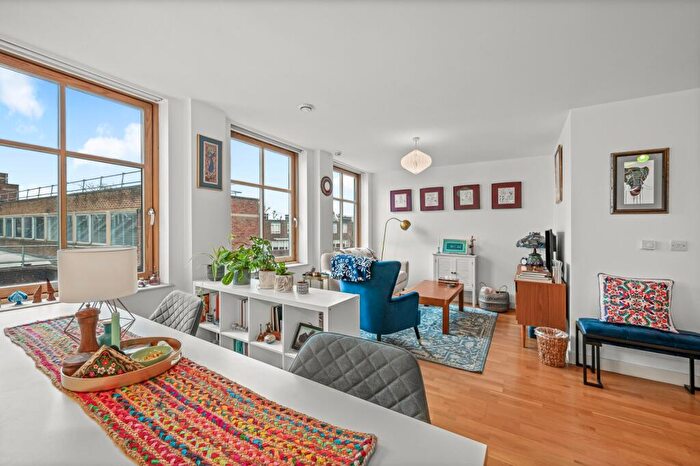
Houses for sale & to rent in Barnsbury, London
House Prices in Barnsbury
Properties in this part of Barnsbury within London have an average house price of £1,043,289.00 and had 467 Property Transactions within the last 3 years¹. This area has 5,539 households² , where the most expensive property was sold for £6,700,000.00.
Properties for sale in Barnsbury
Roads and Postcodes in Barnsbury
Navigate through our locations to find the location of your next house in Barnsbury, London for sale or to rent.
| Streets | Postcodes |
|---|---|
| Albany Mews | N1 1LD |
| Albion Mews | N1 1JX |
| Angel Mews | N1 9HH |
| Aran Mews | N7 8BF |
| Arundel Place | N1 1LS |
| Augustas Lane | N1 1QT |
| Barnsbury Estate | N1 0HE N1 0HF N1 0JF N1 0JG N1 0JJ N1 0JL N1 0JQ N1 0SD N1 0SE N1 0SH N1 0SJ N1 0TR N1 0TS N1 0TX N1 0TY N1 0TZ N1 0UB N1 0UD N1 0UE |
| Barnsbury Grove | N7 8BP |
| Barnsbury Park | N1 1HH N1 1HQ |
| Barnsbury Road | N1 0EP N1 0ER N1 0ES N1 0HB N1 0HD N1 0EX N1 0HA N1 0HG |
| Barnsbury Square | N1 1JL N1 1JP N1 1RN |
| Barnsbury Street | N1 1EJ N1 1EP N1 1ER |
| Barnsbury Terrace | N1 1JH |
| Baron Close | N1 9EU |
| Baron Street | N1 9ES N1 9ET N1 9HP N1 9LL |
| Batchelor Street | N1 0EG N1 0EY |
| Beech Tree Close | N1 1LB |
| Belitha Villas | N1 1PD N1 1PE |
| Bewdley Street | N1 1HB N1 1HD N1 1HG |
| Blackthorn Avenue | N7 8AH N7 8AJ N7 8AQ N7 8AW N7 8BD N7 8AG |
| Boxworth Grove | N1 0NL |
| Bradley's Close | N1 9PN |
| Brayfield Terrace | N1 1HZ |
| Brooksby Mews | N1 1EZ |
| Brooksby Street | N1 1EX N1 1HA N1 1HE N1 1HF |
| Caledonian Road | N1 9UU N1 9RD N1 0SQ |
| Calshot Street | N1 9DJ N1 9JW N1 9AU N1 9DA |
| Carfree Close | N1 1XW |
| Carnegie Street | N1 9QW |
| Chalbury Walk | N1 9SY |
| Chapel Market | N1 9EN N1 9ER N1 9EX N1 9EY N1 9EZ N1 9EW |
| Charlotte Terrace | N1 0FB N1 0TT N1 0TU |
| Cloudesley Place | N1 0ED N1 0JA N1 0JP N1 0HZ |
| Cloudesley Road | N1 0EA N1 0EB N1 0EF N1 0EL N1 0EN N1 0EQ N1 0FH |
| Cloudesley Square | N1 0HN N1 0HS N1 0HT |
| Cloudesley Street | N1 0HU N1 0HX |
| Collier Street | N1 9DF N1 9JU N1 9QZ |
| Copenhagen Street | N1 0FL N1 0JB N1 0JD N1 0JE N1 0JN N1 0JW N1 0SB N1 0JH |
| Cumming Street | N1 9HW N1 9JA |
| Cynthia Street | N1 9FU N1 9JF |
| Denmark Grove | N1 0XX N1 0XY N1 0XZ |
| Dewey Road | N1 0XU |
| Dignum Street | N1 0FJ |
| Donegal Street | N1 9QD N1 9QF N1 9QE N1 9QG N1 9QT |
| Doves Yard | N1 0HQ |
| Dowrey Street | N1 0HY |
| Drummond Way | N1 1NR |
| Eckford Street | N1 9ST |
| Elystan Walk | N1 0HJ |
| Epping Place | N1 1GB |
| Ferriby Close | N1 1XN |
| Fife Terrace | N1 9RA |
| Gifford Street | N1 0FA |
| Gissing Walk | N1 1HL |
| Godson Street | N1 9GZ |
| Granary Square | N1 1FA |
| Hadrian Mews | N7 8XA |
| Half Moon Crescent | N1 9SS N1 0TJ |
| Hemingford Road | N1 1DB N1 1DD N1 1DE N1 1DF N1 0JU |
| Hermes Street | N1 9JD |
| Islington High Street | N1 9LQ N1 9LH N1 9LJ N1 9TP N1 9TR |
| Islington Place | N1 0ET |
| Jays Street | N1 0FE |
| Joseph Mews | N7 8FA |
| Lambert Street | N1 1JE |
| Langford Mews | N1 1NA |
| Legion Close | N1 1PJ |
| Leirum Street | N1 0TN |
| Liverpool Road | N1 1LX N1 1NF N1 1NH N1 1NJ N1 1NL N1 1NP N1 1NQ N1 1NW N1 1NE N1 1NG N1 0RF N1 0RG N1 0RH N1 0RQ N1 0RT N1 0RJ N1 0RP N1 0RR N1 0RW |
| Lofting Road | N1 1ET N1 1JA N1 1JB N1 1JD N1 1JF N1 1JQ N1 1ES N1 1HP |
| Lonsdale Place | N1 1EL |
| Lonsdale Square | N1 1EN N1 1EW |
| Malvern Terrace | N1 1HR |
| Maygood Street | N1 9QP N1 9QR |
| Morland Mews | N1 1HN |
| Mountfort Crescent | N1 1JW |
| Mountfort Terrace | N1 1JJ |
| Muriel Street | N1 9QU N1 0SF N1 0TH |
| Offord Road | N1 1LR N1 1NS N1 1NT N1 1NX N1 1NY N1 1PF N1 1PG N1 1PQ N1 1NU N1 1PH |
| Penton Grove | N1 9JX |
| Penton Street | N1 9PS N1 9PT N1 9PX N1 9PY N1 9QA N1 9PZ N1 9UL |
| Pentonville Road | N1 9FH N1 9HF N1 9HJ N1 9JB N1 9JL N1 9JP N1 9PR N1 9BY N1 9FT N1 9FW N1 9HS N1 9JE N1 9LA N1 9TT |
| Priory Green | N1 9DD N1 9DE N1 9QH N1 9QJ N1 9QQ N1 9AT |
| Priory Green Estate | N1 9DH N1 9DG N1 9DQ |
| Pultney Street | N1 0TP N1 0TW |
| Richmond Avenue | N1 0LL N1 0LR N1 0LS N1 0LT N1 0LU N1 0LX N1 0NA |
| Richmond Crescent | N1 0LY N1 0LZ |
| Ripplevale Grove | N1 1HS N1 1HT N1 1HU |
| Risinghill Street | N1 9QB |
| Ritchie Street | N1 0EH N1 0DG N1 0FG |
| Rodney Street | N1 9FR N1 9FS N1 9JH |
| Roman Way | N7 8XG |
| St Clements Street | N7 8BG N7 8BQ |
| Stonefield Street | N1 0HP N1 0HW |
| The Courtyard | N1 1JZ |
| Thornhill Grove | N1 1JG |
| Thornhill Road | N1 1AU N1 1HW N1 1HX N1 1JR N1 1JS N1 1JT N1 1JU N1 1JY N1 1PA N1 1PB |
| Tolpuddle Street | N1 0XT N1 0YY |
| Westbourne Road | N7 8AR N7 8AF |
| White Conduit Street | N1 9EL N1 9HA |
| White Lion Street | N1 9PF N1 9PG N1 9PH N1 9PP N1 9PW N1 9PD |
| Wynford Road | N1 9QN N1 9SN N1 9SW N1 9TX N1 9TY N1 9TZ N1 9SG N1 9SL N1 9SP |
| York Way | N1 9FX |
Transport near Barnsbury
-
Angel Station
-
Caledonian Road and Barnsbury Station
-
King's Cross Station
-
Essex Road Station
-
Highbury and Islington Station
-
Kings Cross St. Pancras Station
-
St.Pancras Station
-
St Pancras Station
-
Caledonian Road Station
-
Holloway Road Station
- FAQ
- Price Paid By Year
- Property Type Price
Frequently asked questions about Barnsbury
What is the average price for a property for sale in Barnsbury?
The average price for a property for sale in Barnsbury is £1,043,289. This amount is 24% higher than the average price in London. There are 6,364 property listings for sale in Barnsbury.
What streets have the most expensive properties for sale in Barnsbury?
The streets with the most expensive properties for sale in Barnsbury are Lonsdale Square at an average of £3,160,900, Ripplevale Grove at an average of £2,431,042 and Arundel Place at an average of £2,160,000.
What streets have the most affordable properties for sale in Barnsbury?
The streets with the most affordable properties for sale in Barnsbury are Calshot Street at an average of £365,833, Chalbury Walk at an average of £417,500 and Collier Street at an average of £440,000.
Which train stations are available in or near Barnsbury?
Some of the train stations available in or near Barnsbury are Caledonian Road and Barnsbury, King's Cross and Essex Road.
Which tube stations are available in or near Barnsbury?
Some of the tube stations available in or near Barnsbury are Angel, Highbury and Islington and Kings Cross St. Pancras.
Property Price Paid in Barnsbury by Year
The average sold property price by year was:
| Year | Average Sold Price | Price Change |
Sold Properties
|
|---|---|---|---|
| 2025 | £908,415 | -6% |
61 Properties |
| 2024 | £966,345 | -3% |
154 Properties |
| 2023 | £995,199 | -23% |
113 Properties |
| 2022 | £1,226,821 | 24% |
139 Properties |
| 2021 | £935,355 | -7% |
195 Properties |
| 2020 | £1,002,381 | 4% |
82 Properties |
| 2019 | £961,754 | -6% |
135 Properties |
| 2018 | £1,023,268 | -2% |
204 Properties |
| 2017 | £1,047,760 | 1% |
100 Properties |
| 2016 | £1,035,116 | 9% |
123 Properties |
| 2015 | £947,045 | 8% |
144 Properties |
| 2014 | £871,701 | 22% |
158 Properties |
| 2013 | £678,794 | -7% |
158 Properties |
| 2012 | £723,110 | 14% |
155 Properties |
| 2011 | £624,765 | 12% |
168 Properties |
| 2010 | £549,880 | 5% |
320 Properties |
| 2009 | £522,769 | -2% |
150 Properties |
| 2008 | £532,392 | -9% |
137 Properties |
| 2007 | £579,387 | 13% |
216 Properties |
| 2006 | £503,367 | 18% |
228 Properties |
| 2005 | £410,920 | 11% |
187 Properties |
| 2004 | £365,842 | -6% |
148 Properties |
| 2003 | £387,229 | 8% |
167 Properties |
| 2002 | £356,012 | 11% |
202 Properties |
| 2001 | £317,625 | -8% |
197 Properties |
| 2000 | £341,578 | 24% |
177 Properties |
| 1999 | £260,454 | 26% |
233 Properties |
| 1998 | £192,671 | 5% |
233 Properties |
| 1997 | £183,265 | 18% |
198 Properties |
| 1996 | £150,238 | 7% |
164 Properties |
| 1995 | £139,582 | - |
130 Properties |
Property Price per Property Type in Barnsbury
Here you can find historic sold price data in order to help with your property search.
The average Property Paid Price for specific property types in the last three years are:
| Property Type | Average Sold Price | Sold Properties |
|---|---|---|
| Flat | £675,128.00 | 338 Flats |
| Detached House | £2,033,333.00 | 3 Detached Houses |
| Terraced House | £1,965,603.00 | 116 Terraced Houses |
| Semi Detached House | £2,491,267.00 | 10 Semi Detached Houses |

