
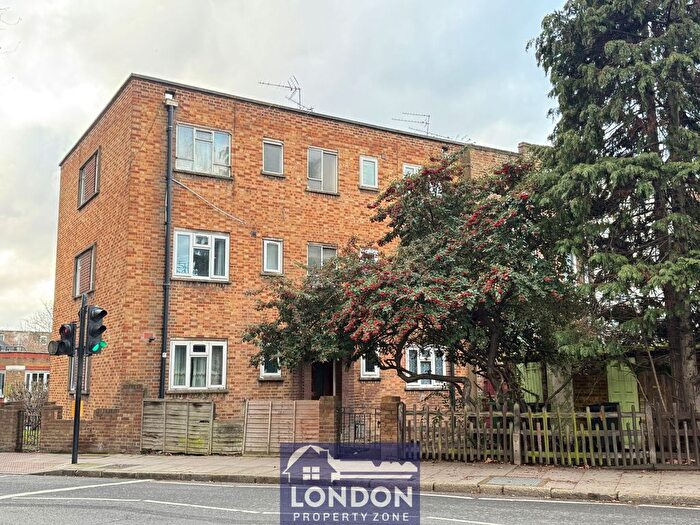
Houses for sale & to rent in Finsbury Park, London
House Prices in Finsbury Park
Properties in this part of Finsbury Park within London have an average house price of £615,819.00 and had 516 Property Transactions within the last 3 years¹. This area has 6,230 households² , where the most expensive property was sold for £3,900,000.00.
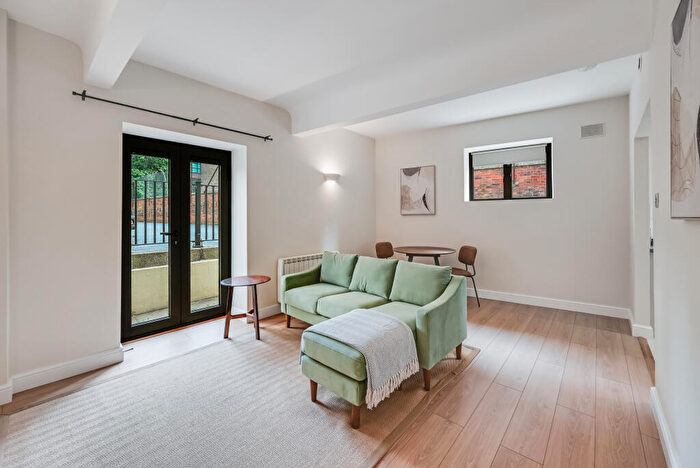
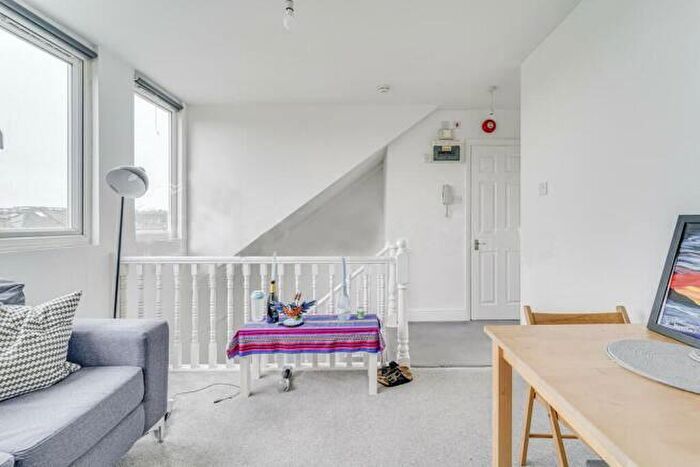
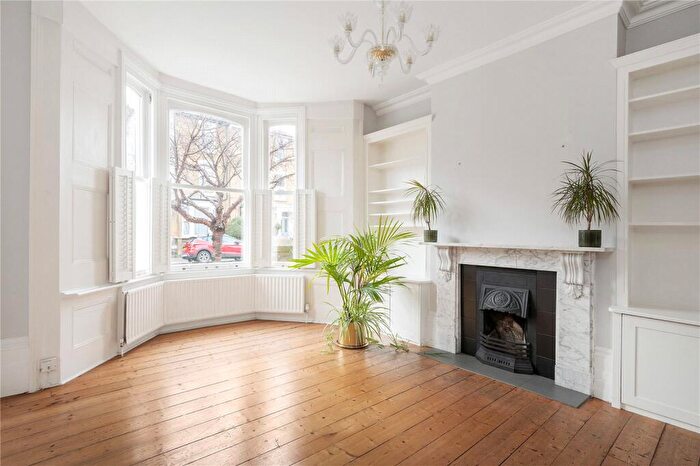
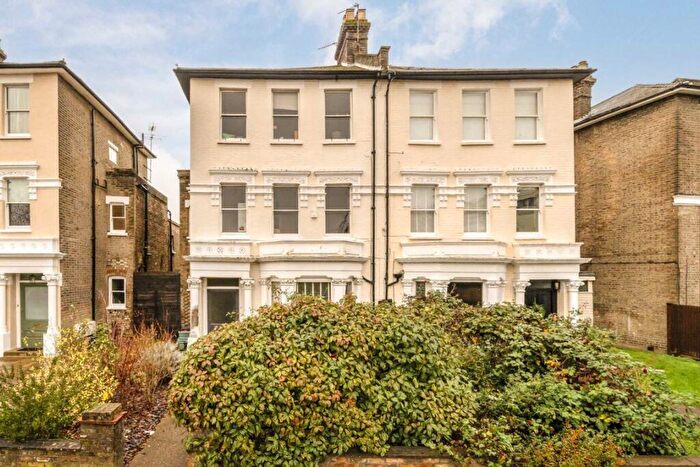
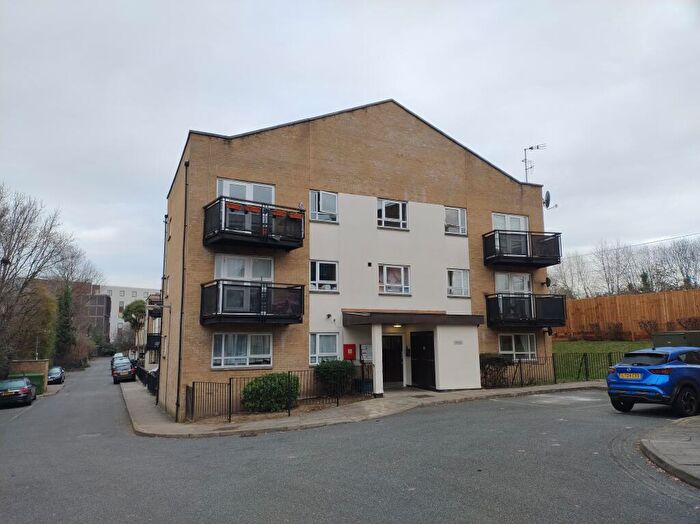
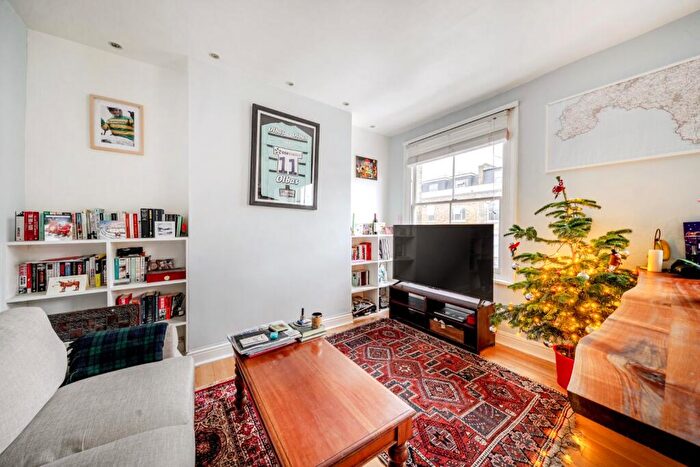
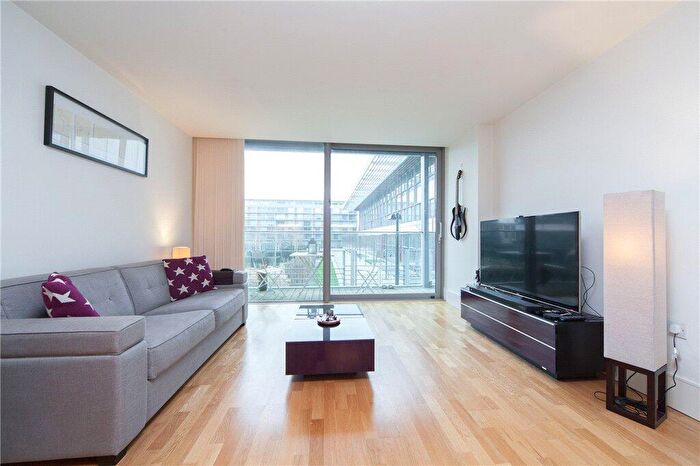
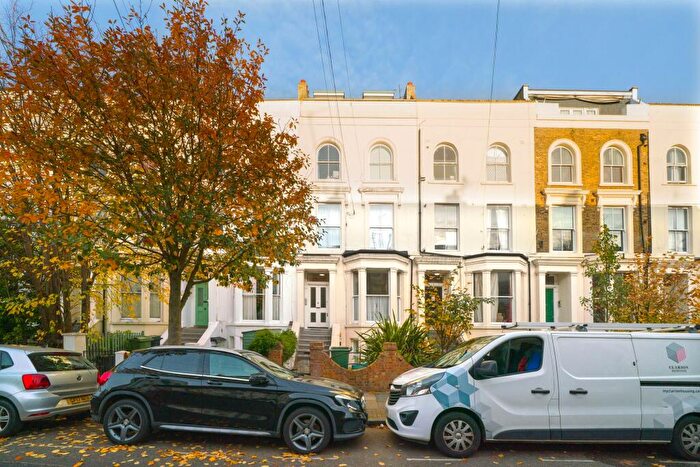
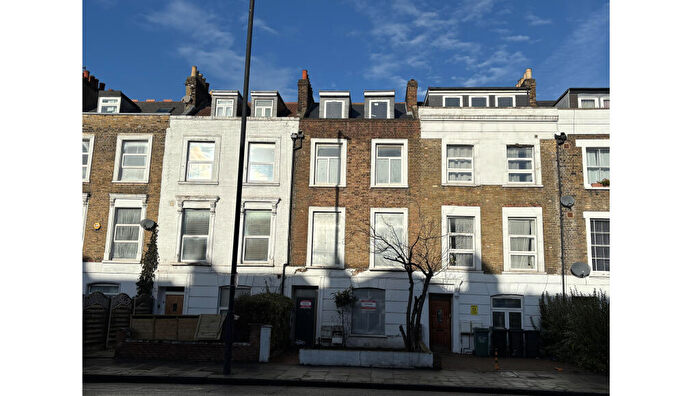
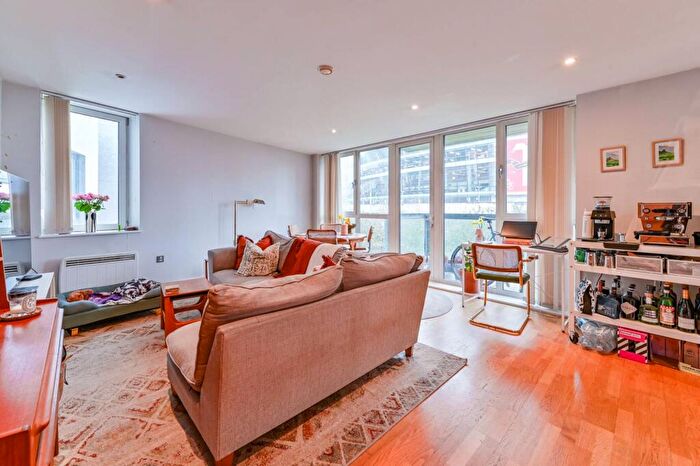
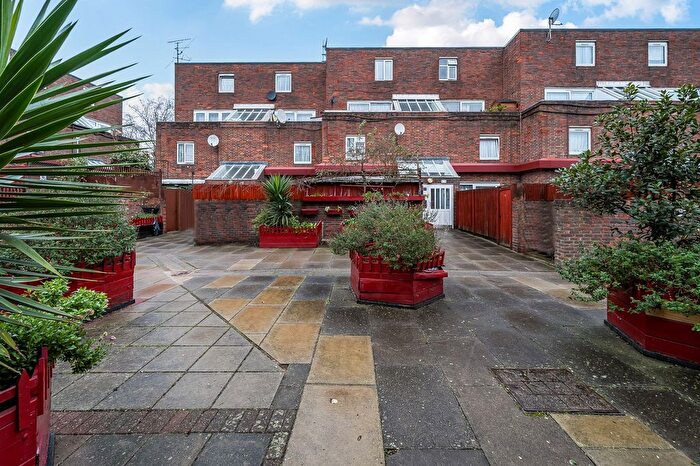
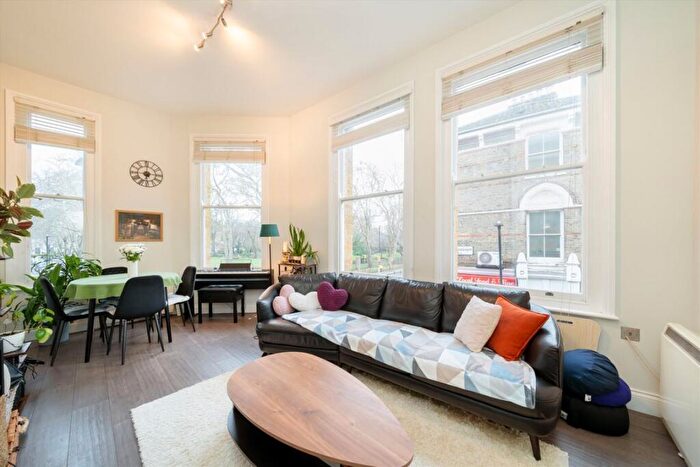
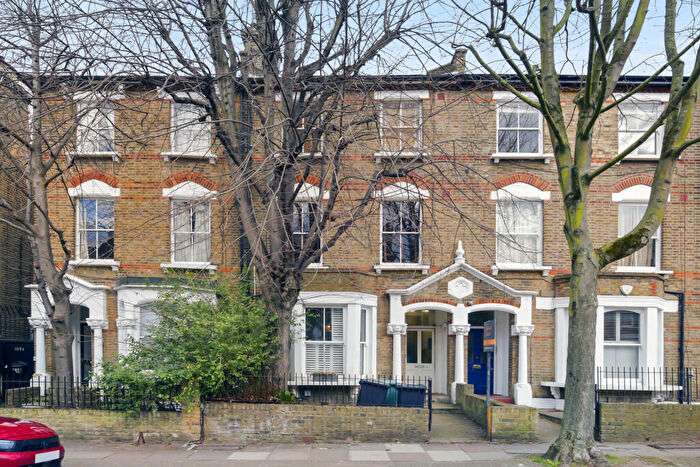
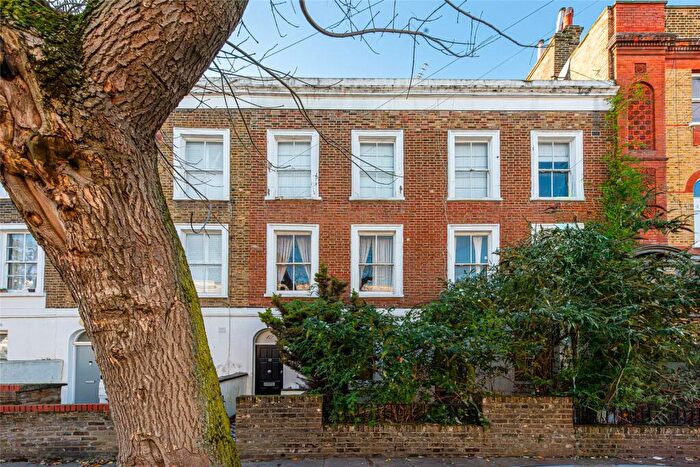
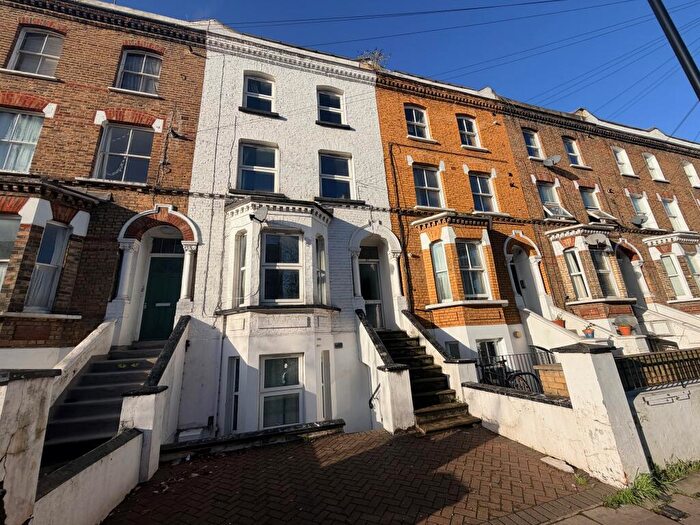
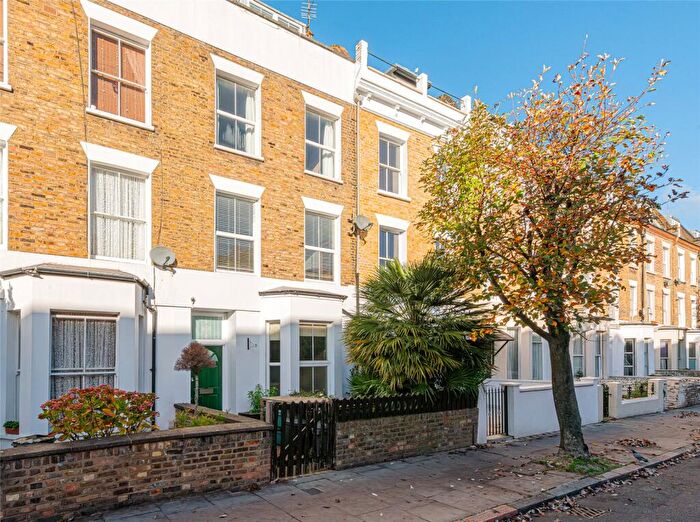
Properties for sale in Finsbury Park
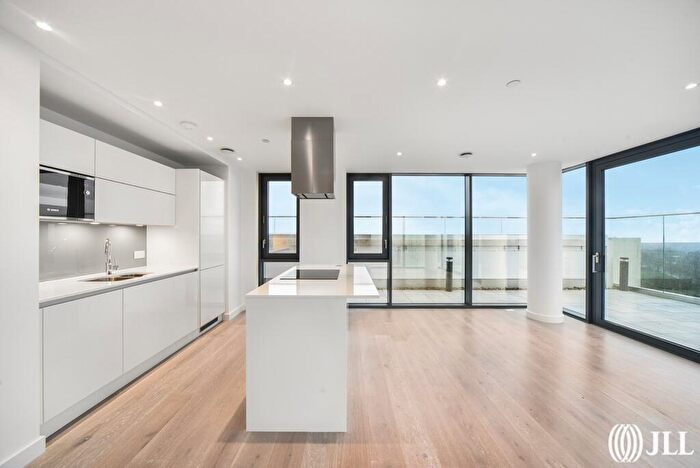
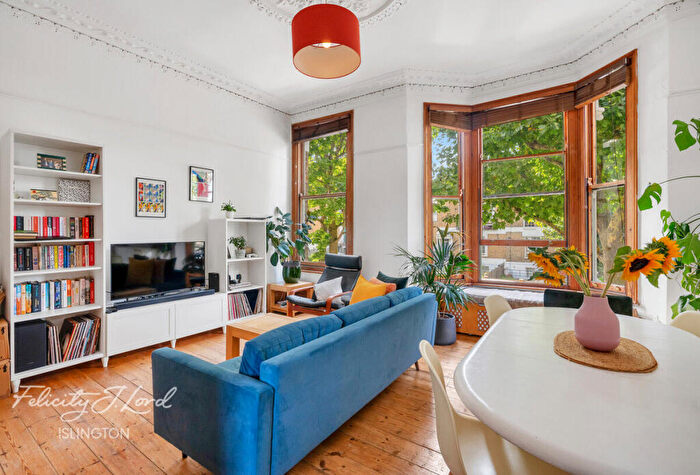
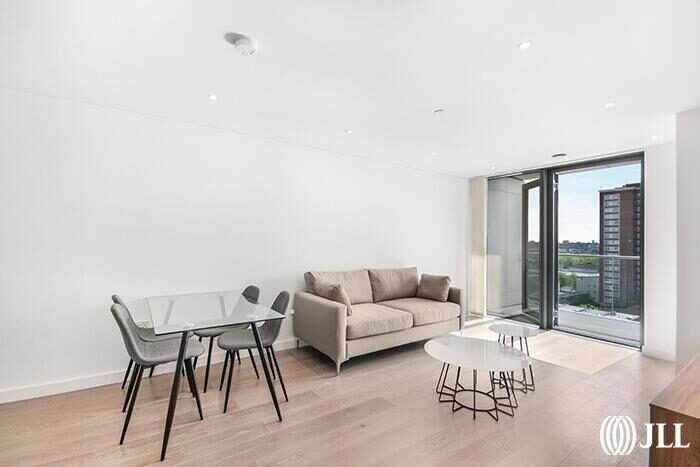
![]()
If you are looking to sell your house, let it out, or receive a property valuation, an expert can help you.
Click the button below to get started.

Roads and Postcodes in Finsbury Park
Navigate through our locations to find the location of your next house in Finsbury Park, London for sale or to rent.
Transport near Finsbury Park
-

 Finsbury Park Station
 -
Arsenal Station
-
Holloway Road Station
-
 Upper Holloway Station
 -
Crouch Hill Station
-
Drayton Park Station
-
Archway Station
-
Caledonian Road Station
-
Manor House Station
-
Tufnell Park Station
- FAQ
- Price Paid By Year
- Property Type Price
Frequently asked questions about Finsbury Park
What is the average price for a property for sale in Finsbury Park?
The average price for a property for sale in Finsbury Park is £615,819. This amount is 27% lower than the average price in London. There are 6,119 property listings for sale in Finsbury Park.
What streets have the most expensive properties for sale in Finsbury Park?
The streets with the most expensive properties for sale in Finsbury Park are Travers Road at an average of £1,192,500, Coleridge Road at an average of £1,075,000 and Windsor Road at an average of £917,625.
What streets have the most affordable properties for sale in Finsbury Park?
The streets with the most affordable properties for sale in Finsbury Park are Six Acres Estate at an average of £288,714, Kinloch Street at an average of £308,250 and Mingard Walk at an average of £345,000.
Which train stations are available in or near Finsbury Park?
Some of the train stations available in or near Finsbury Park are Finsbury Park, Upper Holloway and Crouch Hill.
Which tube stations are available in or near Finsbury Park?
Some of the tube stations available in or near Finsbury Park are Finsbury Park, Arsenal and Holloway Road.
Property Price Paid in Finsbury Park by Year
The average sold property price by year was:
| Year | Average Sold Price | Price Change |
Sold Properties
|
|---|---|---|---|
| 2025 | £594,181 | -4% |
72 Properties |
| 2024 | £617,675 | 2% |
146 Properties |
| 2023 | £606,762 | -4% |
152 Properties |
| 2022 | £634,062 | - |
146 Properties |
| 2021 | £633,771 | 13% |
151 Properties |
| 2020 | £550,122 | 1% |
342 Properties |
| 2019 | £545,928 | 5% |
119 Properties |
| 2018 | £520,646 | -6% |
126 Properties |
| 2017 | £553,511 | 9% |
116 Properties |
| 2016 | £506,037 | 0,2% |
148 Properties |
| 2015 | £505,243 | 6% |
142 Properties |
| 2014 | £475,849 | 17% |
159 Properties |
| 2013 | £396,134 | 21% |
159 Properties |
| 2012 | £313,967 | -13% |
264 Properties |
| 2011 | £354,024 | 14% |
117 Properties |
| 2010 | £304,987 | 14% |
141 Properties |
| 2009 | £261,823 | -18% |
167 Properties |
| 2008 | £308,248 | -8% |
88 Properties |
| 2007 | £332,075 | 16% |
207 Properties |
| 2006 | £279,480 | 11% |
202 Properties |
| 2005 | £247,733 | -3% |
157 Properties |
| 2004 | £256,377 | 15% |
169 Properties |
| 2003 | £218,519 | -2% |
165 Properties |
| 2002 | £223,693 | 12% |
222 Properties |
| 2001 | £196,172 | 6% |
180 Properties |
| 2000 | £185,292 | 13% |
218 Properties |
| 1999 | £160,725 | 26% |
267 Properties |
| 1998 | £118,570 | -2% |
133 Properties |
| 1997 | £121,321 | 23% |
191 Properties |
| 1996 | £93,810 | 23% |
206 Properties |
| 1995 | £71,800 | - |
80 Properties |
Property Price per Property Type in Finsbury Park
Here you can find historic sold price data in order to help with your property search.
The average Property Paid Price for specific property types in the last three years are:
| Property Type | Average Sold Price | Sold Properties |
|---|---|---|
| Flat | £527,709.00 | 435 Flats |
| Semi Detached House | £1,032,000.00 | 2 Semi Detached Houses |
| Terraced House | £1,090,443.00 | 79 Terraced Houses |