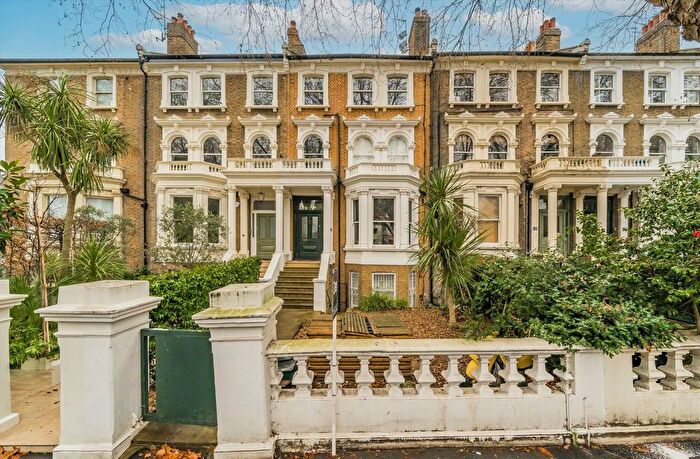
Houses for sale & to rent in N5 2QL, Rosa Alba Mews, Highbury East, London
House Prices in N5 2QL, Rosa Alba Mews, Highbury East
Properties in N5 2QL have no sales history available within the last 3 years. N5 2QL is a postcode in Rosa Alba Mews located in Highbury East, an area in London, Islington London Borough, with 4 households².
Properties for sale near N5 2QL, Rosa Alba Mews
Price Paid in Rosa Alba Mews, N5 2QL, Highbury East
9 Rosa Alba Mews, N5 2QL, Highbury East London
Property 9 has been sold 2 times. The last time it was sold was in 12/05/2017 and the sold price was £1,295,000.00.
This terraced house, sold as a freehold on 12/05/2017, is a 127 sqm mid-terrace house with an EPC rating of E.
| Date | Price | Property Type | Tenure | Classification |
|---|---|---|---|---|
| 12/05/2017 | £1,295,000.00 | Terraced House | freehold | Established Building |
| 22/10/2001 | £370,000.00 | Terraced House | freehold | Established Building |
8 Rosa Alba Mews, N5 2QL, Highbury East London
Property 8 has been sold 1 time. The last time it was sold was in 11/12/2008 and the sold price was £550,000.00.
This is a Flat which was sold as a freehold in 11/12/2008
| Date | Price | Property Type | Tenure | Classification |
|---|---|---|---|---|
| 11/12/2008 | £550,000.00 | Flat | freehold | Established Building |
10 Rosa Alba Mews, N5 2QL, Highbury East London
Property 10 has been sold 2 times. The last time it was sold was in 12/10/2007 and the sold price was £435,000.00.
This is a Terraced House which was sold as a freehold in 12/10/2007
| Date | Price | Property Type | Tenure | Classification |
|---|---|---|---|---|
| 12/10/2007 | £435,000.00 | Terraced House | freehold | Established Building |
| 04/04/1997 | £97,500.00 | Terraced House | freehold | Established Building |
Transport near N5 2QL, Rosa Alba Mews
-
Arsenal Station
-
Drayton Park Station
-
Canonbury Station
-
Finsbury Park Station
-
Holloway Road Station
-
Highbury and Islington Station
-
Manor House Station
-
Dalston Kingsland Station
-
Essex Road Station
-
Caledonian Road Station
House price paid reports for N5 2QL, Rosa Alba Mews
Click on the buttons below to see price paid reports by year or property price:
- Price Paid By Year
Property Price Paid in N5 2QL, Rosa Alba Mews by Year
The average sold property price by year was:
| Year | Average Sold Price | Price Change |
Sold Properties
|
|---|---|---|---|
| 2017 | £1,295,000 | 58% |
1 Property |
| 2008 | £550,000 | 21% |
1 Property |
| 2007 | £435,000 | 15% |
1 Property |
| 2001 | £370,000 | 74% |
1 Property |
| 1997 | £97,500 | - |
1 Property |

