
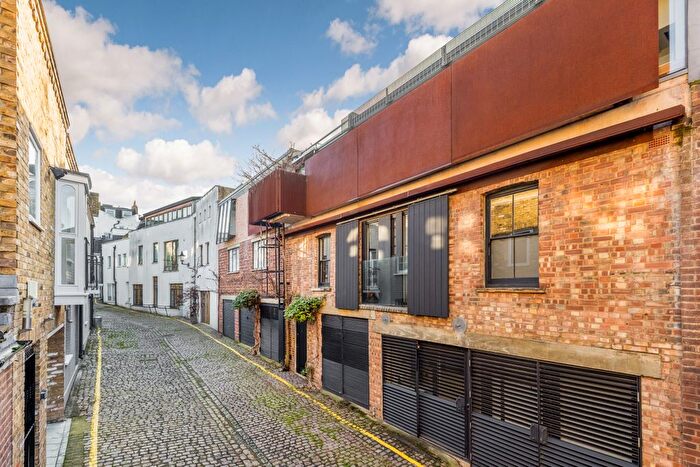
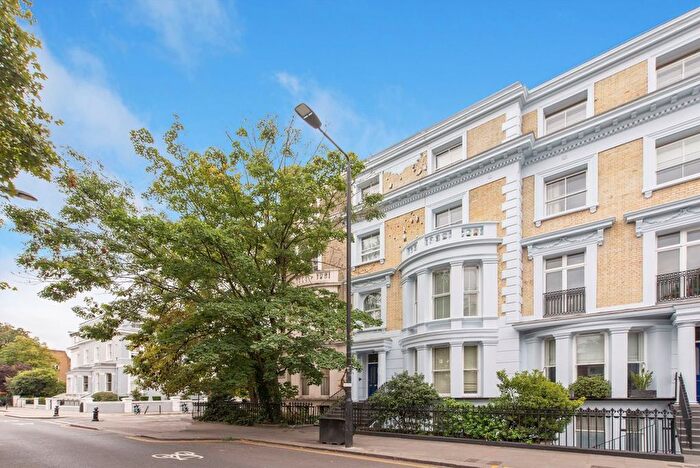
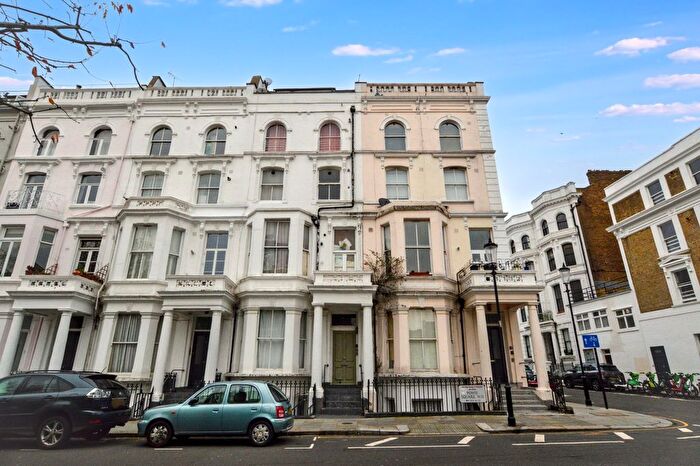
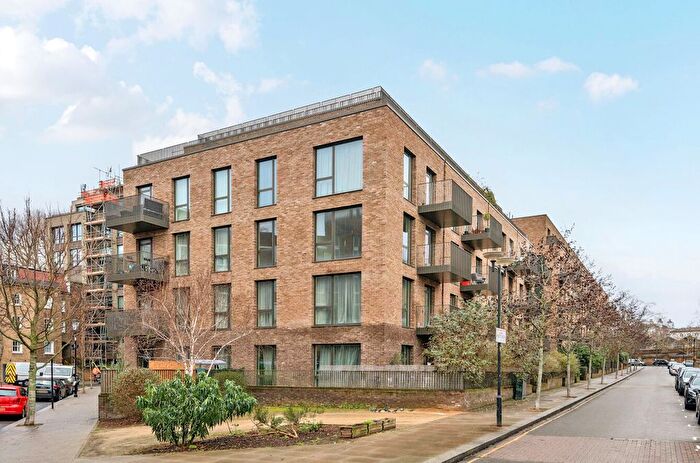
Houses for sale & to rent in W11 1QZ, Upper Talbot Walk, Notting Dale, London
House Prices in W11 1QZ, Upper Talbot Walk, Notting Dale
Properties in W11 1QZ have no sales history available within the last 3 years. W11 1QZ is a postcode in Upper Talbot Walk located in Notting Dale, an area in London, Kensington and Chelsea London Borough, with 11 households².
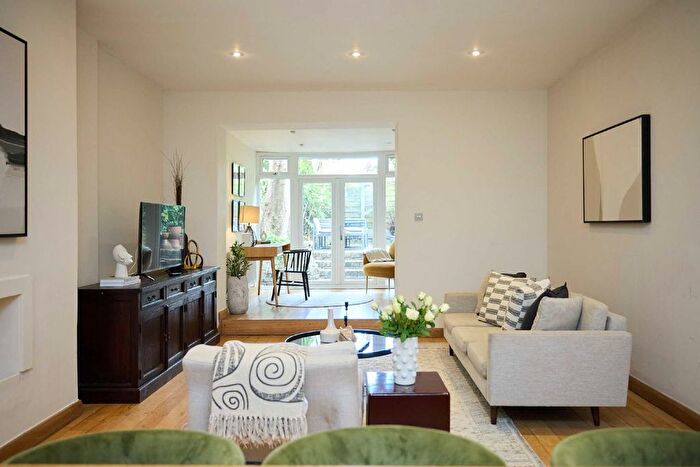
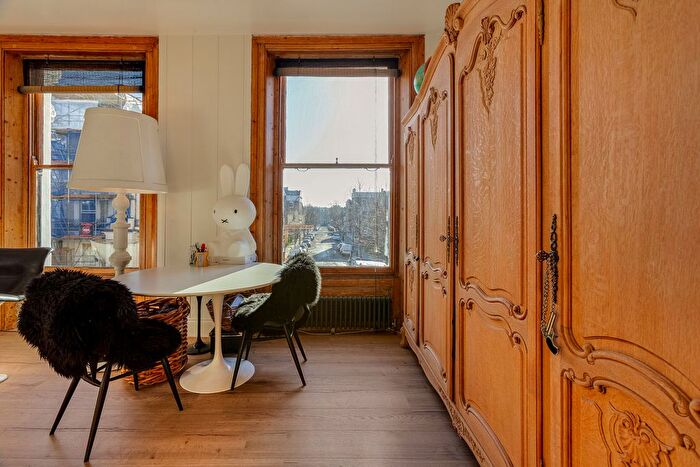
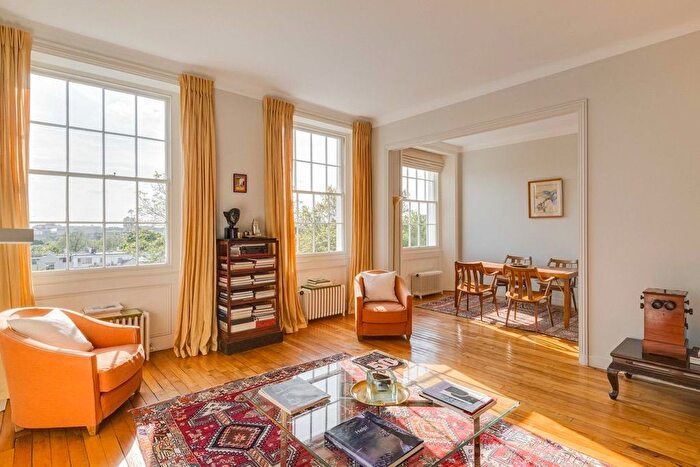
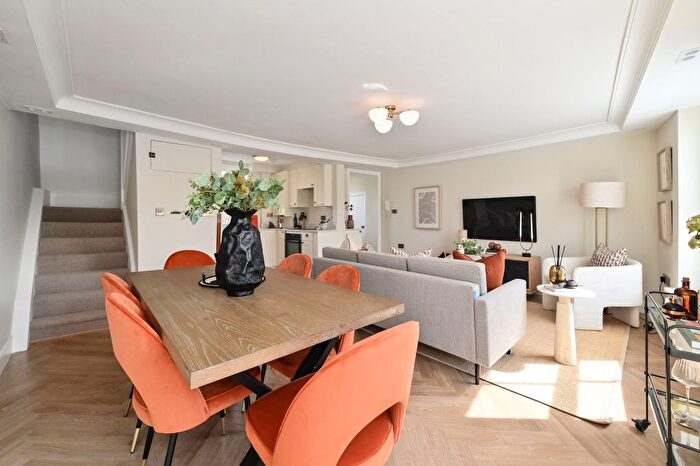
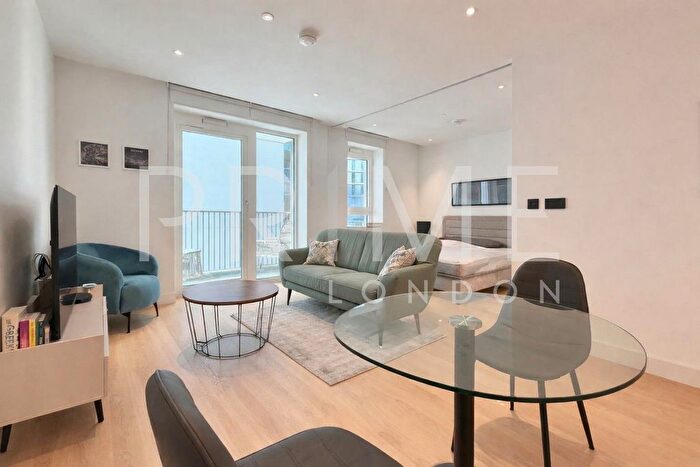
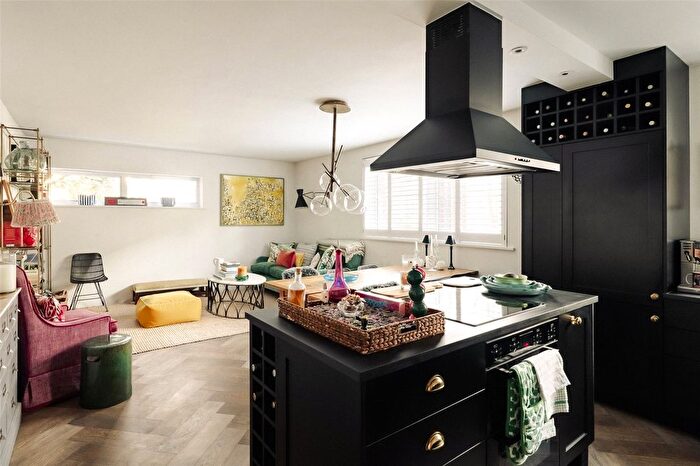
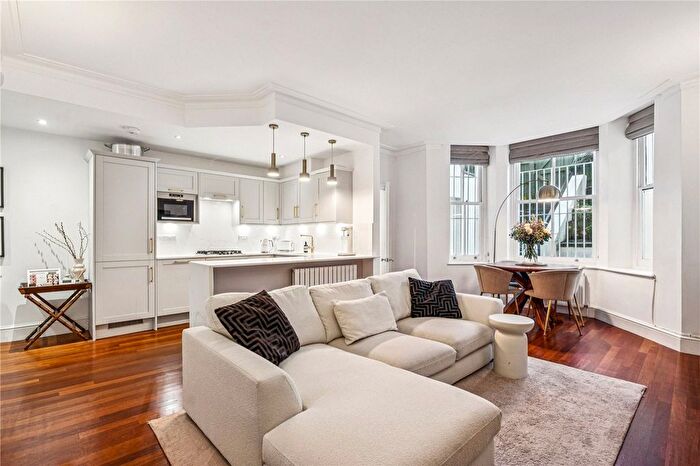
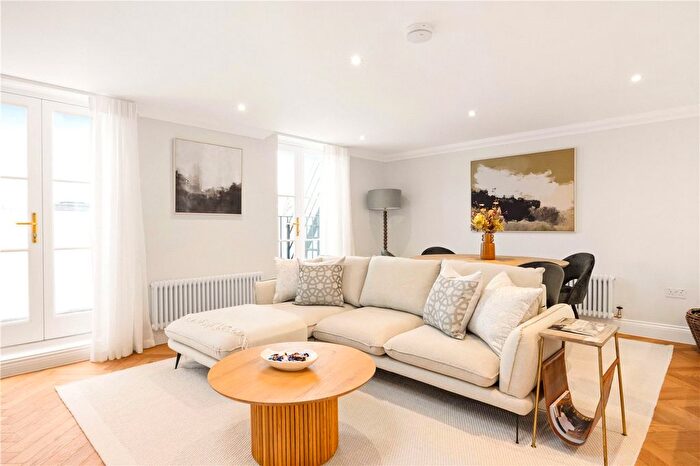
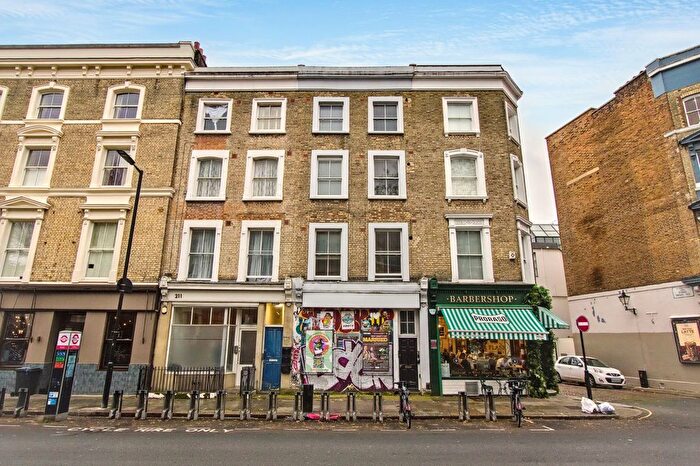
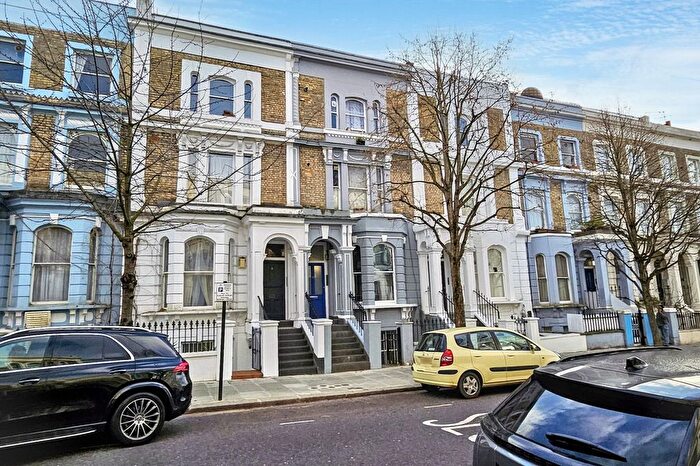
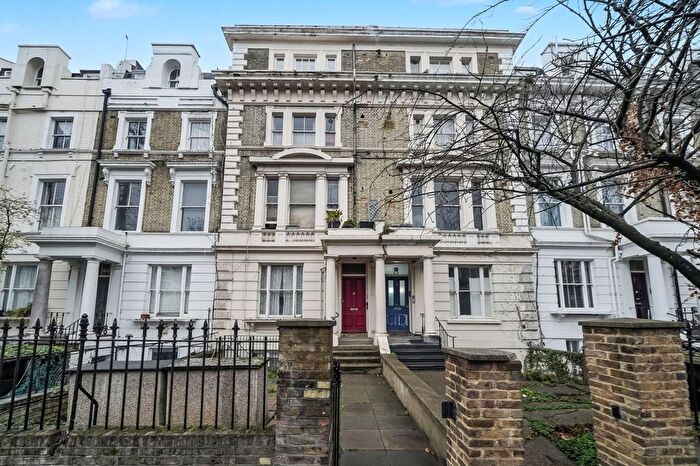
Properties for sale near W11 1QZ, Upper Talbot Walk

![]()
If you are looking to sell your house, let it out, or receive a property valuation, an expert can help you.
Click the button below to get started.

Price Paid in Upper Talbot Walk, W11 1QZ, Notting Dale
7 Upper Talbot Walk, W11 1QZ, Notting Dale London
Property 7 has been sold 2 times. The last time it was sold was in 15/04/2021 and the sold price was £530,000.00.
This flat, sold as a leasehold on 15/04/2021, is a 84 sqm top-floor flat with an EPC rating of D.
| Date | Price | Property Type | Tenure | Classification |
|---|---|---|---|---|
| 15/04/2021 | £530,000.00 | Flat | leasehold | Established Building |
| 26/02/2013 | £330,000.00 | Flat | leasehold | Established Building |
10 Upper Talbot Walk, W11 1QZ, Notting Dale London
Property 10 has been sold 1 time. The last time it was sold was in 25/05/2018 and the sold price was £490,000.00.
This flat, sold as a leasehold on 25/05/2018, is a 86 sqm mid-floor flat with an EPC rating of D.
| Date | Price | Property Type | Tenure | Classification |
|---|---|---|---|---|
| 25/05/2018 | £490,000.00 | Flat | leasehold | Established Building |
12 Upper Talbot Walk, W11 1QZ, Notting Dale London
Property 12 has been sold 2 times. The last time it was sold was in 04/12/2017 and the sold price was £500,000.00.
This flat, sold as a leasehold on 04/12/2017, is a 85 sqm mid-floor flat with an EPC rating of D.
| Date | Price | Property Type | Tenure | Classification |
|---|---|---|---|---|
| 04/12/2017 | £500,000.00 | Flat | leasehold | Established Building |
| 11/07/2008 | £315,000.00 | Flat | leasehold | Established Building |
3 Upper Talbot Walk, W11 1QZ, Notting Dale London
Property 3 has been sold 1 time. The last time it was sold was in 28/06/2007 and the sold price was £350,000.00.
This flat, sold as a leasehold on 28/06/2007, is a 85 sqm top-floor flat with an EPC rating of E.
| Date | Price | Property Type | Tenure | Classification |
|---|---|---|---|---|
| 28/06/2007 | £350,000.00 | Flat | leasehold | Established Building |
11 Upper Talbot Walk, W11 1QZ, Notting Dale London
Property 11 has been sold 1 time. The last time it was sold was in 23/01/2004 and the sold price was £232,000.00.
This flat, sold as a leasehold on 23/01/2004, is a 86 sqm top-floor flat with an EPC rating of D.
| Date | Price | Property Type | Tenure | Classification |
|---|---|---|---|---|
| 23/01/2004 | £232,000.00 | Flat | leasehold | Established Building |
9 Upper Talbot Walk, W11 1QZ, Notting Dale London
This is a 85 square meter Top-floor Flat with an EPC rating of D. Currently, there is no transaction history available for this property.
6 TALBOT WALK, W11 1QZ, Notting Dale London
This is a 99 square meter Mid-floor Flat with an EPC rating of C. Currently, there is no transaction history available for this property.
4 Upper Talbot Walk, W11 1QZ, Notting Dale London
This is a 85 square meter Mid-floor Flat with an EPC rating of C. Currently, there is no transaction history available for this property.
8 UPPER TALBOT WALK, W11 1QZ, Notting Dale London
This is a 84 square meter Top-floor Flat with an EPC rating of D. Currently, there is no transaction history available for this property.
Transport near W11 1QZ, Upper Talbot Walk
-
 Ladbroke Grove Station
 -
Latimer Road Station
-
White City Station
-
Holland Park Station
-
Westbourne Park Station
-
Wood Lane Station
-

 Shepherds Bush Station
 -
Notting Hill Gate Station
-
Shepherds Bush Market Station
-
Royal Oak Station
House price paid reports for W11 1QZ, Upper Talbot Walk
Click on the buttons below to see price paid reports by year or property price:
- Price Paid By Year
Property Price Paid in W11 1QZ, Upper Talbot Walk by Year
The average sold property price by year was:
| Year | Average Sold Price | Price Change |
Sold Properties
|
|---|---|---|---|
| 2021 | £530,000 | 8% |
1 Property |
| 2018 | £490,000 | -2% |
1 Property |
| 2017 | £500,000 | 34% |
1 Property |
| 2013 | £330,000 | 5% |
1 Property |
| 2008 | £315,000 | -11% |
1 Property |
| 2007 | £350,000 | 34% |
1 Property |
| 2004 | £232,000 | - |
1 Property |