
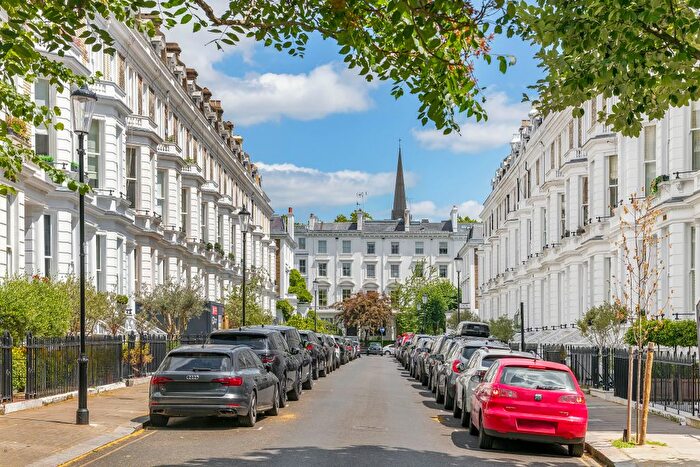
Houses for sale & to rent in Kensington and Chelsea London Borough, England
House Prices in Kensington and Chelsea London Borough
Properties in Kensington and Chelsea London Borough have
an average house price of
£2,276,730.00
and had 7,171 Property Transactions
within the last 3 years.¹
Kensington and Chelsea London Borough is a location in
England with
78,209 households², where the most expensive property was sold for £178,000,000.00.
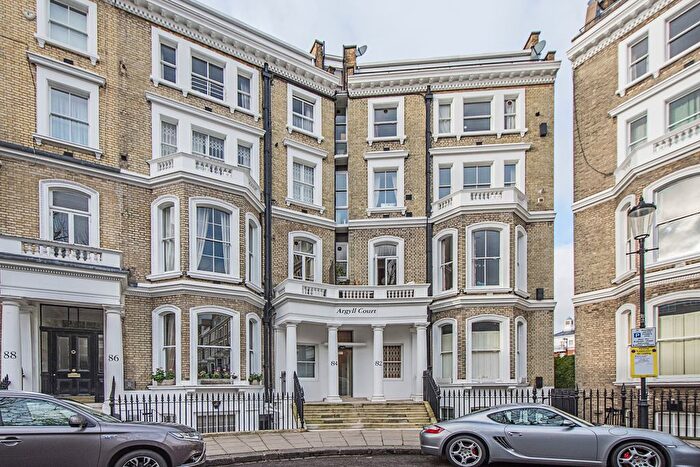
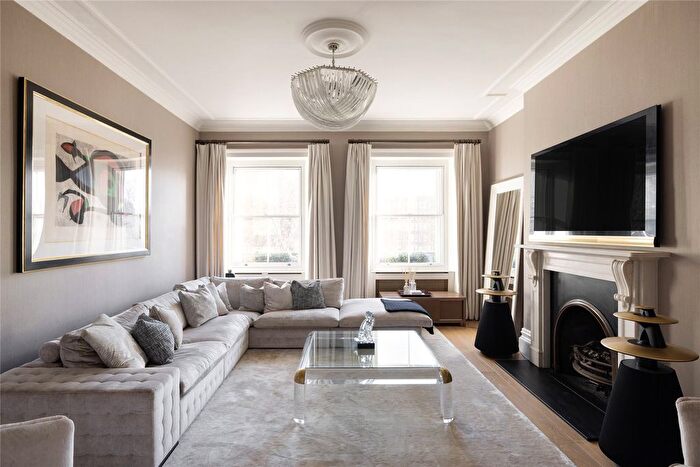
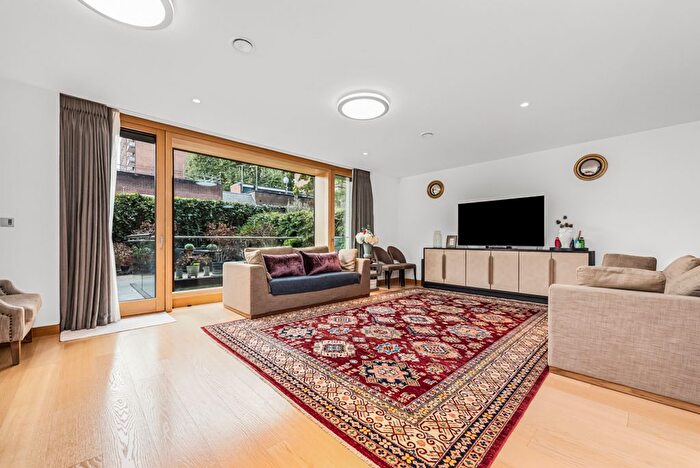
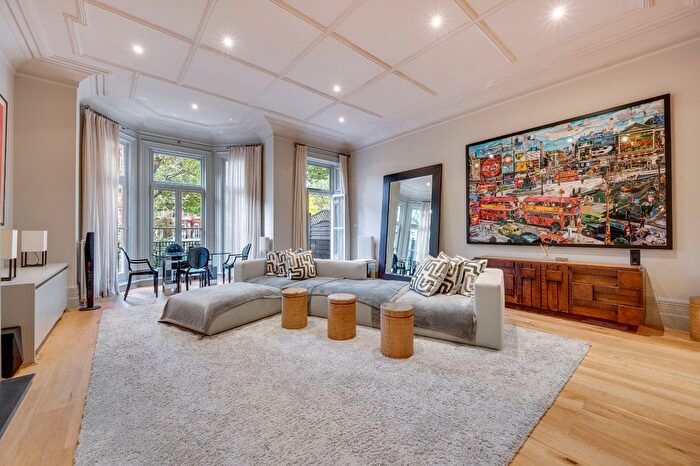
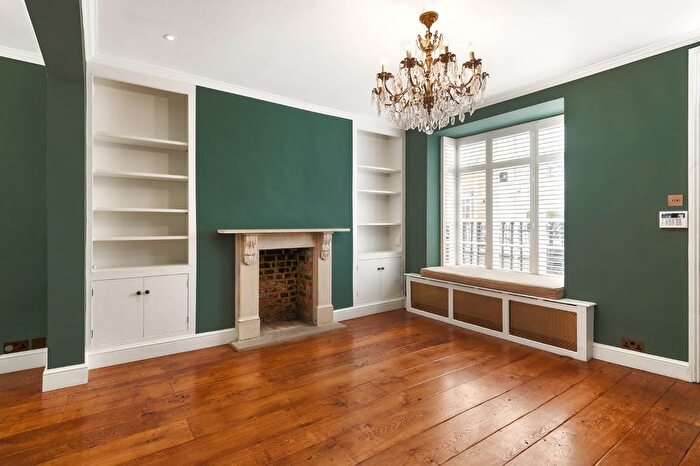
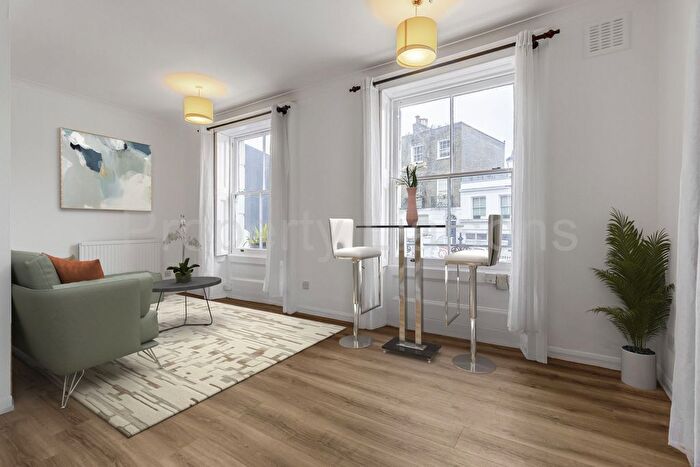
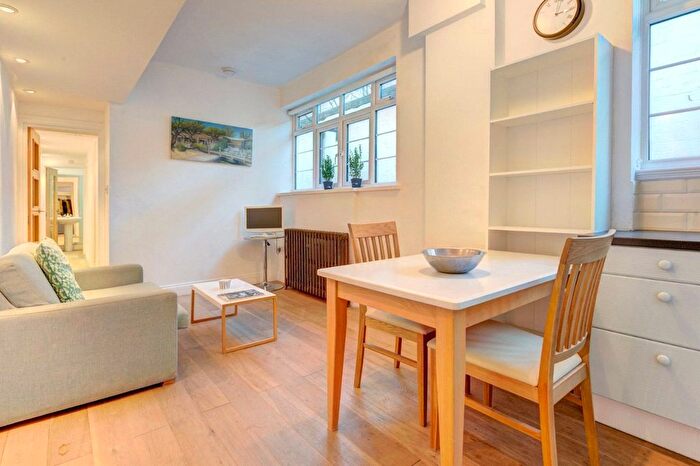
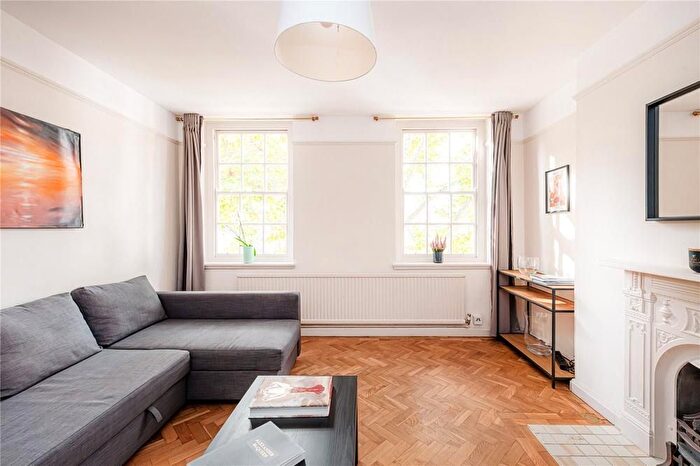
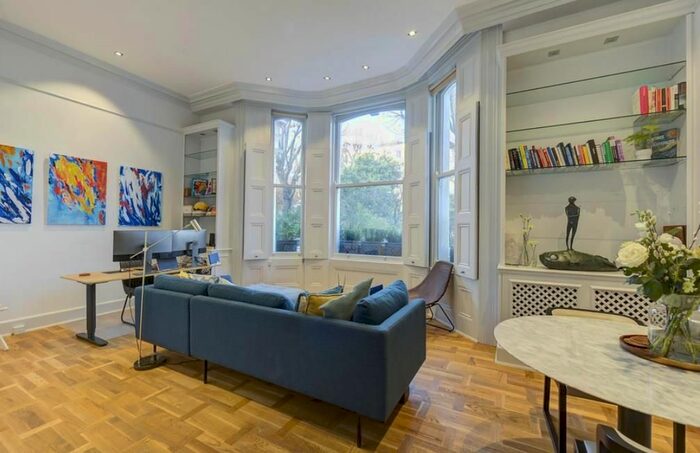
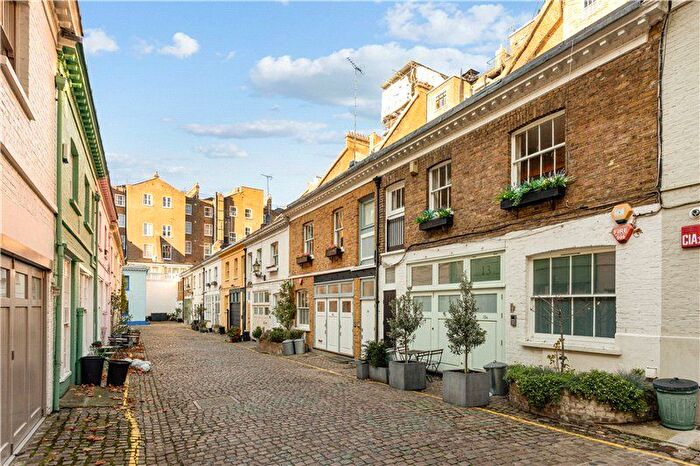
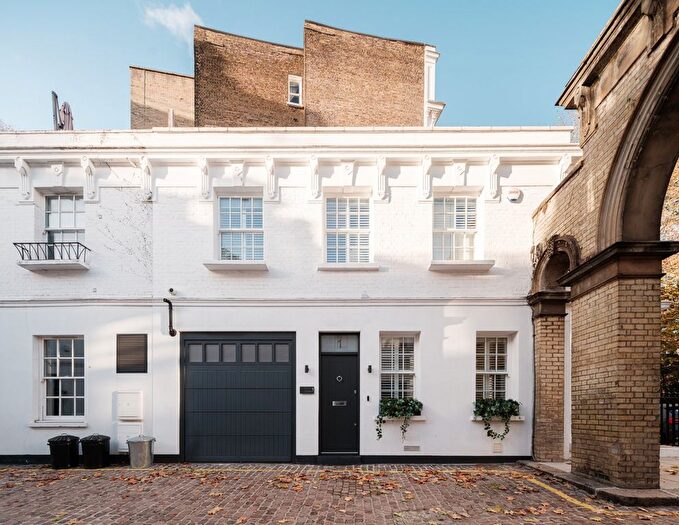
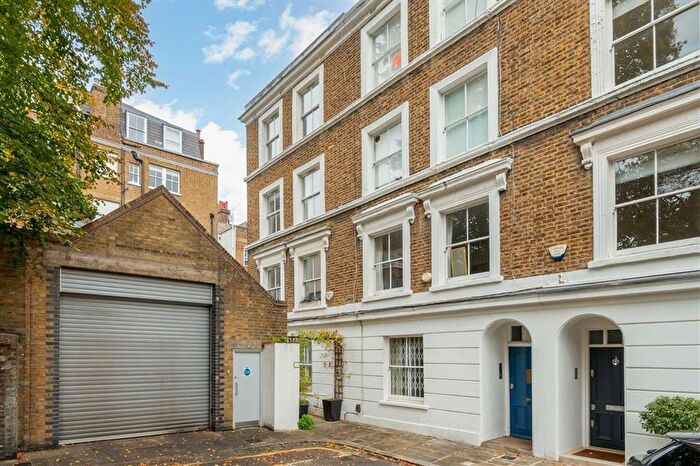
Properties for sale in Kensington and Chelsea London Borough
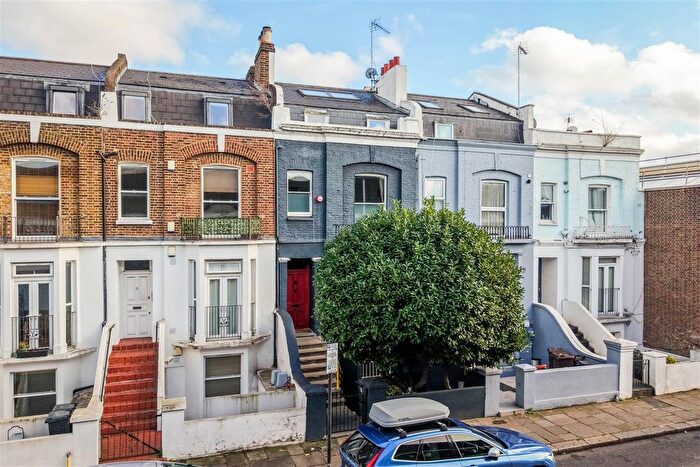
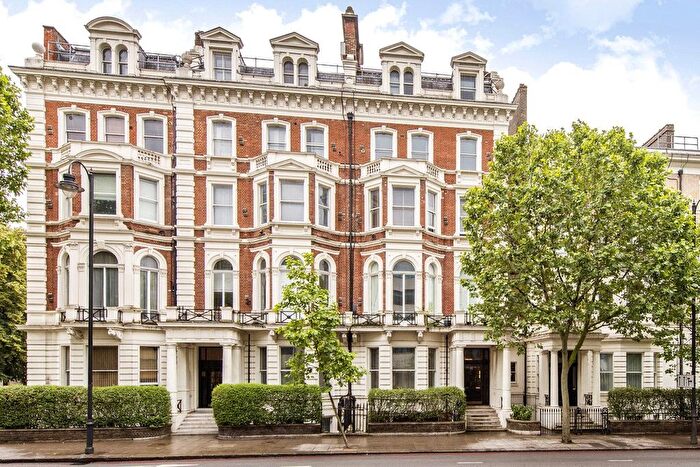
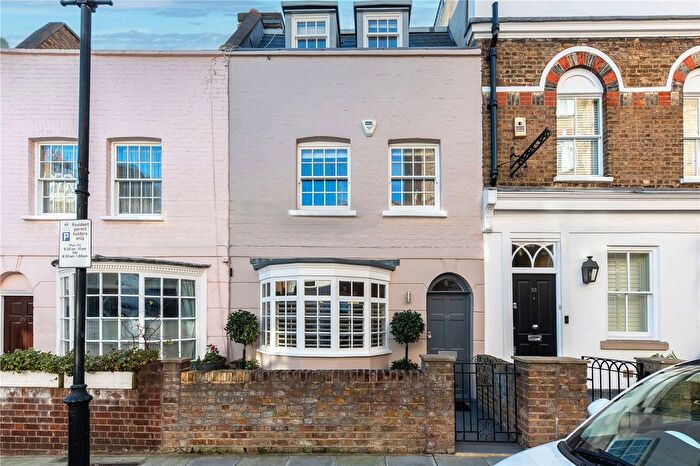
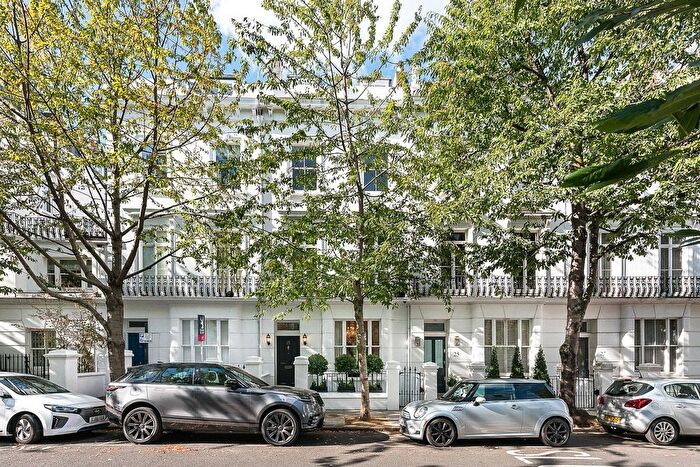
![]()
If you are looking to sell your house, let it out, or receive a property valuation, an expert can help you.
Click the button below to get started.
Towns in Kensington and Chelsea London Borough
Navigate through our locations to find the location of your next house in Kensington and Chelsea, England for sale or to rent.
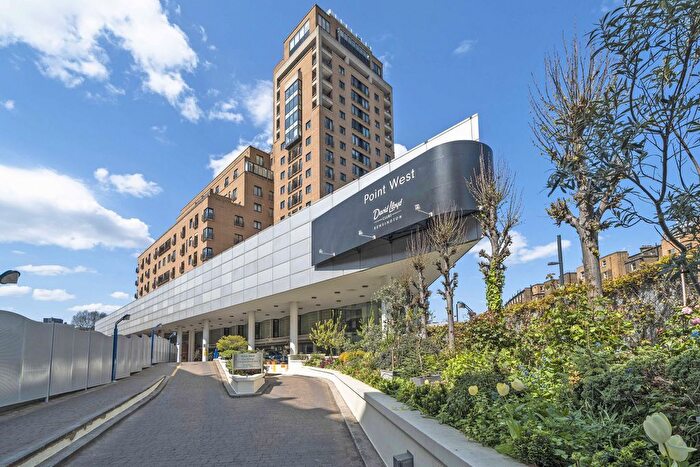
Transport in Kensington and Chelsea London Borough
Please see below transportation links in this area:
-
 High Street Kensington Station
 -
Gloucester Road Station
-
Earls Court Station
-
South Kensington Station
-
Notting Hill Gate Station
-
Queensway Station
-
Bayswater Station
-

 West Brompton Station
 -
Holland Park Station
-
Kensington Olympia Station
- FAQ
- Price Paid By Year
- Property Type Price
Frequently asked questions about Kensington and Chelsea London Borough
What is the average price for a property for sale in Kensington and Chelsea London Borough?
The average price for a property for sale in Kensington and Chelsea London Borough is £2,276,730. This amount is 531% higher than the average price in England. There are more than 10,000 property listings for sale in Kensington and Chelsea London Borough.
Which train stations are available in or near Kensington and Chelsea London Borough?
Some of the train stations available in or near Kensington and Chelsea London Borough are West Brompton and Kensington Olympia.
Which tube stations are available in or near Kensington and Chelsea London Borough?
Some of the tube stations available in or near Kensington and Chelsea London Borough are High Street Kensington, Gloucester Road and Earls Court.
Property Price Paid in Kensington and Chelsea London Borough by Year
The average sold property price by year was:
| Year | Average Sold Price | Price Change |
Sold Properties
|
|---|---|---|---|
| 2025 | £1,966,273 | -6% |
944 Properties |
| 2024 | £2,092,368 | -17% |
1,996 Properties |
| 2023 | £2,455,909 | 2% |
1,918 Properties |
| 2022 | £2,413,950 | 9% |
2,313 Properties |
| 2021 | £2,195,849 | 3% |
2,270 Properties |
| 2020 | £2,139,138 | 5% |
1,655 Properties |
| 2019 | £2,035,124 | -13% |
1,762 Properties |
| 2018 | £2,303,062 | 11% |
1,650 Properties |
| 2017 | £2,047,858 | 1% |
1,934 Properties |
| 2016 | £2,018,925 | 2% |
2,183 Properties |
| 2015 | £1,986,237 | 0,2% |
2,612 Properties |
| 2014 | £1,982,037 | 15% |
3,023 Properties |
| 2013 | £1,679,168 | 10% |
2,784 Properties |
| 2012 | £1,510,854 | 15% |
2,263 Properties |
| 2011 | £1,291,193 | 3% |
2,503 Properties |
| 2010 | £1,247,887 | 16% |
2,473 Properties |
| 2009 | £1,044,726 | -13% |
2,044 Properties |
| 2008 | £1,181,688 | 13% |
1,732 Properties |
| 2007 | £1,023,251 | 15% |
3,769 Properties |
| 2006 | £871,269 | 13% |
4,316 Properties |
| 2005 | £755,288 | 6% |
3,420 Properties |
| 2004 | £710,284 | 7% |
4,003 Properties |
| 2003 | £659,246 | 7% |
3,478 Properties |
| 2002 | £614,310 | 5% |
4,535 Properties |
| 2001 | £582,973 | 5% |
4,086 Properties |
| 2000 | £555,994 | 22% |
4,473 Properties |
| 1999 | £431,659 | 12% |
5,215 Properties |
| 1998 | £378,532 | 8% |
4,242 Properties |
| 1997 | £347,443 | 14% |
4,893 Properties |
| 1996 | £297,121 | 12% |
4,462 Properties |
| 1995 | £262,707 | - |
3,599 Properties |
Property Price per Property Type in Kensington and Chelsea London Borough
Here you can find historic sold price data in order to help with your property search.
The average Property Paid Price for specific property types in the last three years are:
| Property Type | Average Sold Price | Sold Properties |
|---|---|---|
| Semi Detached House | £10,373,275.00 | 120 Semi Detached Houses |
| Terraced House | £4,252,422.00 | 1,404 Terraced Houses |
| Flat | £1,472,017.00 | 5,579 Flats |
| Detached House | £13,218,417.00 | 68 Detached Houses |