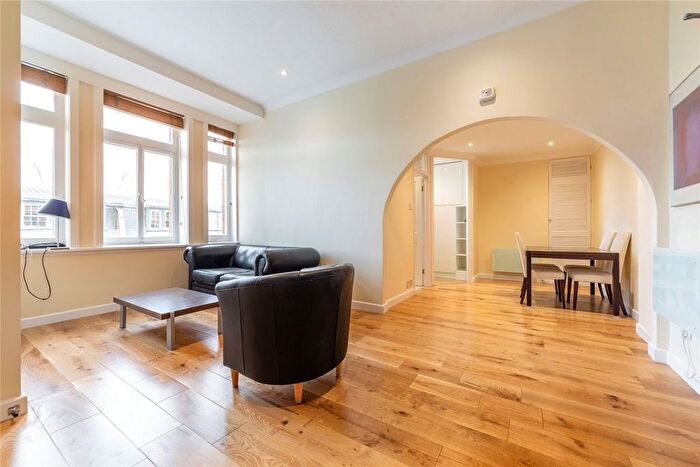
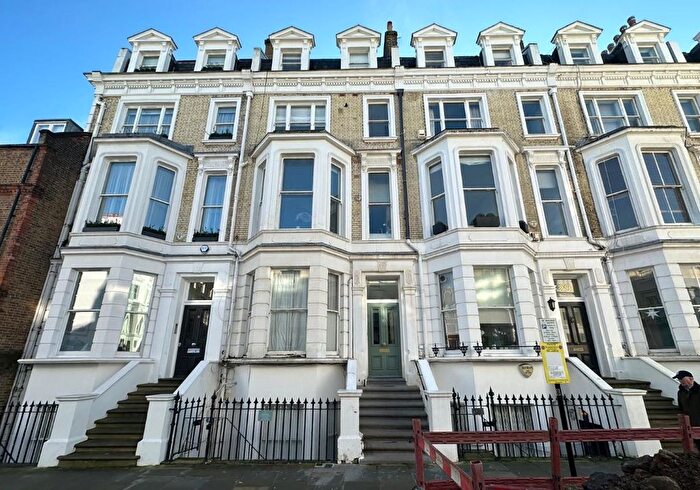
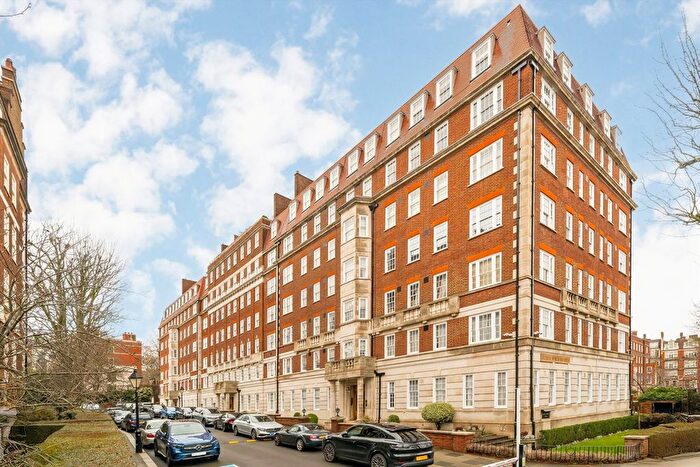
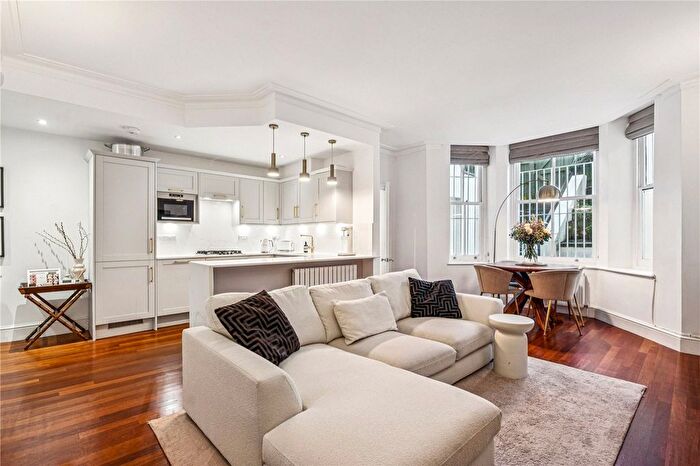
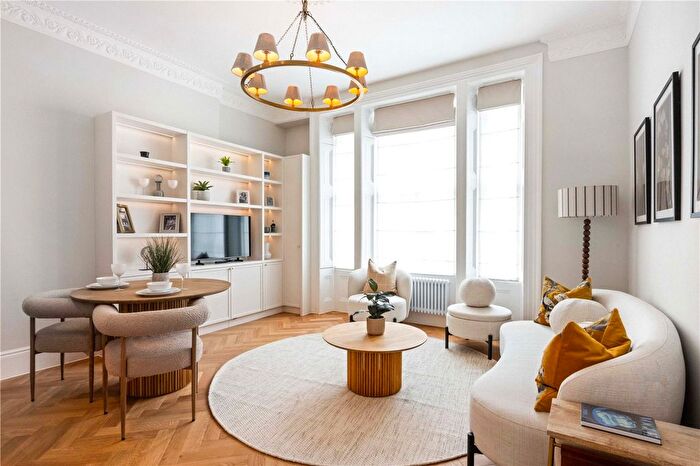
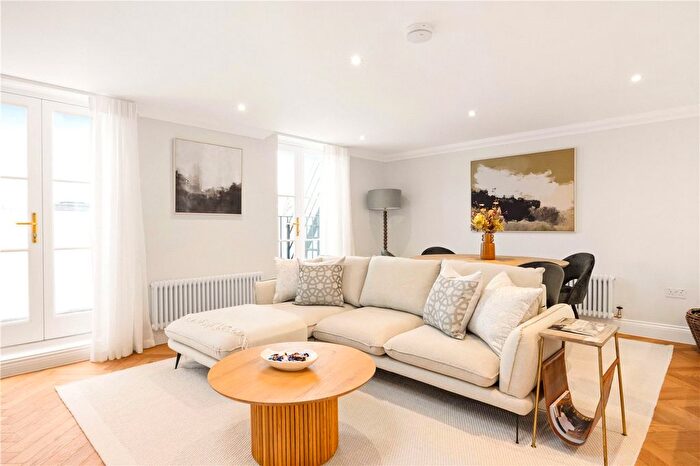
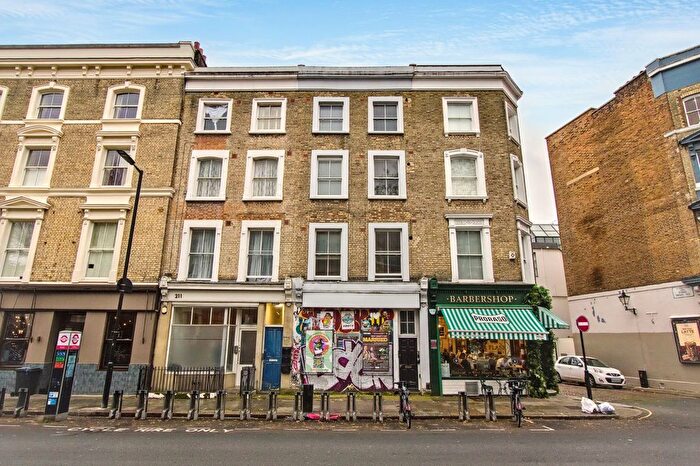
Houses for sale & to rent in Pembridge, London
House Prices in Pembridge
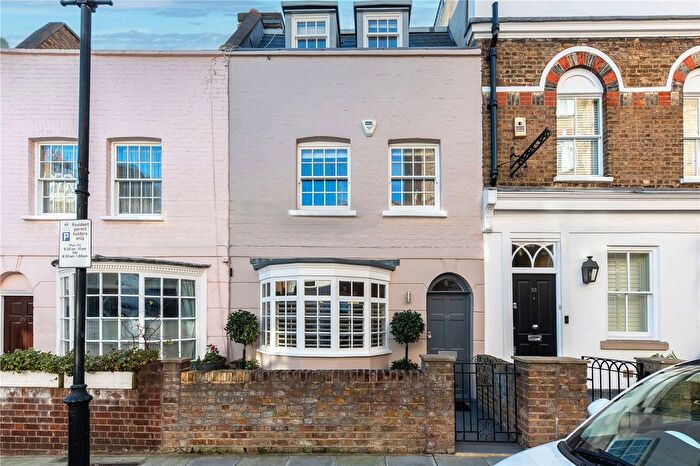
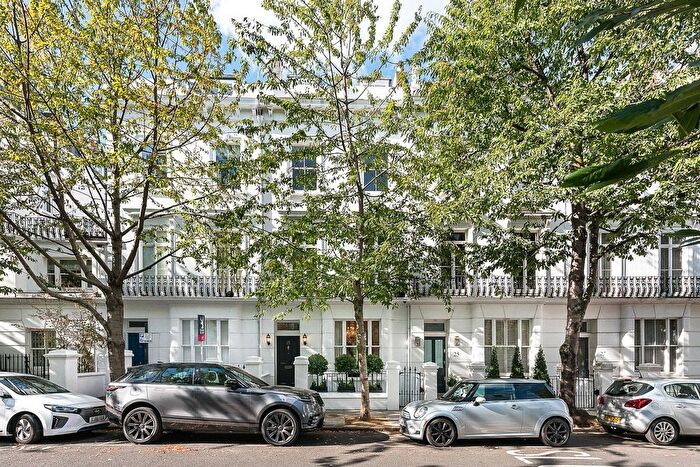
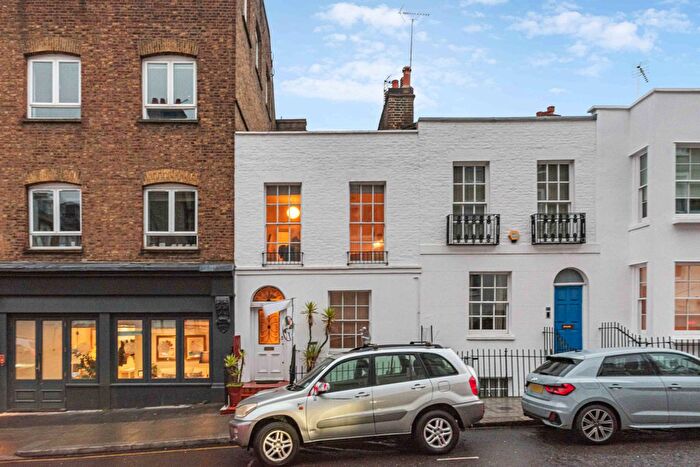
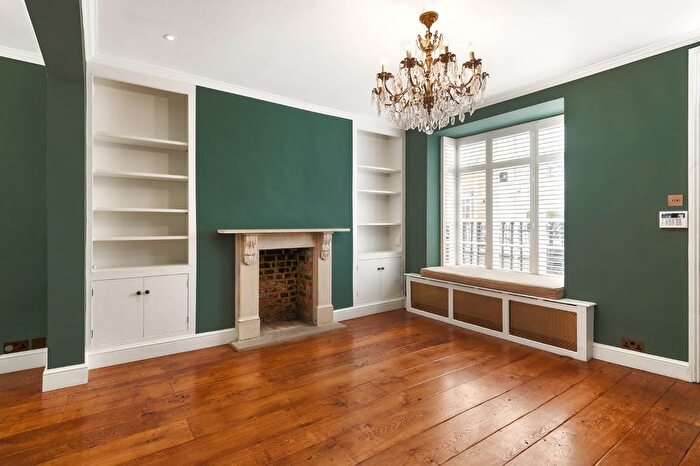
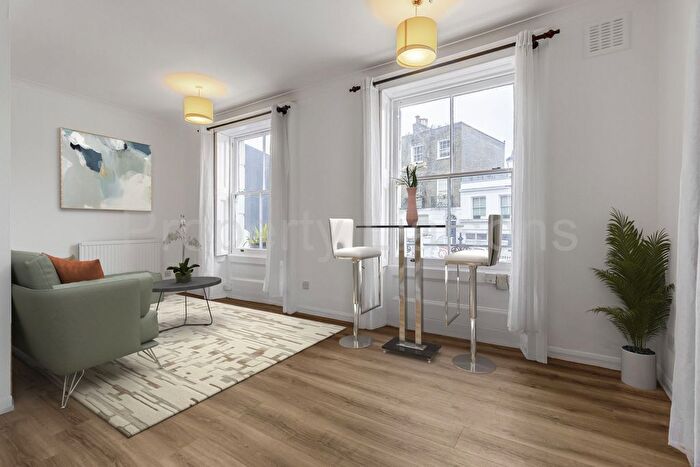
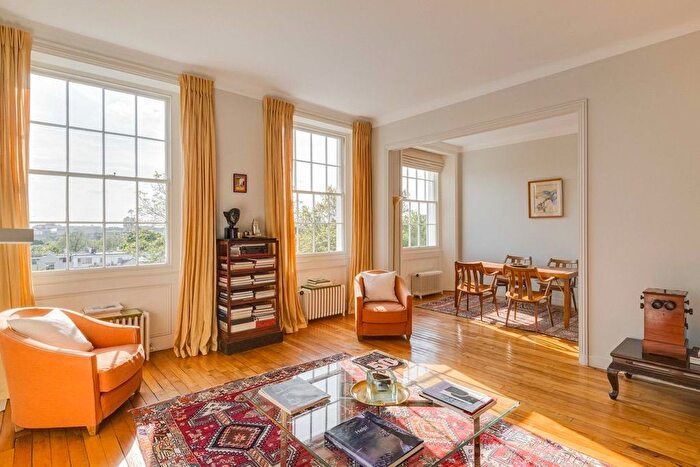
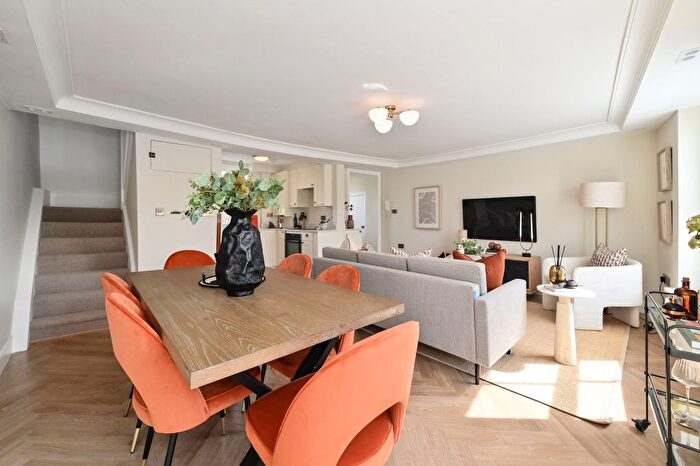
Properties in this part of Pembridge within London have an average house price of £2,499,327.00 and had 320 Property Transactions within the last 3 years¹. This area has 3,220 households² , where the most expensive property was sold for £44,750,000.00.
Properties for sale in Pembridge
Roads and Postcodes in Pembridge
Navigate through our locations to find the location of your next house in Pembridge, London for sale or to rent.
Transport near Pembridge
-
Notting Hill Gate Station
-
Bayswater Station
-
Queensway Station
-
Holland Park Station
-
Royal Oak Station
-
Ladbroke Grove Station
-
Westbourne Park Station
-
High Street Kensington Station
-
Latimer Road Station
-
Shepherds Bush Station
- FAQ
- Price Paid By Year
- Property Type Price
Frequently asked questions about Pembridge
What is the average price for a property for sale in Pembridge?
The average price for a property for sale in Pembridge is £2,499,327. This amount is 10% higher than the average price in London. There are 6,969 property listings for sale in Pembridge.
What streets have the most expensive properties for sale in Pembridge?
The streets with the most expensive properties for sale in Pembridge are Dawson Place at an average of £9,109,362, Pembridge Place at an average of £8,068,333 and Pembridge Square at an average of £6,930,705.
What streets have the most affordable properties for sale in Pembridge?
The streets with the most affordable properties for sale in Pembridge are Notting Hill Gate at an average of £772,361, Pembridge Gardens at an average of £953,886 and Clanricarde Gardens at an average of £979,528.
Which train stations are available in or near Pembridge?
The train station available in or near Pembridge is Shepherds Bush.
Which tube stations are available in or near Pembridge?
Some of the tube stations available in or near Pembridge are Notting Hill Gate, Bayswater and Queensway.
Property Price Paid in Pembridge by Year
The average sold property price by year was:
| Year | Average Sold Price | Price Change |
Sold Properties
|
|---|---|---|---|
| 2025 | £2,425,375 | 1% |
39 Properties |
| 2024 | £2,399,490 | -20% |
93 Properties |
| 2023 | £2,884,406 | 22% |
91 Properties |
| 2022 | £2,263,519 | -8% |
97 Properties |
| 2021 | £2,454,375 | 26% |
123 Properties |
| 2020 | £1,826,513 | -27% |
79 Properties |
| 2019 | £2,310,705 | -9% |
88 Properties |
| 2018 | £2,516,720 | 37% |
79 Properties |
| 2017 | £1,575,467 | -19% |
89 Properties |
| 2016 | £1,872,033 | -11% |
98 Properties |
| 2015 | £2,071,686 | 10% |
88 Properties |
| 2014 | £1,854,848 | 16% |
118 Properties |
| 2013 | £1,553,852 | 6% |
88 Properties |
| 2012 | £1,462,020 | 14% |
96 Properties |
| 2011 | £1,253,390 | -19% |
115 Properties |
| 2010 | £1,490,336 | 43% |
106 Properties |
| 2009 | £852,202 | -41% |
89 Properties |
| 2008 | £1,198,839 | 15% |
80 Properties |
| 2007 | £1,018,640 | 24% |
173 Properties |
| 2006 | £778,421 | 9% |
189 Properties |
| 2005 | £707,739 | 3% |
148 Properties |
| 2004 | £685,191 | -2% |
174 Properties |
| 2003 | £700,661 | 14% |
146 Properties |
| 2002 | £605,938 | -1% |
161 Properties |
| 2001 | £610,794 | 29% |
176 Properties |
| 2000 | £431,073 | -7% |
173 Properties |
| 1999 | £461,033 | 13% |
235 Properties |
| 1998 | £399,655 | 24% |
185 Properties |
| 1997 | £304,119 | 15% |
215 Properties |
| 1996 | £259,597 | 21% |
198 Properties |
| 1995 | £205,714 | - |
158 Properties |
Property Price per Property Type in Pembridge
Here you can find historic sold price data in order to help with your property search.
The average Property Paid Price for specific property types in the last three years are:
| Property Type | Average Sold Price | Sold Properties |
|---|---|---|
| Detached House | £18,141,078.00 | 8 Detached Houses |
| Terraced House | £5,239,265.00 | 47 Terraced Houses |
| Semi Detached House | £11,163,375.00 | 4 Semi Detached Houses |
| Flat | £1,393,705.00 | 261 Flats |

