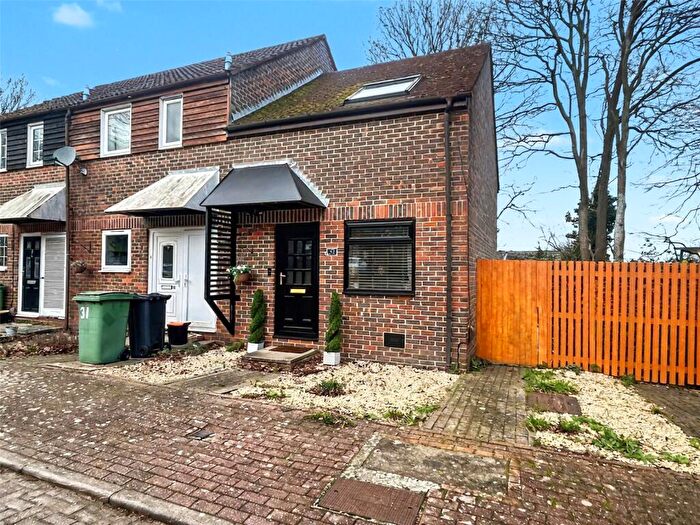
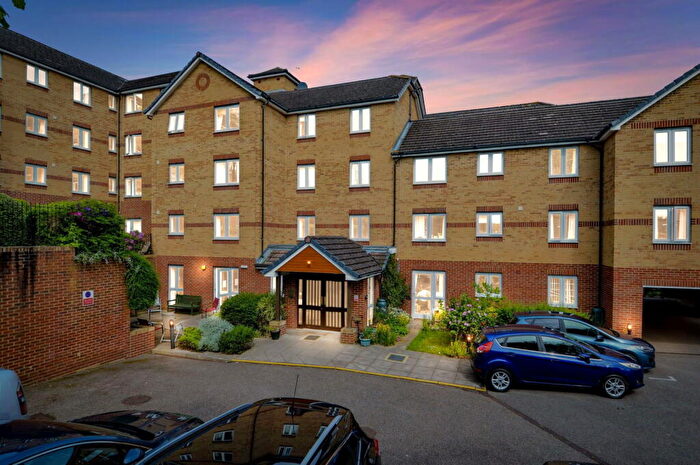
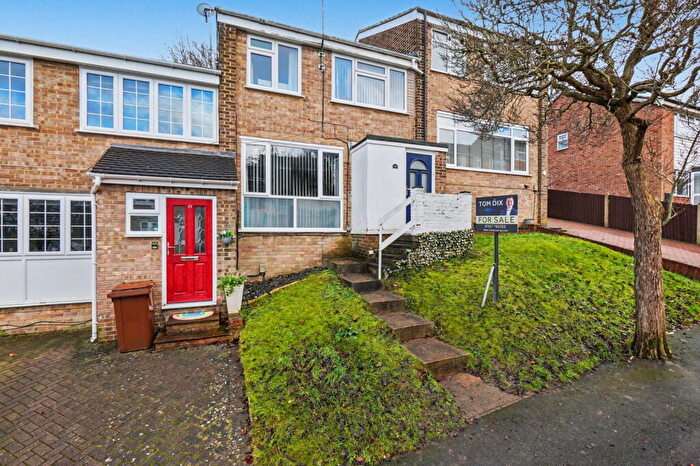
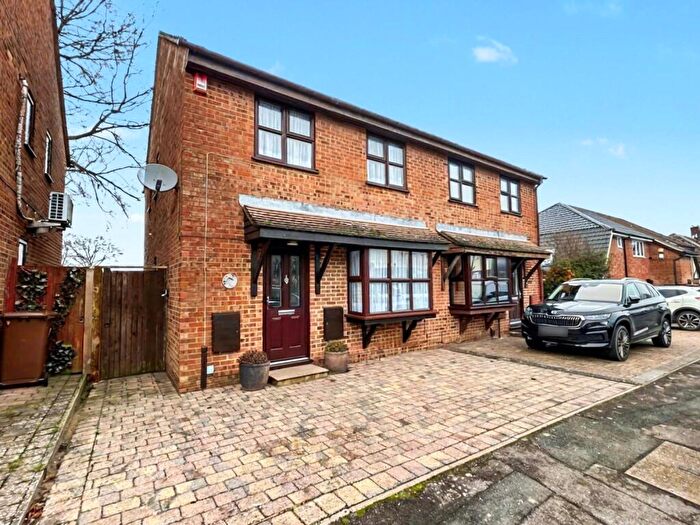
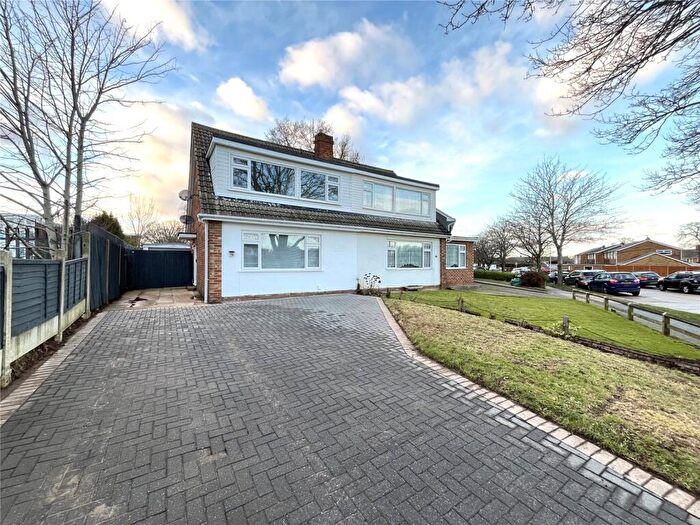
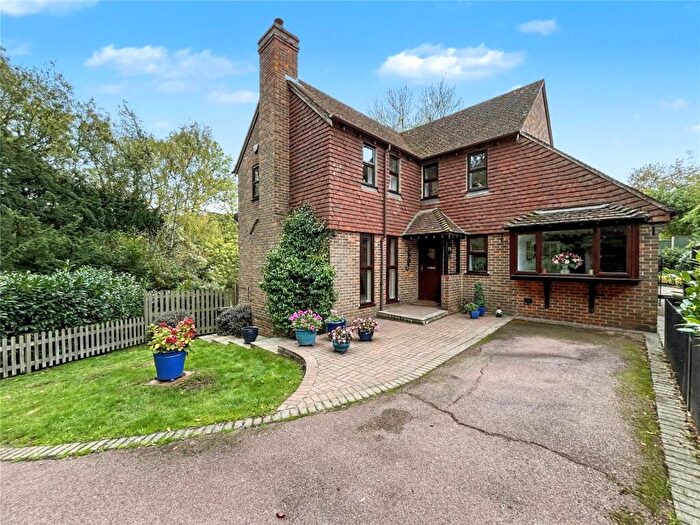
Houses for sale & to rent in Boxley, Chatham
House Prices in Boxley
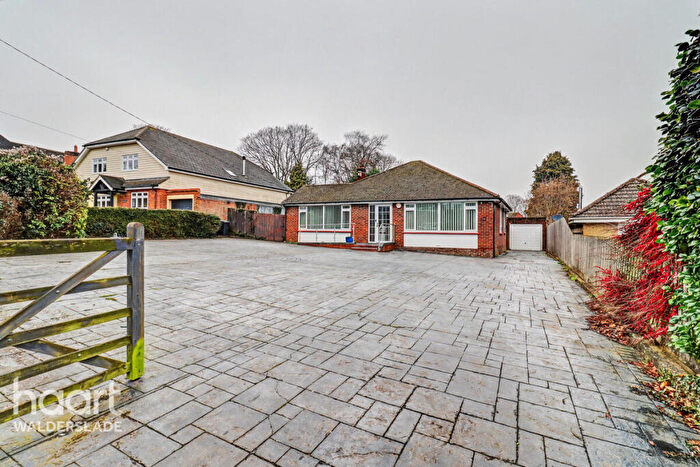
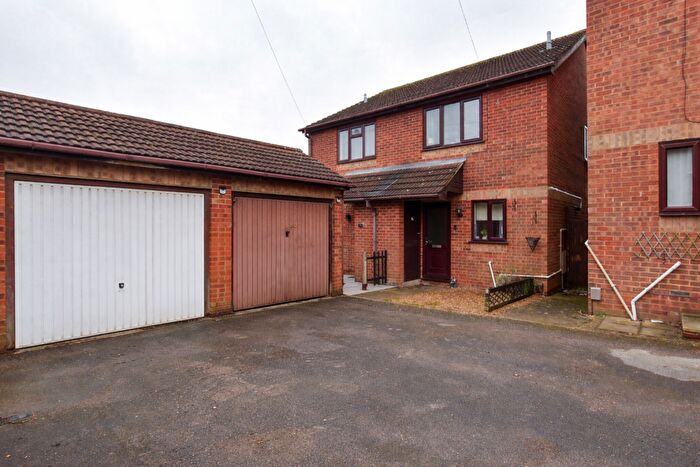
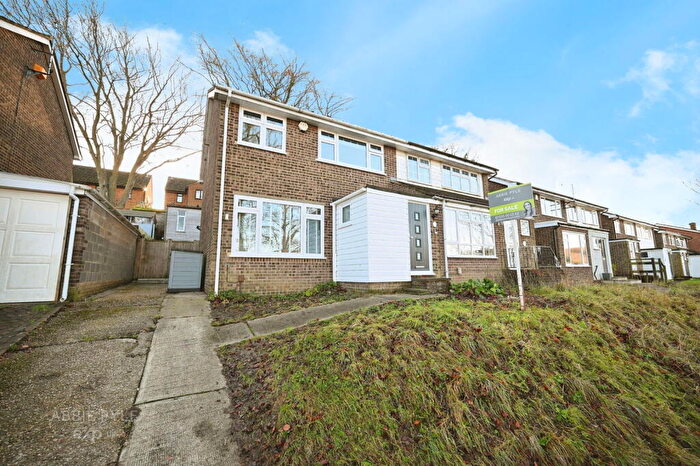
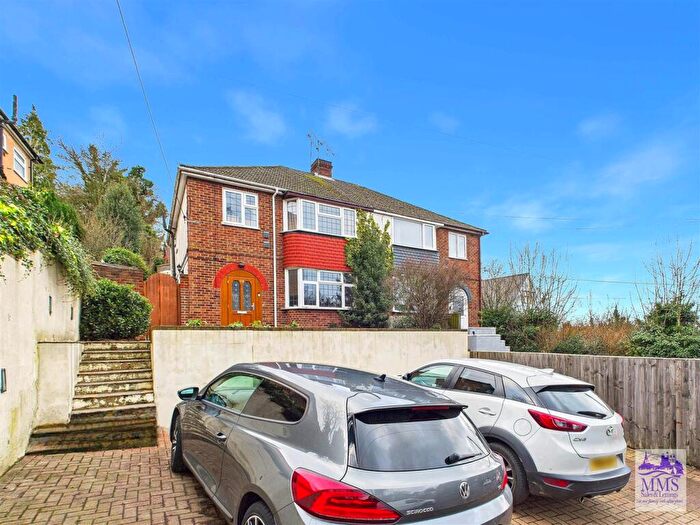
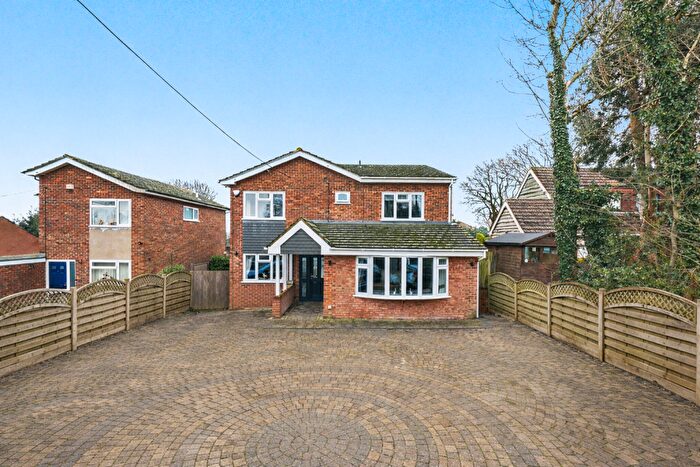
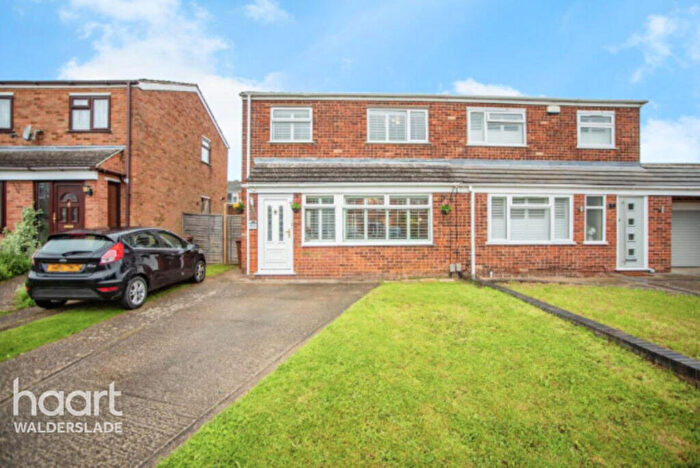
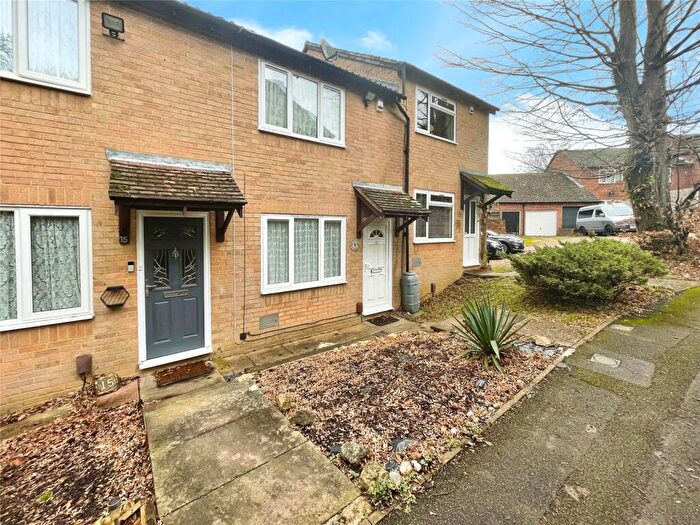
Properties in Boxley have an average house price of £348,230.00 and had 141 Property Transactions within the last 3 years¹.
Boxley is an area in Chatham, Kent with 1,434 households², where the most expensive property was sold for £1,000,000.00.
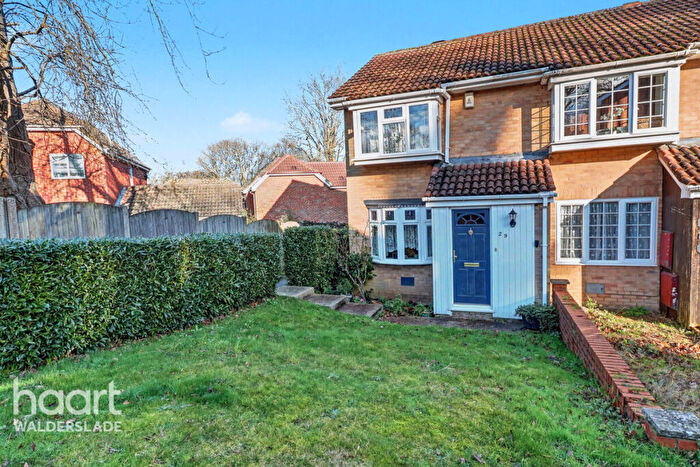
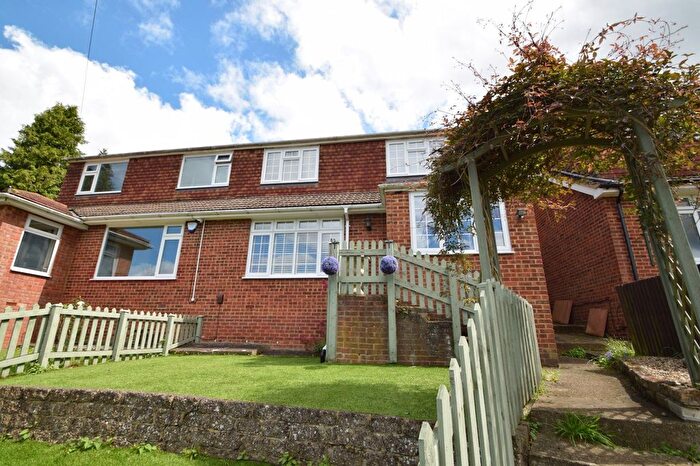
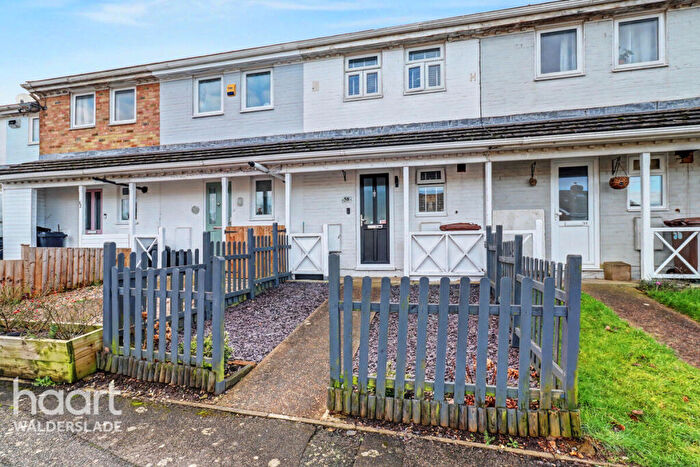
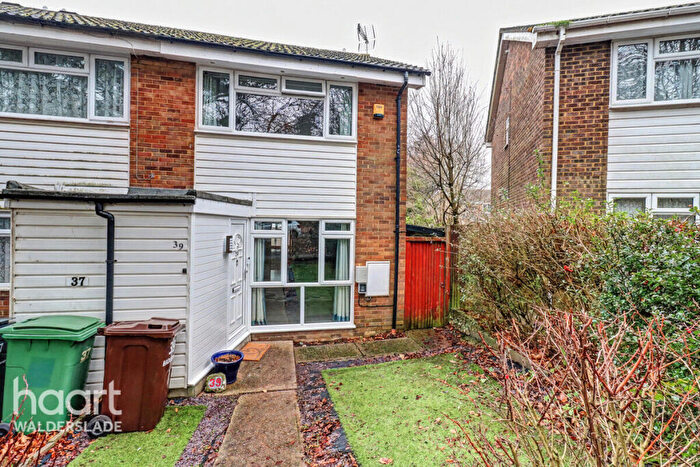
Properties for sale in Boxley
Roads and Postcodes in Boxley
Navigate through our locations to find the location of your next house in Boxley, Chatham for sale or to rent.
| Streets | Postcodes |
|---|---|
| Abigail Crescent | ME5 9DZ |
| Alexandra Glen | ME5 9EB |
| Aston Close | ME5 9JW |
| Autumn Glade | ME5 8XP |
| Badger Road | ME5 8TY ME5 8XR ME5 8XS |
| Beechmore Drive | ME5 9JL |
| Bellgrove Court | ME5 9PQ |
| Birch Drive | ME5 8YU |
| Boxley Road | ME5 9JD ME5 9JE ME5 9JG |
| Bracken Hill | ME5 9QQ |
| Brockbank Close | ME5 9US |
| Brownelow Copse | ME5 9JQ |
| Carpinus Close | ME5 9SS |
| Celestine Close | ME5 9NG |
| Chequers Close | ME5 9SR |
| Cinnabar Close | ME5 9PF |
| Conifer Drive | ME5 8XJ ME5 8XL |
| Cossington Road | ME5 9JB |
| Dale Court | ME5 9GX |
| Dogwood Close | ME5 8XW |
| Fagus Close | ME5 9DD |
| Feldspar Close | ME5 9LE |
| Fir Tree Grove | ME5 8XD |
| Forestdale Road | ME5 9NB |
| Galena Close | ME5 9NE |
| Gean Close | ME5 9DB |
| Gleaming Wood Drive | ME5 8XT ME5 8XX ME5 8XY ME5 8RF ME5 8RZ |
| Golden Wood Close | ME5 8XA |
| Goldstone Walk | ME5 9QB |
| Greensands | ME5 9DQ |
| Impton Lane | ME5 9EE ME5 9PG |
| Iris Close | ME5 9QD |
| Larchwood Close | ME5 8XB |
| Leybourne Close | ME5 9JN |
| Malus Close | ME5 9SU |
| Mayfield Close | ME5 9QZ |
| Micawber Close | ME5 9JZ |
| Olivine Close | ME5 9NQ |
| Orbit Close | ME5 9NF |
| Pinewood Drive | ME5 8XU |
| Ploughmans Way | ME5 9DE |
| Podkin Wood | ME5 9LY |
| Pyrus Close | ME5 9QF |
| Quinion Close | ME5 9JS |
| Round Wood Close | ME5 9UL |
| Samara Close | ME5 9QW |
| Sandstone Rise | ME5 9DH |
| Saracen Fields | ME5 9DG |
| Silver Tree Close | ME5 9ST |
| Spenlow Drive | ME5 9JT |
| Springate Close | ME5 9RY |
| Sylvan Glade | ME5 9PW |
| The Covert | ME5 9JJ |
| The Spinney | ME5 9JP |
| Timbertops | ME5 8XF ME5 8XQ |
| Travertine Road | ME5 9LQ |
| Trotwood Close | ME5 9JU |
| Tufa Close | ME5 9LU |
| Violet Close | ME5 9ND |
| Wildfell Close | ME5 9RU |
| Woodlands | ME5 9JX |
| Yew Tree Close | ME5 8XN |
Transport near Boxley
-
Chatham Station
-
Aylesford Station
-
Maidstone East Station
-
New Hythe Station
-
Snodland Station
-
Maidstone Barracks Station
-
Gillingham (Kent) Station
-
Rochester Station
-
Barming Station
-
Rainham (Kent) Station
- FAQ
- Price Paid By Year
- Property Type Price
Frequently asked questions about Boxley
What is the average price for a property for sale in Boxley?
The average price for a property for sale in Boxley is £348,230. This amount is 10% lower than the average price in Chatham. There are 998 property listings for sale in Boxley.
What streets have the most expensive properties for sale in Boxley?
The streets with the most expensive properties for sale in Boxley are Dale Court at an average of £872,500, Podkin Wood at an average of £746,666 and Abigail Crescent at an average of £565,000.
What streets have the most affordable properties for sale in Boxley?
The streets with the most affordable properties for sale in Boxley are Iris Close at an average of £208,500, Larchwood Close at an average of £223,200 and Dogwood Close at an average of £225,375.
Which train stations are available in or near Boxley?
Some of the train stations available in or near Boxley are Chatham, Aylesford and Maidstone East.
Property Price Paid in Boxley by Year
The average sold property price by year was:
| Year | Average Sold Price | Price Change |
Sold Properties
|
|---|---|---|---|
| 2025 | £360,870 | 4% |
62 Properties |
| 2024 | £347,415 | 6% |
47 Properties |
| 2023 | £324,937 | -19% |
32 Properties |
| 2022 | £386,893 | 10% |
75 Properties |
| 2021 | £347,877 | 8% |
86 Properties |
| 2020 | £320,164 | 4% |
50 Properties |
| 2019 | £306,952 | -2% |
58 Properties |
| 2018 | £313,119 | -6% |
92 Properties |
| 2017 | £330,934 | 15% |
84 Properties |
| 2016 | £281,400 | 13% |
79 Properties |
| 2015 | £245,584 | 11% |
71 Properties |
| 2014 | £218,678 | 11% |
67 Properties |
| 2013 | £194,815 | -0,2% |
69 Properties |
| 2012 | £195,226 | 5% |
53 Properties |
| 2011 | £184,774 | -11% |
48 Properties |
| 2010 | £205,468 | 16% |
47 Properties |
| 2009 | £172,695 | -24% |
60 Properties |
| 2008 | £213,556 | 11% |
49 Properties |
| 2007 | £190,882 | 4% |
91 Properties |
| 2006 | £182,721 | -2% |
128 Properties |
| 2005 | £186,465 | 8% |
81 Properties |
| 2004 | £172,455 | 1% |
120 Properties |
| 2003 | £170,555 | 23% |
124 Properties |
| 2002 | £131,004 | 15% |
146 Properties |
| 2001 | £111,497 | 10% |
118 Properties |
| 2000 | £100,604 | 12% |
107 Properties |
| 1999 | £88,515 | 3% |
125 Properties |
| 1998 | £85,519 | 10% |
135 Properties |
| 1997 | £76,785 | 7% |
132 Properties |
| 1996 | £71,200 | -4% |
104 Properties |
| 1995 | £73,795 | - |
83 Properties |
Property Price per Property Type in Boxley
Here you can find historic sold price data in order to help with your property search.
The average Property Paid Price for specific property types in the last three years are:
| Property Type | Average Sold Price | Sold Properties |
|---|---|---|
| Semi Detached House | £316,067.00 | 38 Semi Detached Houses |
| Detached House | £487,738.00 | 42 Detached Houses |
| Terraced House | £272,213.00 | 61 Terraced Houses |

