
Houses for sale in Kent, England
House Prices in Kent
Properties in Kent have
an average house price of
£393k
and had 66,513 Property Transactions
within the last 3 years.¹
Kent is a location in
England with
650,199 households², where the most expensive property was sold for £10M.
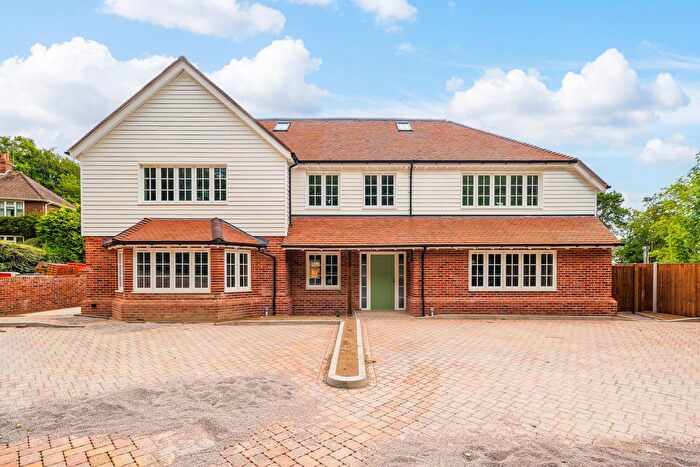
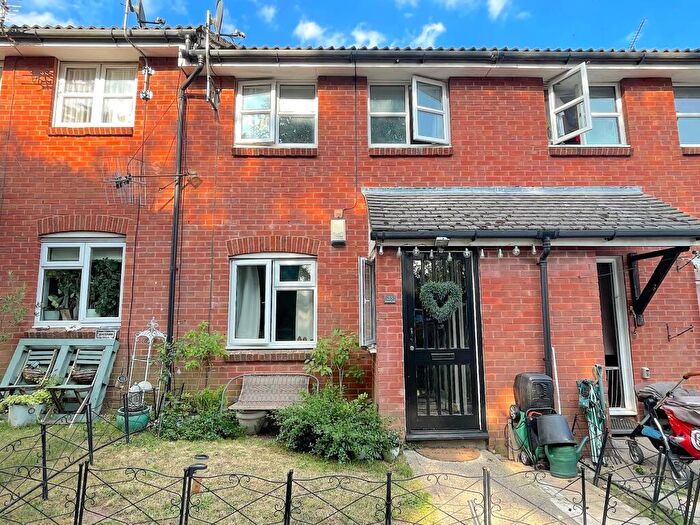
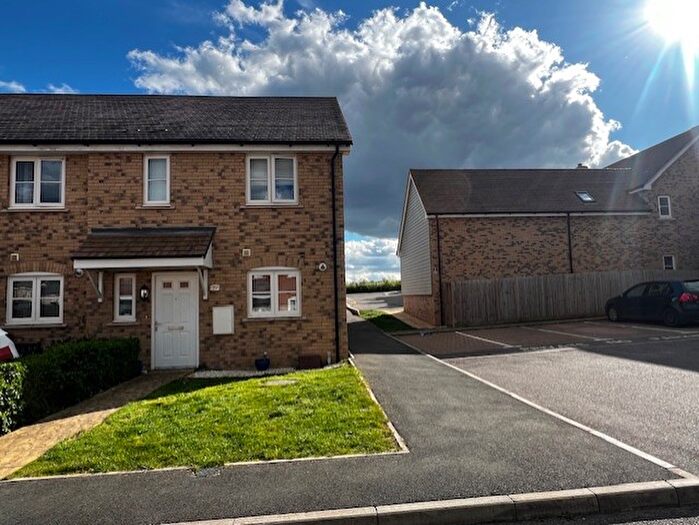
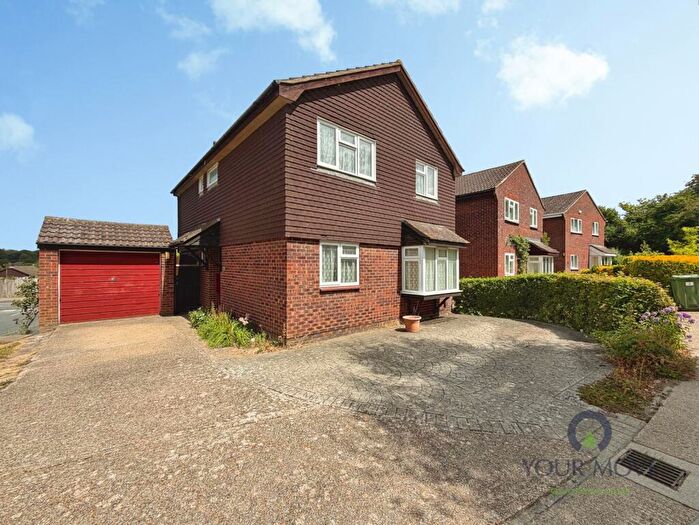
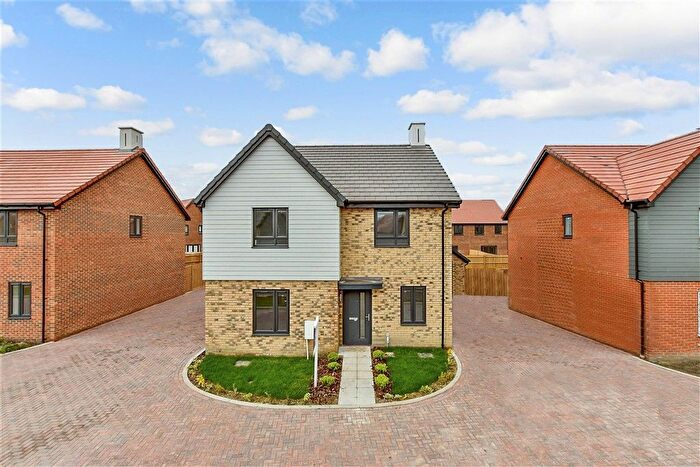
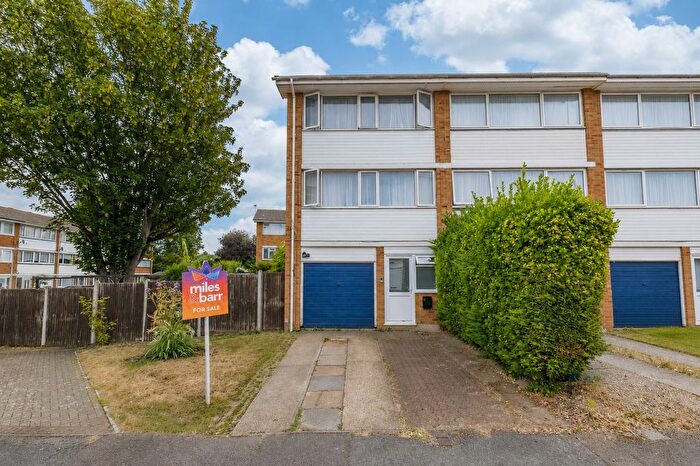
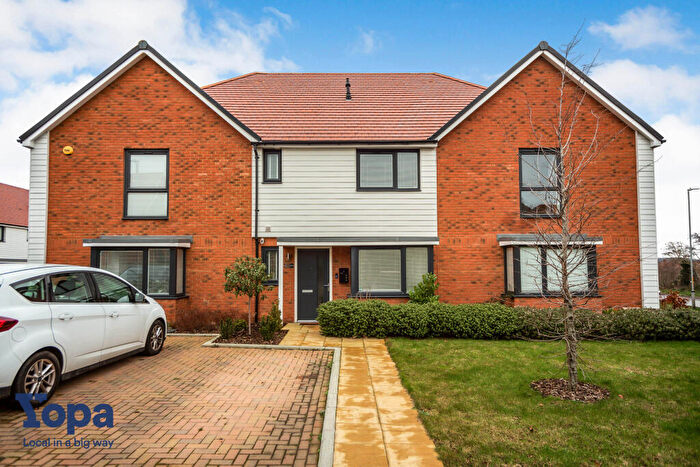
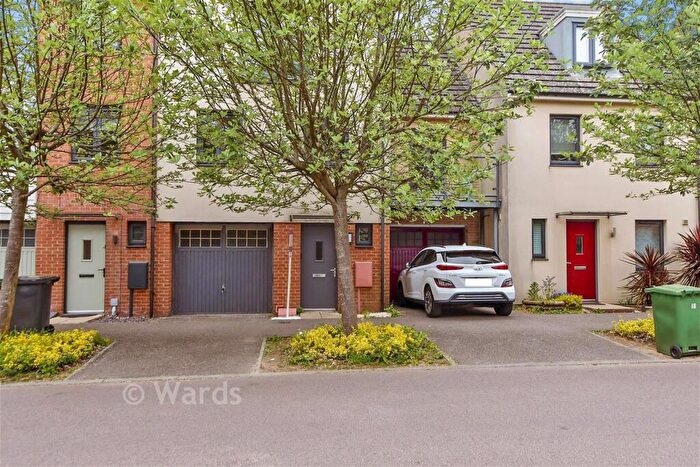
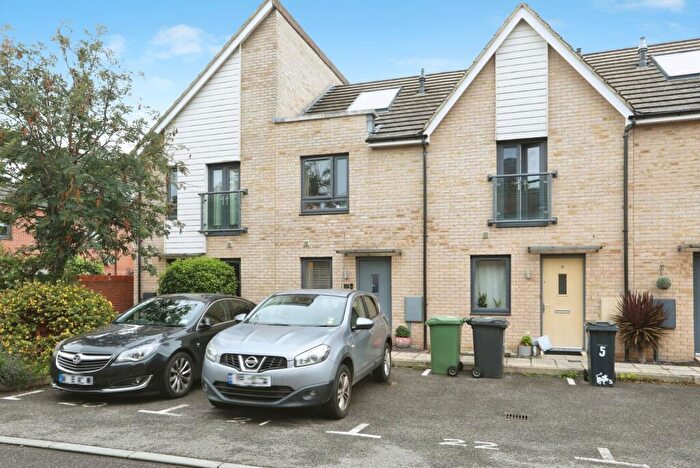
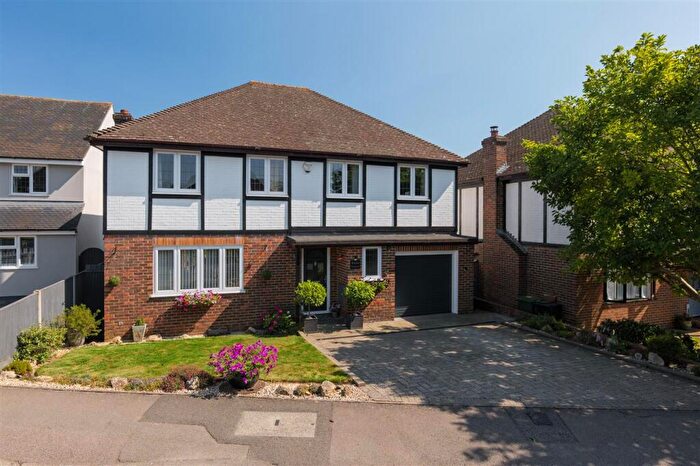
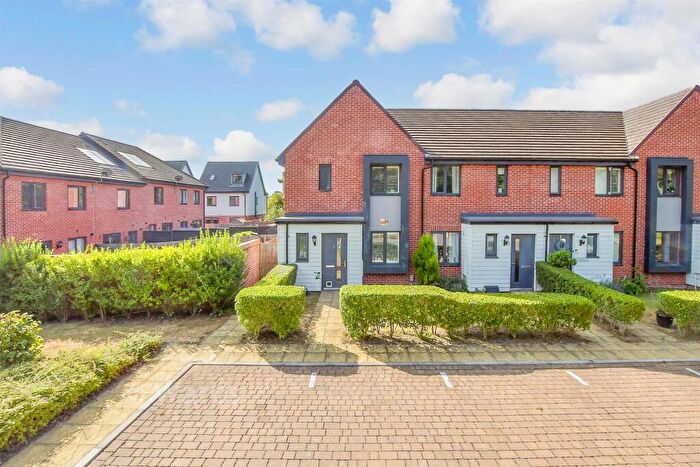
Properties for sale in Kent
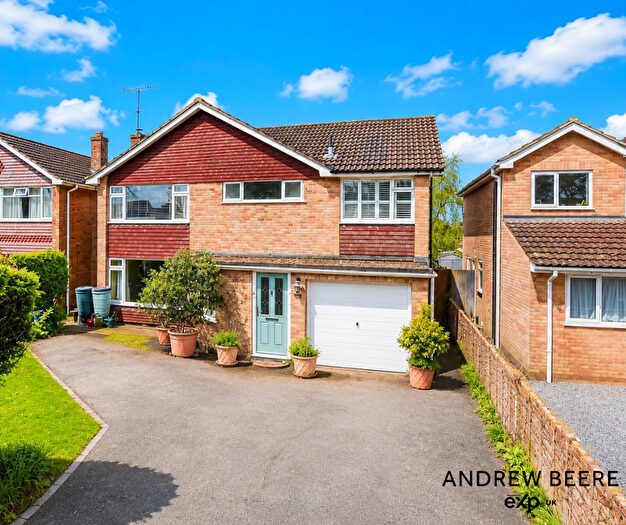
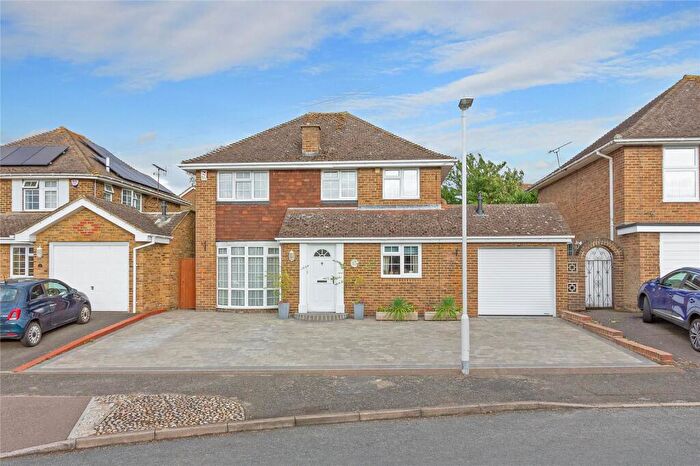
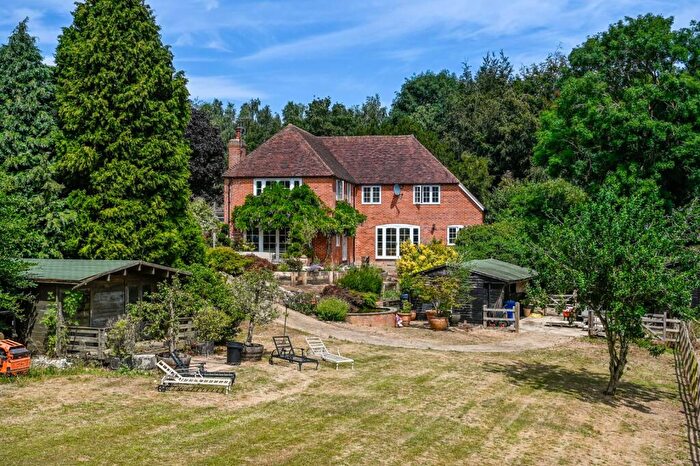
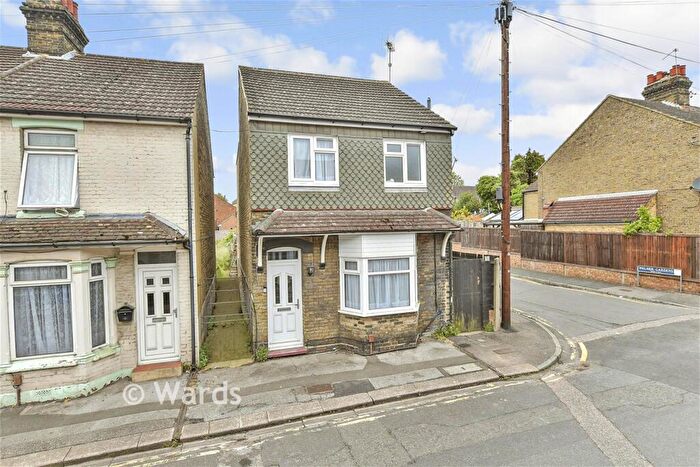
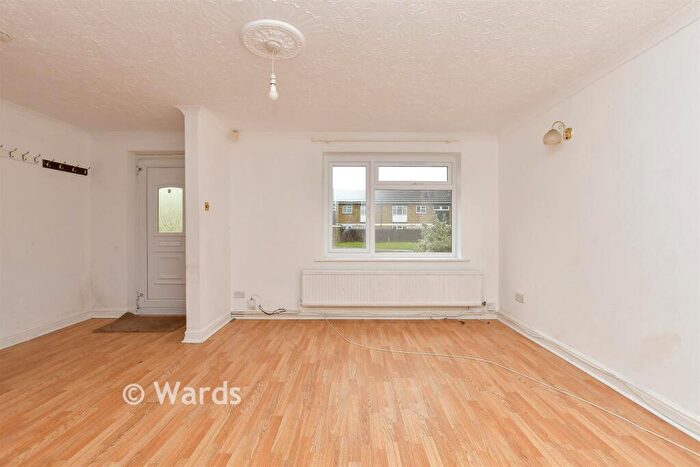
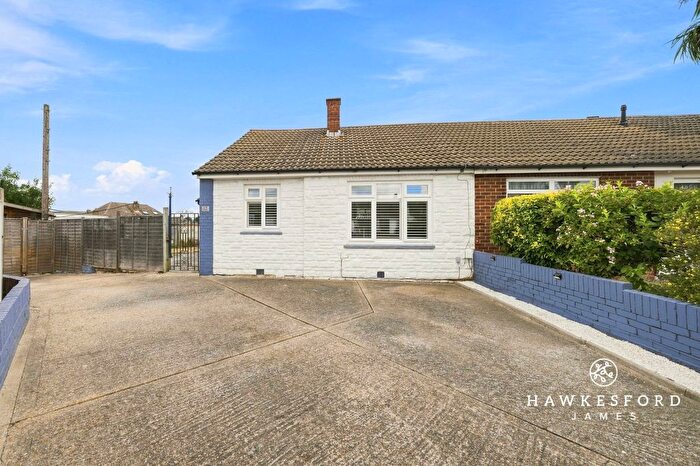
![]()
If you are looking to sell your house, let it out, or receive a property valuation, an expert can help you.
Click the button below to get started.


Towns in Kent
Navigate through our locations to find the location of your next house in Kent, England for sale or to rent.
- Deal
- Dover
- Stone
- Sandwich
- Ramsgate
- Westerham
- Ashford
- Sidcup
- Margate
- Bexley
- Tenterden
- Greenhithe
- Sevenoaks
- Orpington
- Gillingham
- Tonbridge
- Folkestone
- Dartford
- Chatham
- Canterbury
- Rye
- Gravesend
- Aylesford
- West Malling
- Swanscombe
- Belvedere
- Romney Marsh
- New Romney
- Broadstairs
- Rochester
- Edenbridge
- Herne Bay
- Maidstone
- Snodland
- Whitstable
- Queenborough
- Sheerness
- Tunbridge Wells
- Westgate-on-sea
- Wadhurst
- Hythe
- Longfield
- Sittingbourne
- Swanley
- Birchington
- Faversham
- Cranbrook
Property price trends in Kent
According to the latest Land Registry data, the average home in Kent sold for £376,145 in 2026. That figure comes from a substantial record of 839,104 sales logged over the past 31 years.
Prices have softened over the last three years. Compared with 2023, when the typical sale came in around £394,887, that's a fall of roughly 4.7%.
Looking back five years, average prices are down about 2.1% since 2021, a drop of around £7,927 in cash terms.
Zoom out to the past decade for the fuller picture. Back in 2016, homes here averaged £300,514, so the typical sold price has climbed about 25.2% since then, roughly 2.3% a year. Stretch the view to fifteen years and that annual pace edges up closer to 3.2%.
Frequently asked questions about Kent
What is the average price for a property for sale in Kent?
The average price for a property for sale in Kent is £392,727. This amount is 9% higher than the average price in England. There are more than 10,000 property listings for sale in Kent.
What locations have the most expensive properties for sale in Kent?
The locations with the most expensive properties for sale in Kent are Orpington at an average of £824,011, Wadhurst at an average of £811,500 and Sevenoaks at an average of £732,210.
What locations have the most affordable properties for sale in Kent?
The locations with the most affordable properties for sale in Kent are Queenborough at an average of £235,173, Ramsgate at an average of £277,493 and Dover at an average of £278,406.
Which train stations are available in or near Kent?
Some of the train stations available in or near Kent are Lenham, Harrietsham and Charing.
Property Price Paid in Kent by Year
The average sold property price by year was:
| Year | Average Sold Price | Price Change |
Sold Properties
|
|---|---|---|---|
| 2026 | £376,145 | -6% |
4,080 Properties |
| 2025 | £397,532 | 2% |
22,422 Properties |
| 2024 | £388,938 | -2% |
21,266 Properties |
| 2023 | £394,887 | -3% |
18,745 Properties |
| 2022 | £406,345 | 5% |
25,371 Properties |
| 2021 | £384,072 | 7% |
33,699 Properties |
| 2020 | £359,102 | 6% |
23,572 Properties |
| 2019 | £337,173 | 1% |
25,475 Properties |
| 2018 | £334,348 | 4% |
27,243 Properties |
| 2017 | £319,821 | 6% |
29,541 Properties |
Property Price per Property Type in Kent
Here you can find historic sold price data in order to help with your property search.
The average Property Paid Price for specific property types in the last three years are:
| Property Type | Average Sold Price | Sold Properties |
|---|---|---|
| Semi Detached House | £392,469.00 | 19,192 Semi Detached Houses |
| Terraced House | £315,586.00 | 20,110 Terraced Houses |
| Detached House | £634,533.00 | 15,070 Detached Houses |
| Flat | £220,765.00 | 12,141 Flats |
Transport in Kent
Please see below transportation links in this area:
