
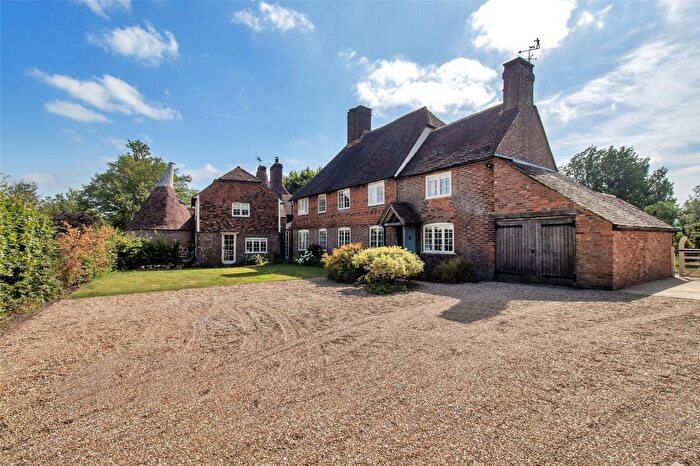
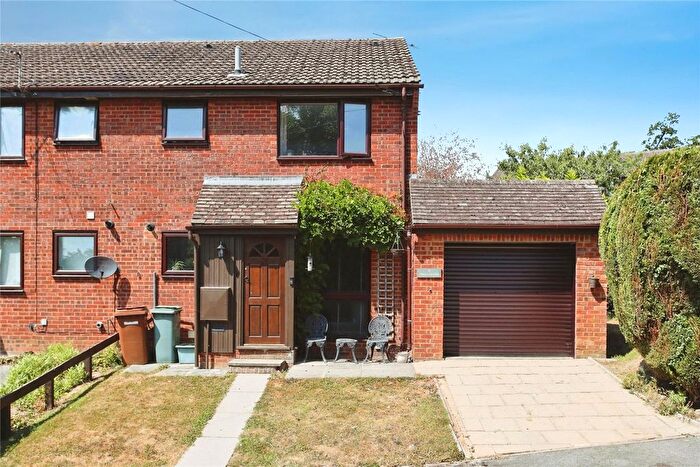
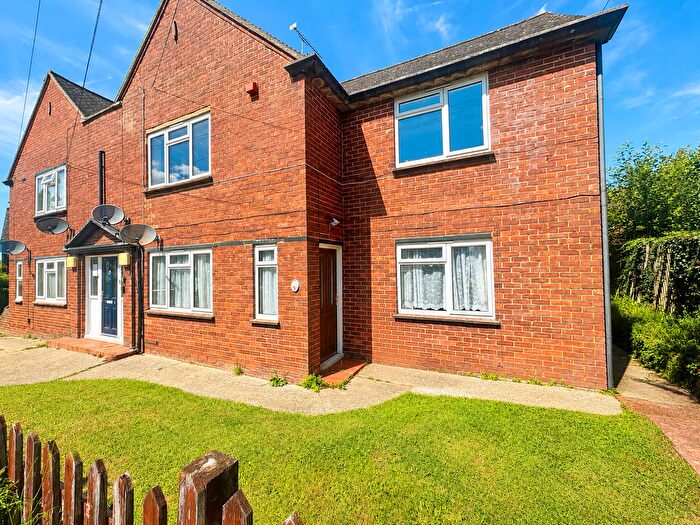
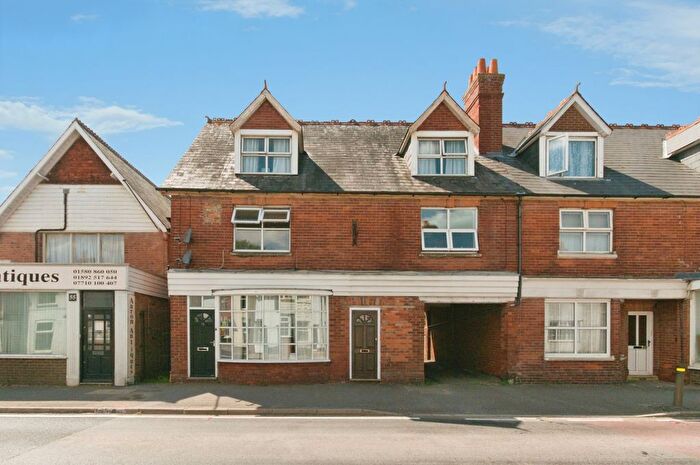
Houses for sale in Cranbrook, Kent
House Prices in Cranbrook
Properties in Cranbrook have an average house price of £543k and had 697 Property Transactions within the last 3 years.¹
Cranbrook is an area in Kent with 8,507 households², where the most expensive property was sold for £3.96M.
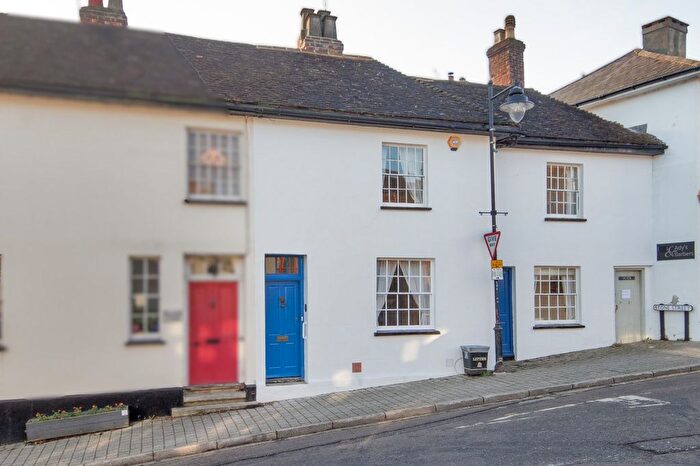
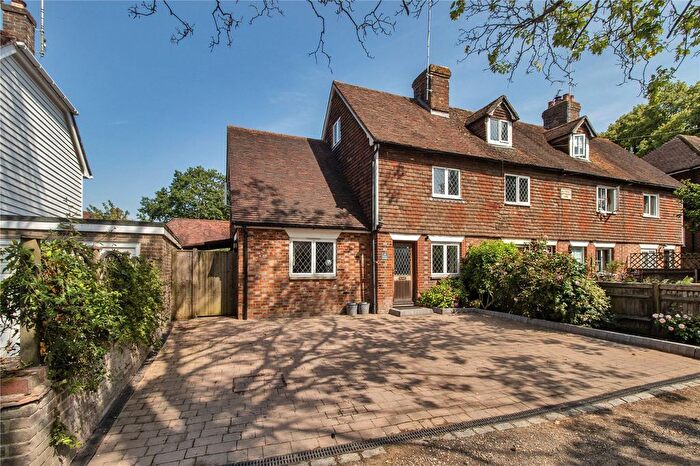
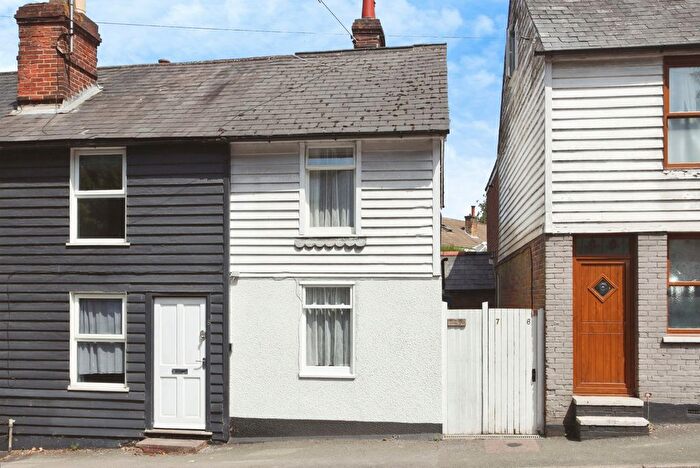
Properties for sale in Cranbrook
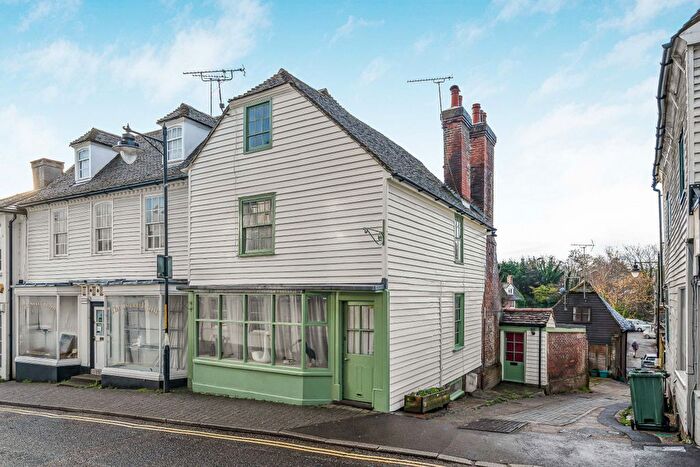
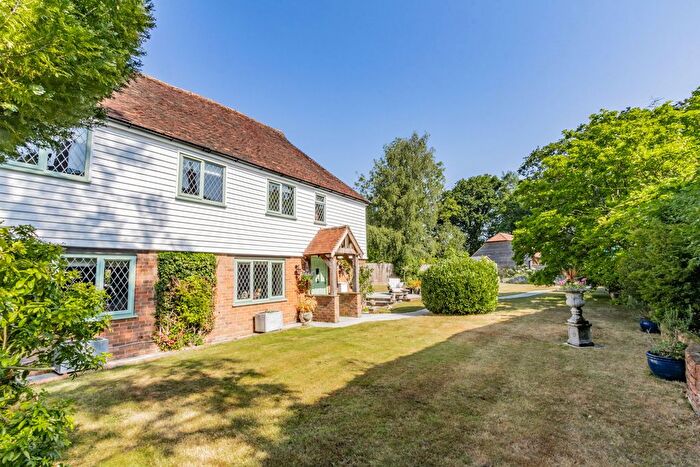
![]()
If you are looking to sell your house, let it out, or receive a property valuation, an expert can help you.
Click the button below to get started.
Neighbourhoods in Cranbrook
Navigate through our locations to find the location of your next house in Cranbrook, Kent for sale or to rent.
Property price trends in Cranbrook
According to the latest Land Registry data, the average home in Cranbrook sold for £542,022 in 2026. That figure comes from a substantial record of 9,228 sales logged over the past 31 years.
Prices have softened over the last three years. Compared with 2023, when the typical sale came in around £569,787, that's a fall of roughly 4.9%.
Looking back five years, average prices are up about 0.8% since 2021, a gain of around £4,377 in cash terms.
Zoom out to the past decade for the fuller picture. Back in 2016, homes here averaged £473,876, so the typical sold price has climbed about 14.4% since then, roughly 1.4% a year. Stretch the view to fifteen years and that annual pace edges up closer to 2.5%.
Frequently asked questions about Cranbrook
What is the average price for a property for sale in Cranbrook?
The average price for a property for sale in Cranbrook is £542,756. This amount is 38% higher than the average price in Kent. There are 5,580 property listings for sale in Cranbrook.
What locations have the most expensive properties for sale in Cranbrook?
The locations with the most expensive properties for sale in Cranbrook are Frittenden And Sissinghurst at an average of £685,592, Goudhurst And Lamberhurst at an average of £600,650 and Rolvenden & Tenterden West at an average of £565,000.
What locations have the most affordable properties for sale in Cranbrook?
The locations with the most affordable properties for sale in Cranbrook are Staplehurst at an average of £250,000, Hawkhurst And Sandhurst at an average of £492,755 and Benenden And Cranbrook at an average of £521,555.
Which train stations are available in or near Cranbrook?
Some of the train stations available in or near Cranbrook are Etchingham, Staplehurst and Marden.
Property Price Paid in Cranbrook by Year
The average sold property price by year was:
| Year | Average Sold Price | Price Change |
Sold Properties
|
|---|---|---|---|
| 2026 | £542,022 | 6% |
18 Properties |
| 2025 | £511,245 | -6% |
211 Properties |
| 2024 | £543,752 | -5% |
230 Properties |
| 2023 | £569,787 | 3% |
238 Properties |
| 2022 | £552,036 | 3% |
261 Properties |
| 2021 | £537,645 | 9% |
430 Properties |
| 2020 | £489,753 | -1% |
309 Properties |
| 2019 | £496,066 | 6% |
300 Properties |
| 2018 | £467,783 | -4% |
259 Properties |
| 2017 | £488,529 | 3% |
294 Properties |
Property Price per Property Type in Cranbrook
Here you can find historic sold price data in order to help with your property search.
The average Property Paid Price for specific property types in the last three years are:
| Property Type | Average Sold Price | Sold Properties |
|---|---|---|
| Semi Detached House | £433,786.00 | 239 Semi Detached Houses |
| Detached House | £851,959.00 | 240 Detached Houses |
| Terraced House | £345,456.00 | 158 Terraced Houses |
| Flat | £259,569.00 | 60 Flats |
Transport in Cranbrook
Please see below transportation links in this area:
