
Houses for sale in Castle, Dartford
House Prices in Castle
Properties in Castle have an average house price of £274k and had 38 Property Transactions within the last 3 years¹.
Castle is an area in Dartford, Kent with 275 households², where the most expensive property was sold for £625k.
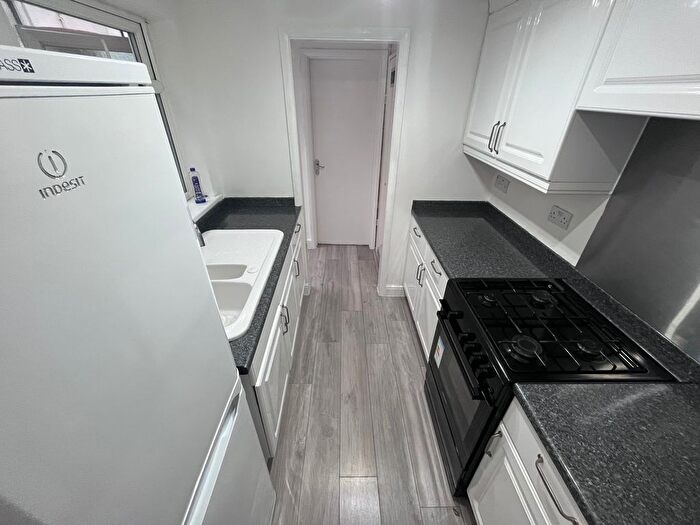
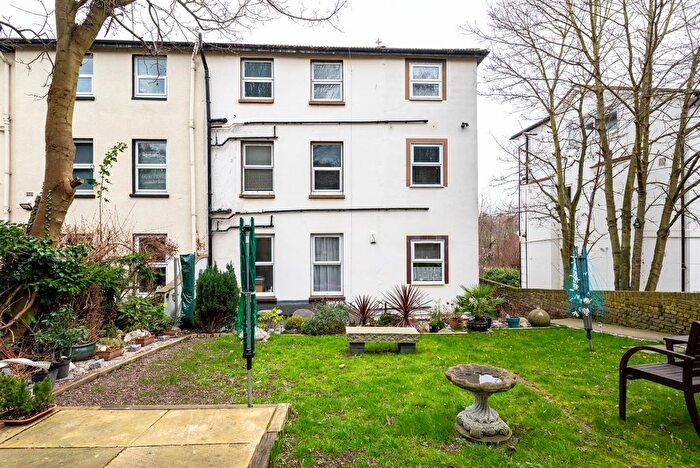
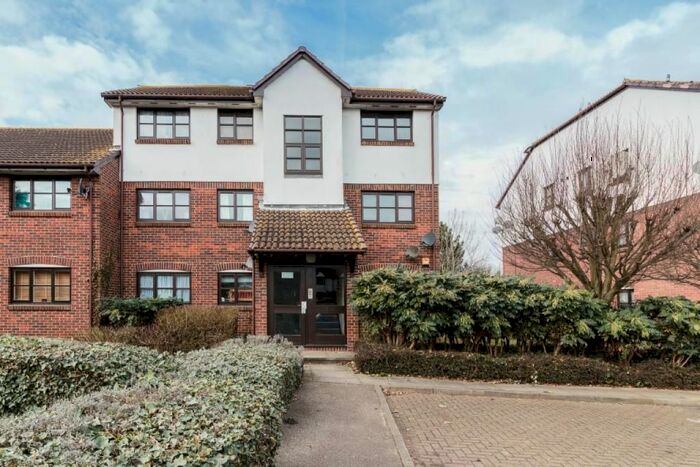
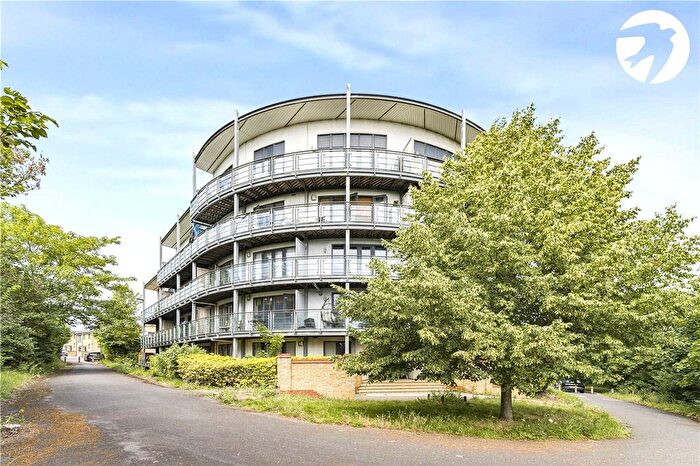
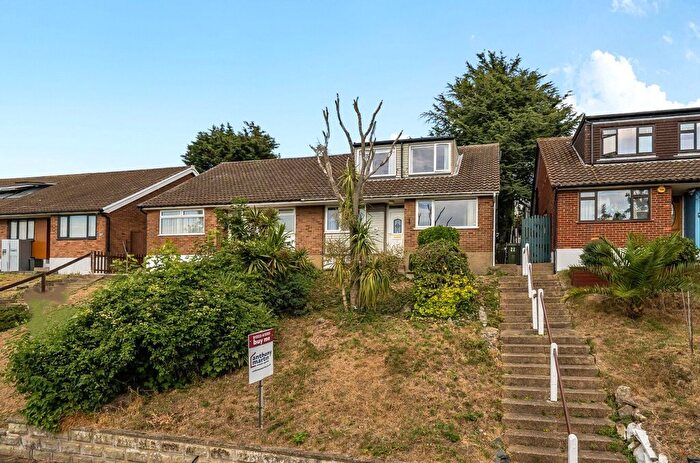
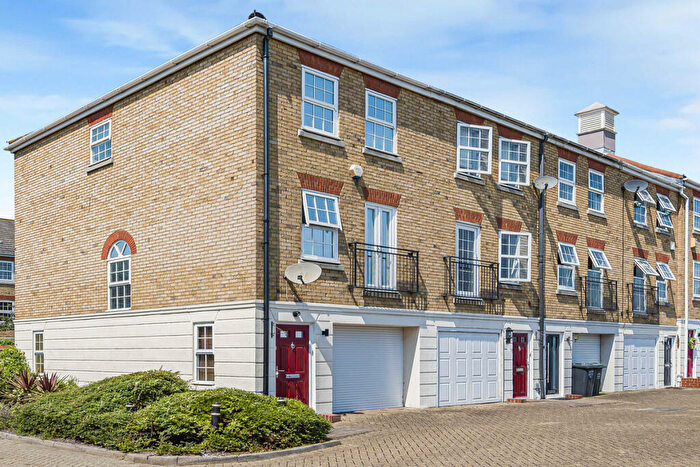
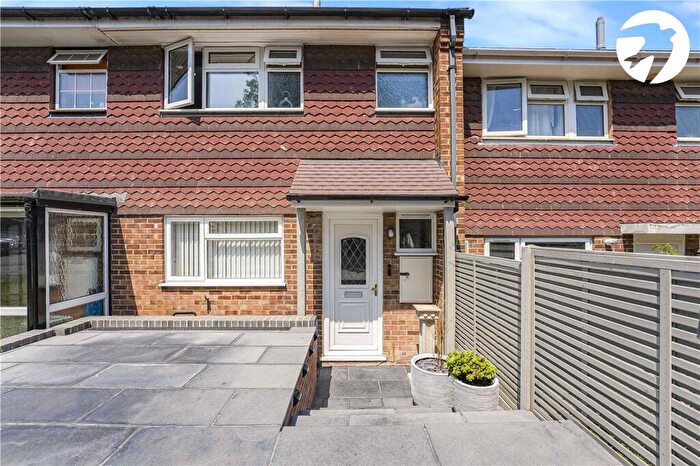
Properties for sale in Castle
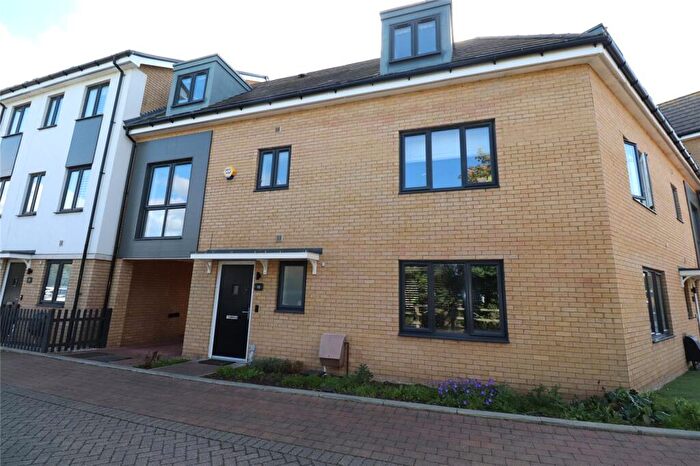

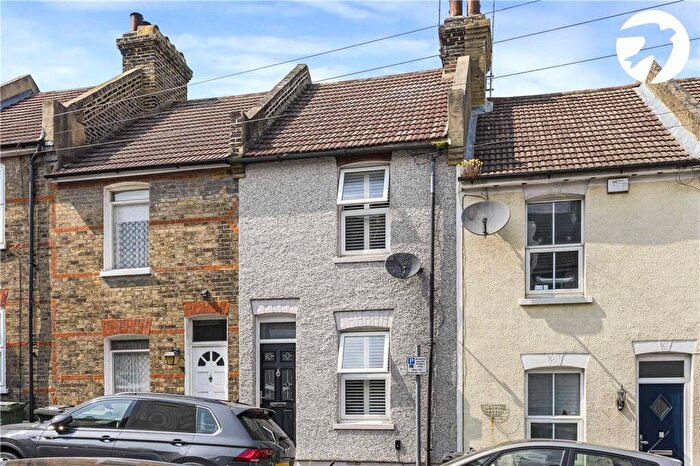
![]()
If you are looking to sell your house, let it out, or receive a property valuation, an expert can help you.
Click the button below to get started.

Roads and Postcodes in Castle
Navigate through our locations to find the location of your next house in Castle, Dartford for sale or to rent.
| Streets | Postcodes |
|---|---|
| Brambling Close | DA9 9TA |
| Fieldfare Lane | DA9 9UN DA9 9UP |
| Redwing Crescent | DA9 9TE |
| Skylark Avenue | DA9 9TS |
| Stonechat Mews | DA9 9TY |
| The Rise | DA9 9TF |
| Waterstone Way | DA9 9TB DA9 9TU DA9 9TW DA9 9UB |
| Wolsey Crescent | DA9 9TG |
| Woodpecker Drive | DA9 9TX DA9 9UA |
Property price trends in Castle
According to the latest Land Registry data, the average home in Castle sold for £262,464 in 2025. That figure comes from 509 sales logged over the past 19 years.
Prices have fallen back over the last three years. Compared with 2022, when the typical sale came in around £282,450, that's a fall of roughly 7.1%.
Looking back five years, average prices are down about 6.1% since 2020, a drop of around £16,947 in cash terms.
Zoom out to the past decade for the fuller picture. Back in 2015, homes here averaged £214,303, so the typical sold price has climbed about 22.5% since then, roughly 2% a year. Stretch the view to fifteen years and that annual pace eases back to about 0.9%.
Frequently asked questions about Castle
What is the average price for a property for sale in Castle?
The average price for a property for sale in Castle is £273,741. This amount is 29% lower than the average price in Dartford. There are 1,303 property listings for sale in Castle.
What streets have the most expensive properties for sale in Castle?
The streets with the most expensive properties for sale in Castle are The Rise at an average of £418,000, Waterstone Way at an average of £310,357 and Skylark Avenue at an average of £242,500.
What streets have the most affordable properties for sale in Castle?
The streets with the most affordable properties for sale in Castle are Woodpecker Drive at an average of £132,312 and Redwing Crescent at an average of £236,416.
Which train stations are available in or near Castle?
Some of the train stations available in or near Castle are Greenhithe, Stone Crossing and Swanscombe.
Property Price Paid in Castle by Year
The average sold property price by year was:
| Year | Average Sold Price | Price Change |
Sold Properties
|
|---|---|---|---|
| 2025 | £262,464 | -2% |
10 Properties |
| 2024 | £268,515 | -8% |
16 Properties |
| 2023 | £290,108 | 3% |
12 Properties |
| 2022 | £282,450 | 13% |
10 Properties |
| 2021 | £244,696 | -14% |
42 Properties |
| 2020 | £279,411 | 13% |
17 Properties |
| 2019 | £243,171 | -28% |
19 Properties |
| 2018 | £310,909 | 14% |
11 Properties |
| 2017 | £266,361 | 5% |
18 Properties |
| 2016 | £252,928 | 15% |
28 Properties |
Property Price per Property Type in Castle
Here you can find historic sold price data in order to help with your property search.
The average Property Paid Price for specific property types in the last three years are:
| Property Type | Average Sold Price | Sold Properties |
|---|---|---|
| Semi Detached House | £545,000.00 | 3 Semi Detached Houses |
| Terraced House | £427,100.00 | 5 Terraced Houses |
| Flat | £221,056.00 | 30 Flats |
