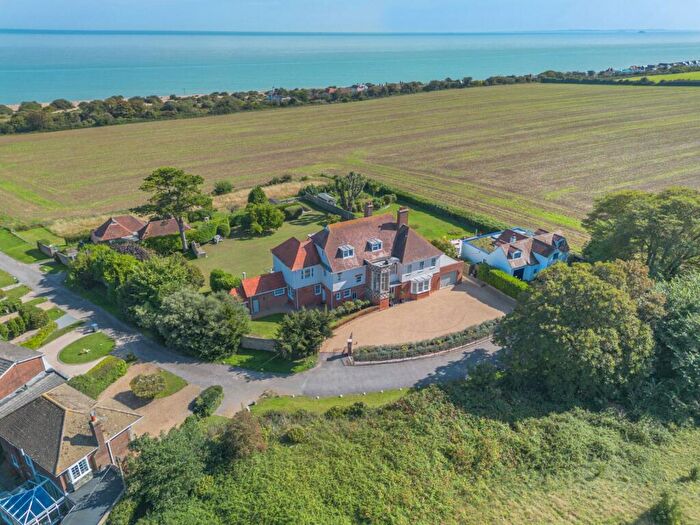
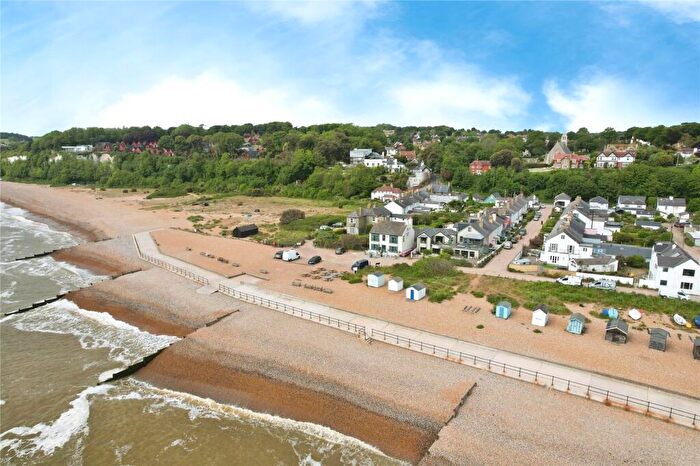
Houses for sale & to rent in Ringwould, Deal
House Prices in Ringwould
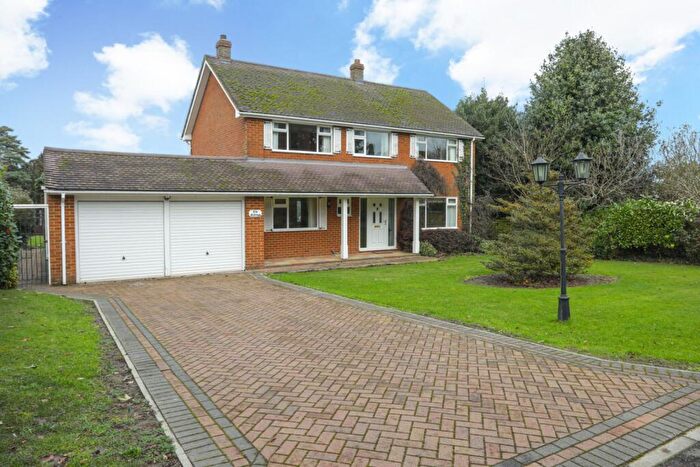
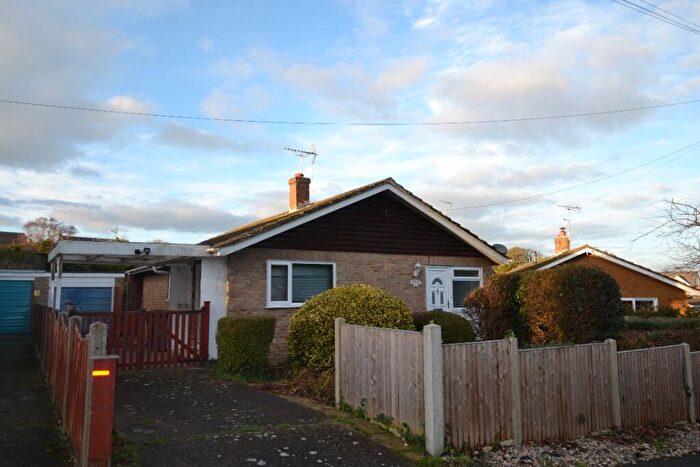
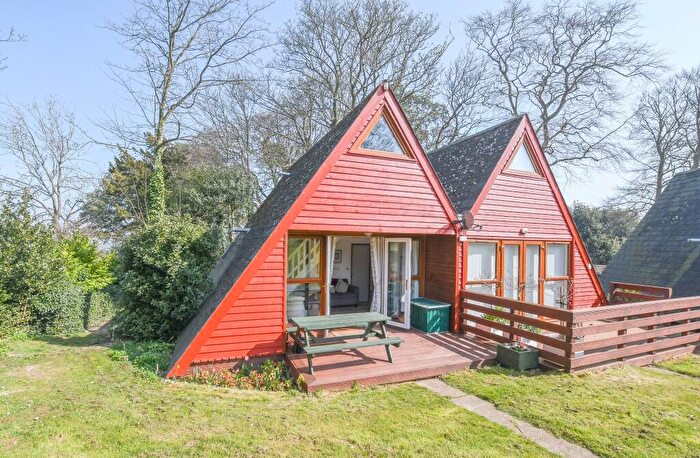
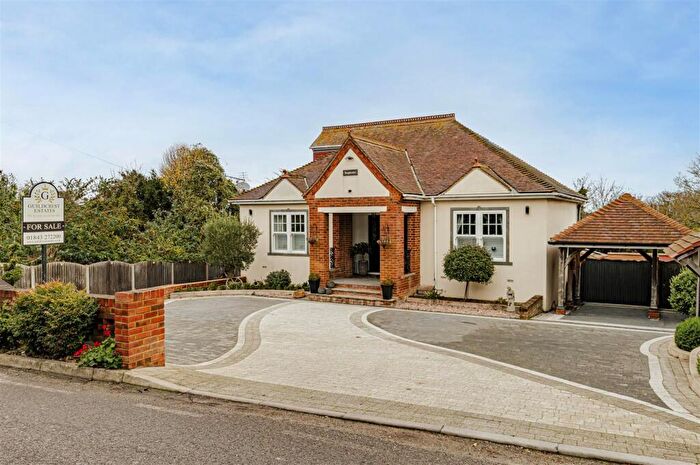
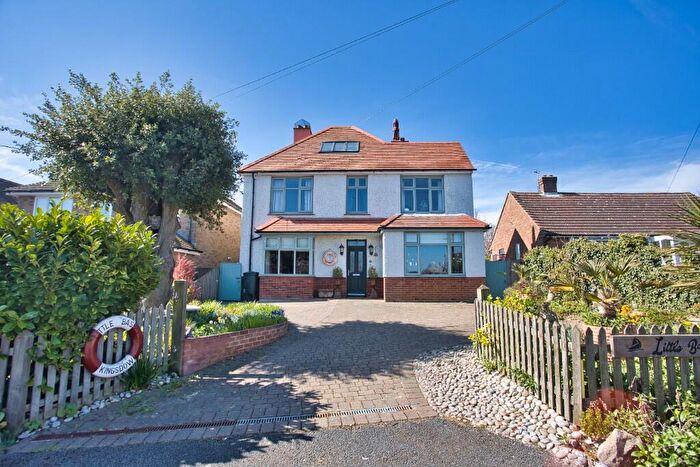
Properties in Ringwould have an average house price of £500,775.00 and had 71 Property Transactions within the last 3 years¹.
Ringwould is an area in Deal, Kent with 871 households², where the most expensive property was sold for £1,750,000.00.
Properties for sale in Ringwould
Roads and Postcodes in Ringwould
Navigate through our locations to find the location of your next house in Ringwould, Deal for sale or to rent.
| Streets | Postcodes |
|---|---|
| Alexandra Road | CT14 8DS |
| Back Street | CT14 8FY CT14 8HL CT14 8HN |
| Balmoral Road | CT14 8BX CT14 8BY CT14 8DB |
| Bayview Road | CT14 8EG |
| Carlton Road | CT14 8DE |
| Chalk Hill Road | CT14 8DP |
| Church Cliff | CT14 8AT |
| Church Lane | CT14 8HR |
| Claremont Close | CT14 8AE |
| Claremont Road | CT14 8BU |
| Cliffe Road | CT14 8AH CT14 8AJ |
| Clim Down | CT14 8EX |
| Courtlands | CT14 8BW |
| Dover Road | CT14 8BP CT14 8HE CT14 8HF CT14 8HG CT14 8HQ |
| Edward Road | CT14 8DA |
| Front Street | CT14 8HP |
| Glen Road | CT14 8BS CT14 8DD |
| Granville Road | CT14 8EN |
| Hangmans Lane | CT14 8HW |
| Hillcrest Road | CT14 8DZ CT14 8EB |
| Jarvist Place | CT14 8AL |
| Kings Close | CT14 8BA CT14 8BG |
| Kingsdown Hill | CT14 8EA |
| Kingsdown Park | CT14 8EU |
| Kingsdown Road | CT14 8AR CT14 8AS |
| North Road | CT14 8AG |
| Northcote Road | CT14 8ED |
| Oldstairs Road | CT14 8EH CT14 8ES |
| Osborne Road | CT14 8BT |
| Queens Rise | CT14 8HJ |
| Queensdown Road | CT14 8EE CT14 8EF |
| Ringwould Road | CT14 8DJ |
| Sea Road | CT14 8BZ CT14 8DF |
| South Road | CT14 8AQ |
| St James Road | CT14 8BQ |
| St Monicas Road | CT14 8AZ |
| The Avenue | CT14 8DU CT14 8DX |
| The Leas | CT14 8ER CT14 8EW |
| The Rise | CT14 8AY CT14 8BD CT14 8BE CT14 8DG CT14 8DH CT14 8DQ |
| Undercliff Road | CT14 8ET |
| Upper Street | CT14 8BH CT14 8BJ CT14 8DR CT14 8DT |
| Victoria Road | CT14 8DY |
| Wellington Parade | CT14 8AF |
| CT14 8GH CT14 8HT |
Transport near Ringwould
- FAQ
- Price Paid By Year
- Property Type Price
Frequently asked questions about Ringwould
What is the average price for a property for sale in Ringwould?
The average price for a property for sale in Ringwould is £500,775. This amount is 39% higher than the average price in Deal. There are 254 property listings for sale in Ringwould.
What streets have the most expensive properties for sale in Ringwould?
The streets with the most expensive properties for sale in Ringwould are Church Cliff at an average of £1,230,000, Alexandra Road at an average of £790,000 and Chalk Hill Road at an average of £670,000.
What streets have the most affordable properties for sale in Ringwould?
The streets with the most affordable properties for sale in Ringwould are Queens Rise at an average of £270,000, Back Street at an average of £320,333 and Kings Close at an average of £347,500.
Which train stations are available in or near Ringwould?
Some of the train stations available in or near Ringwould are Walmer, Martin Mill and Deal.
Property Price Paid in Ringwould by Year
The average sold property price by year was:
| Year | Average Sold Price | Price Change |
Sold Properties
|
|---|---|---|---|
| 2025 | £496,962 | 12% |
20 Properties |
| 2024 | £437,971 | -29% |
25 Properties |
| 2023 | £564,096 | 6% |
26 Properties |
| 2022 | £531,421 | -9% |
32 Properties |
| 2021 | £577,963 | 18% |
41 Properties |
| 2020 | £471,171 | 9% |
28 Properties |
| 2019 | £430,959 | 4% |
26 Properties |
| 2018 | £415,286 | 6% |
23 Properties |
| 2017 | £391,254 | 8% |
42 Properties |
| 2016 | £358,610 | 2% |
31 Properties |
| 2015 | £350,722 | 12% |
50 Properties |
| 2014 | £308,120 | -3% |
47 Properties |
| 2013 | £318,267 | -9% |
39 Properties |
| 2012 | £347,931 | 30% |
27 Properties |
| 2011 | £242,287 | -39% |
41 Properties |
| 2010 | £336,774 | 29% |
31 Properties |
| 2009 | £240,689 | -11% |
29 Properties |
| 2008 | £266,476 | 0,2% |
21 Properties |
| 2007 | £266,036 | 2% |
52 Properties |
| 2006 | £260,882 | 3% |
60 Properties |
| 2005 | £254,307 | 16% |
28 Properties |
| 2004 | £213,396 | 5% |
33 Properties |
| 2003 | £202,379 | 13% |
35 Properties |
| 2002 | £175,722 | 20% |
62 Properties |
| 2001 | £140,622 | 4% |
54 Properties |
| 2000 | £135,328 | 28% |
24 Properties |
| 1999 | £97,272 | 0,4% |
34 Properties |
| 1998 | £96,853 | 12% |
43 Properties |
| 1997 | £85,385 | 9% |
47 Properties |
| 1996 | £78,095 | 3% |
40 Properties |
| 1995 | £75,527 | - |
33 Properties |
Property Price per Property Type in Ringwould
Here you can find historic sold price data in order to help with your property search.
The average Property Paid Price for specific property types in the last three years are:
| Property Type | Average Sold Price | Sold Properties |
|---|---|---|
| Semi Detached House | £416,812.00 | 24 Semi Detached Houses |
| Detached House | £596,635.00 | 37 Detached Houses |
| Terraced House | £430,000.00 | 6 Terraced Houses |
| Flat | £224,000.00 | 4 Flats |

