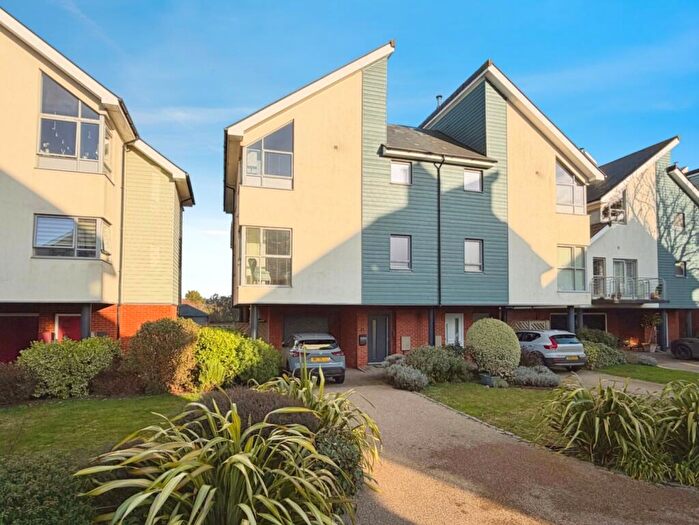
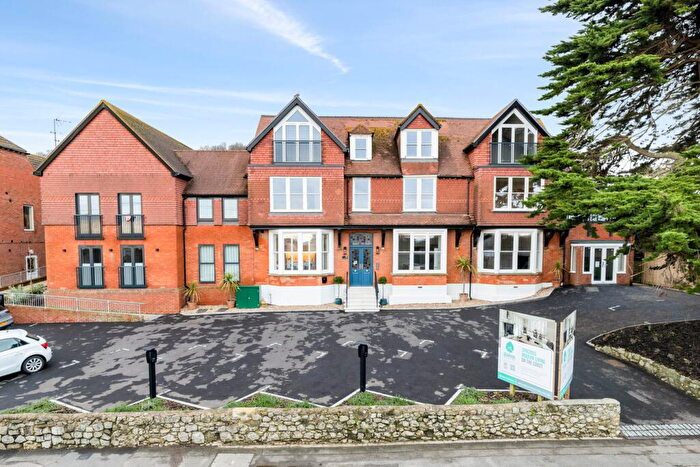
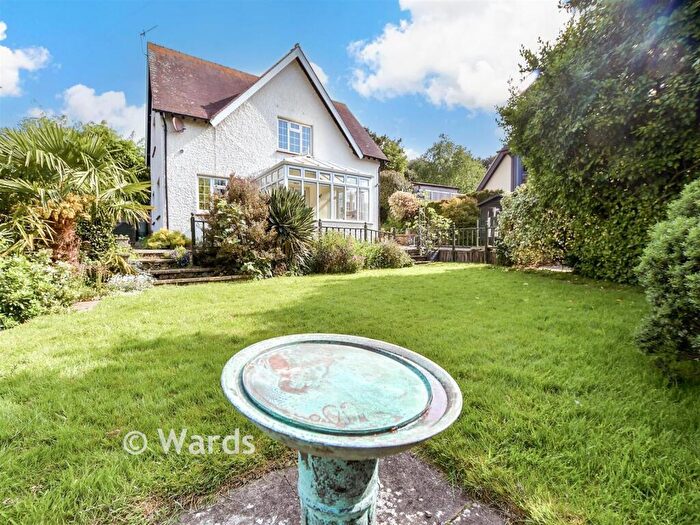
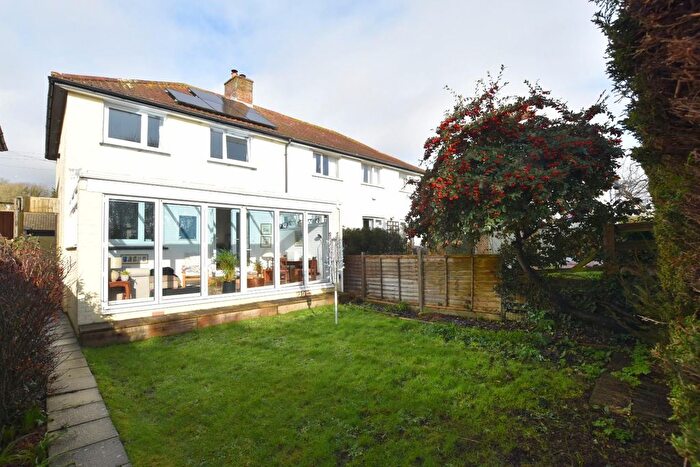
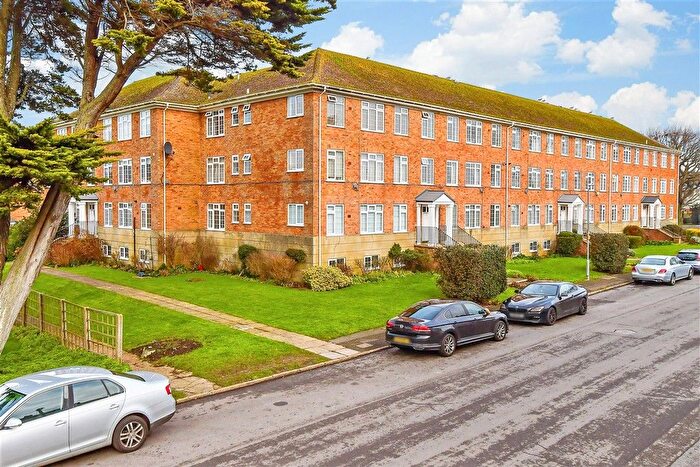
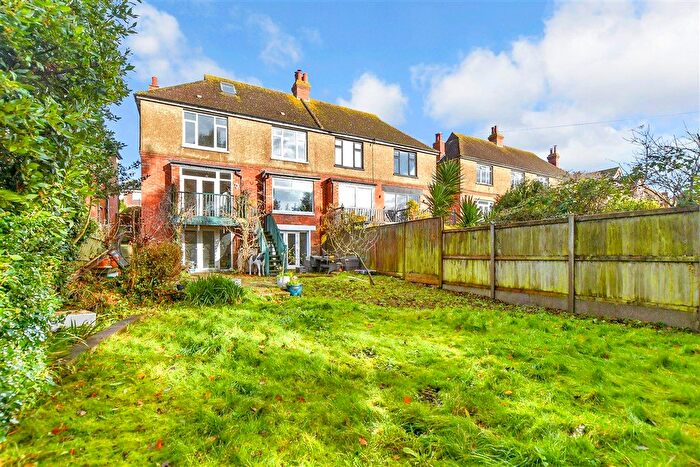
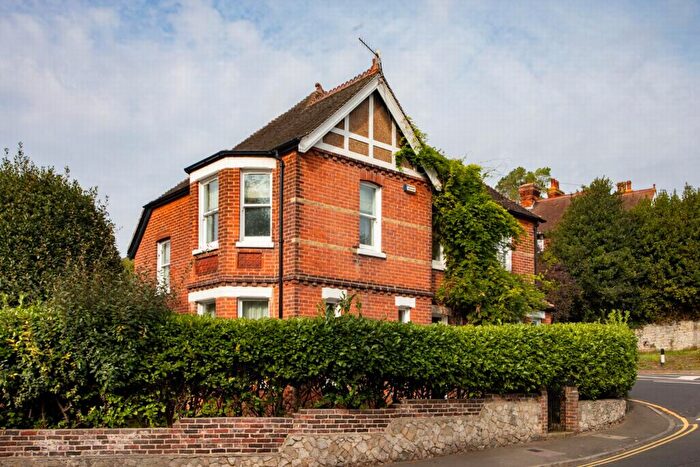
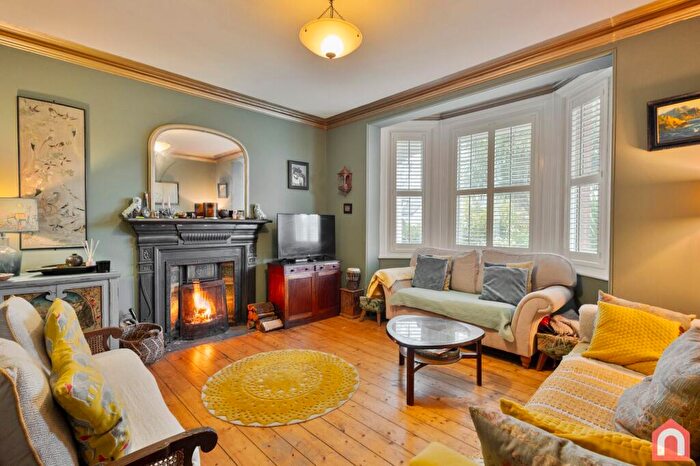
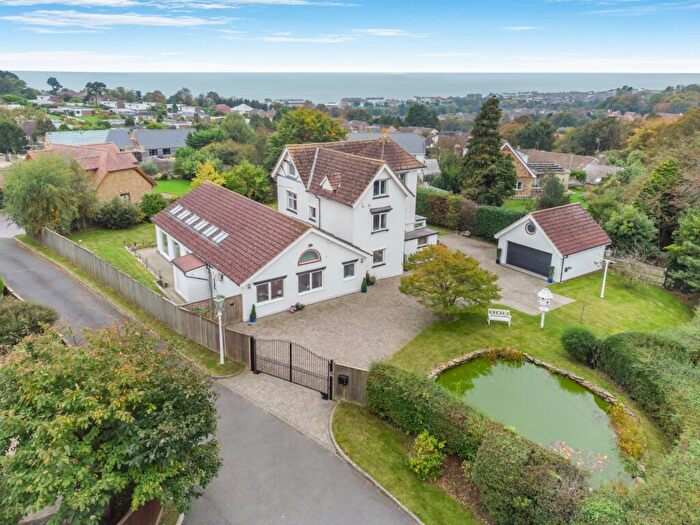
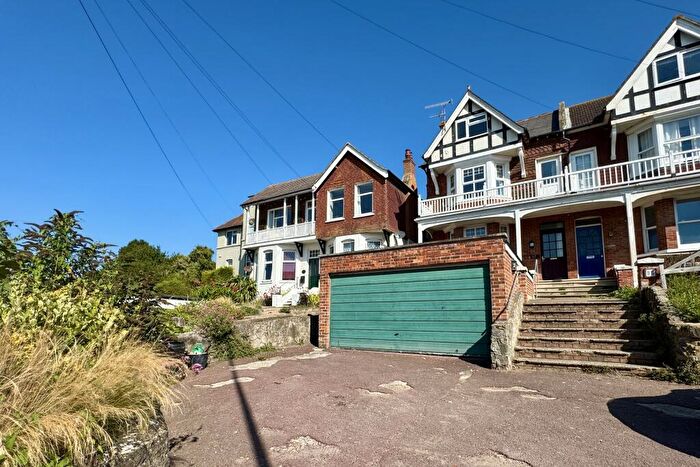
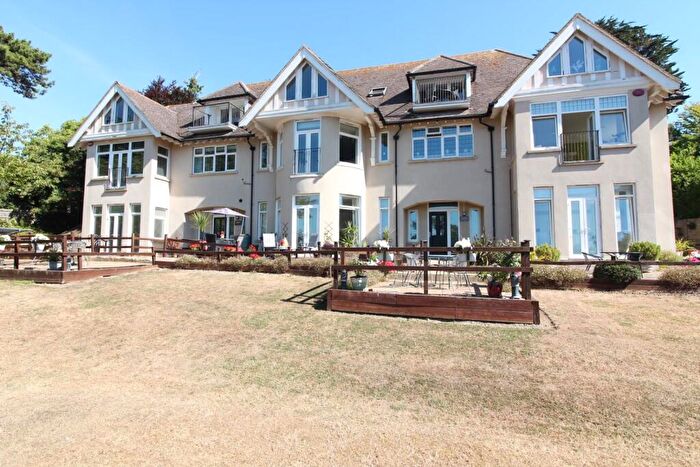
Houses for sale & to rent in Hythe East, Hythe
House Prices in Hythe East
Properties in Hythe East have an average house price of £462,401.00 and had 222 Property Transactions within the last 3 years¹.
Hythe East is an area in Hythe, Kent with 1,802 households², where the most expensive property was sold for £1,400,000.00.
Properties for sale in Hythe East
Roads and Postcodes in Hythe East
Navigate through our locations to find the location of your next house in Hythe East, Hythe for sale or to rent.
| Streets | Postcodes |
|---|---|
| Albion Place | CT21 5LU |
| Bassett Close | CT21 5UZ |
| Bassett Gardens | CT21 5UY |
| Battery Point | CT21 5RR |
| Beacon Terrace | CT21 5RE |
| Blackhouse Hill | CT21 5UL CT21 5UN CT21 5UR |
| Blackhouse Rise | CT21 5UX |
| Blythe Court | CT21 5JS |
| Bridle Way | CT21 5TR |
| Brook Close | CT21 5SZ |
| Cannongate Avenue | CT21 5PS |
| Cannongate Close | CT21 5PZ |
| Cannongate Gardens | CT21 5PU |
| Cannongate Road | CT21 5EF CT21 5PJ CT21 5PT CT21 5PX |
| Castle Road | CT21 5HB CT21 5HL CT21 5HN |
| Cliff Close | CT21 5XR |
| Cliff Road | CT21 5XA CT21 5XE CT21 5XH CT21 5XJ CT21 5XL CT21 5XN CT21 5XQ CT21 5XW |
| Colins Way | CT21 5TU |
| Craythorne Close | CT21 5SP |
| Deedes Close | CT21 5HZ |
| Earlsfield Road | CT21 5PE CT21 5PF |
| East Street | CT21 5ND CT21 5NG |
| Elm Gardens | CT21 5LY CT21 5PY |
| Eversley Road | CT21 5SE |
| Farmer Close | CT21 5XF |
| Ferguson Close | CT21 5QL |
| Hampton Vale | CT21 5SG |
| Helena Villas | CT21 5RU |
| High Ridge | CT21 5TE CT21 5TF |
| Holly Close | CT21 5WA |
| Horn Street | CT21 5SA CT21 5SL CT21 5SR |
| Ians Walk | CT21 5TS CT21 5TT |
| Land Adjoining | CT21 5QB |
| Lower Blackhouse Hill | CT21 5LS |
| Mill Lane | CT21 5LR CT21 5PP |
| Mill Road | CT21 5LP CT21 5LT |
| Millbrook | CT21 5PQ |
| Moncrieff Gardens | CT21 6FJ |
| Mulberry Court | CT21 5WB |
| Naildown Close | CT21 5TA |
| Naildown Road | CT21 5SY CT21 5TB CT21 5TD |
| North Road | CT21 5DT CT21 5UH |
| Owens Close | CT21 5TX |
| Paraker Way | CT21 5SQ |
| Quarry Walk | CT21 5TW |
| Saxon Close | CT21 5QS |
| Seabrook Court | CT21 5RY |
| Seabrook Gardens | CT21 5RD |
| Seabrook Grove | CT21 5QZ |
| Seabrook Mount | CT21 5AR |
| Seabrook Road | CT21 5LX CT21 5LZ CT21 5NA CT21 5NB CT21 5QA CT21 5QD CT21 5QE CT21 5QH CT21 5QJ CT21 5QN CT21 5QP CT21 5QR CT21 5QW CT21 5RA CT21 5RB CT21 5RG CT21 5RL CT21 5RQ CT21 5RS |
| Seabrook Vale | CT21 5SN |
| Seadown Close | CT21 5TN |
| Sene Park | CT21 5XB CT21 5XD |
| Setterfield House | CT21 5PD |
| Spring Lane | CT21 5SF CT21 5TH CT21 5TJ CT21 5TL |
| Springfield Way | CT21 5SH |
| Station Road | CT21 5LN CT21 5PH CT21 5PN CT21 5PR CT21 5PW CT21 5UJ |
| Tanners Hill | CT21 5UG |
| Tanners Hill Gardens | CT21 5HU CT21 5HX CT21 5HY |
| Twiss Avenue | CT21 5NU |
| Twiss Grove | CT21 5PA |
| Twiss Road | CT21 5NY CT21 5NZ CT21 5PB |
| Valestone Close | CT21 5SW |
| Valley Walk | CT21 5TY |
| Victoria Grove | CT21 5RF |
| Victoria Terrace | CT21 5RH |
| View France Close | CT21 5EE |
| Wellington Mews | CT21 5QT |
| Whitenbrook | CT21 5SX |
| Whitenbrook Dell | CT21 5WD |
| William Pitt Close | CT21 5NX |
| Woodlands Drive | CT21 5TG |
Transport near Hythe East
- FAQ
- Price Paid By Year
- Property Type Price
Frequently asked questions about Hythe East
What is the average price for a property for sale in Hythe East?
The average price for a property for sale in Hythe East is £462,401. This amount is 11% higher than the average price in Hythe. There are 629 property listings for sale in Hythe East.
What streets have the most expensive properties for sale in Hythe East?
The streets with the most expensive properties for sale in Hythe East are Castle Road at an average of £980,000, Twiss Avenue at an average of £785,000 and Lower Blackhouse Hill at an average of £767,500.
What streets have the most affordable properties for sale in Hythe East?
The streets with the most affordable properties for sale in Hythe East are Blythe Court at an average of £107,642, Paraker Way at an average of £170,000 and East Street at an average of £207,496.
Which train stations are available in or near Hythe East?
Some of the train stations available in or near Hythe East are Sandling, Folkestone West and Folkestone Central.
Property Price Paid in Hythe East by Year
The average sold property price by year was:
| Year | Average Sold Price | Price Change |
Sold Properties
|
|---|---|---|---|
| 2025 | £445,073 | -8% |
73 Properties |
| 2024 | £480,913 | 4% |
73 Properties |
| 2023 | £461,263 | -11% |
76 Properties |
| 2022 | £512,183 | 14% |
99 Properties |
| 2021 | £442,850 | 14% |
140 Properties |
| 2020 | £383,004 | 3% |
84 Properties |
| 2019 | £370,310 | 9% |
91 Properties |
| 2018 | £336,223 | -2% |
82 Properties |
| 2017 | £344,407 | -8% |
106 Properties |
| 2016 | £370,638 | 12% |
114 Properties |
| 2015 | £326,418 | 12% |
108 Properties |
| 2014 | £286,647 | 6% |
111 Properties |
| 2013 | £268,688 | 4% |
118 Properties |
| 2012 | £258,913 | 3% |
84 Properties |
| 2011 | £249,893 | -9% |
66 Properties |
| 2010 | £273,596 | 5% |
91 Properties |
| 2009 | £258,783 | -4% |
59 Properties |
| 2008 | £268,185 | -11% |
92 Properties |
| 2007 | £297,320 | 20% |
101 Properties |
| 2006 | £238,726 | -8% |
128 Properties |
| 2005 | £257,755 | 22% |
73 Properties |
| 2004 | £201,850 | 6% |
86 Properties |
| 2003 | £190,208 | 9% |
128 Properties |
| 2002 | £173,477 | 25% |
88 Properties |
| 2001 | £130,541 | 11% |
88 Properties |
| 2000 | £116,056 | 4% |
94 Properties |
| 1999 | £111,766 | 22% |
110 Properties |
| 1998 | £86,782 | 0,2% |
92 Properties |
| 1997 | £86,568 | 10% |
97 Properties |
| 1996 | £78,158 | 9% |
66 Properties |
| 1995 | £71,020 | - |
80 Properties |
Property Price per Property Type in Hythe East
Here you can find historic sold price data in order to help with your property search.
The average Property Paid Price for specific property types in the last three years are:
| Property Type | Average Sold Price | Sold Properties |
|---|---|---|
| Semi Detached House | £423,141.00 | 69 Semi Detached Houses |
| Detached House | £673,952.00 | 74 Detached Houses |
| Terraced House | £335,236.00 | 36 Terraced Houses |
| Flat | £267,801.00 | 43 Flats |

