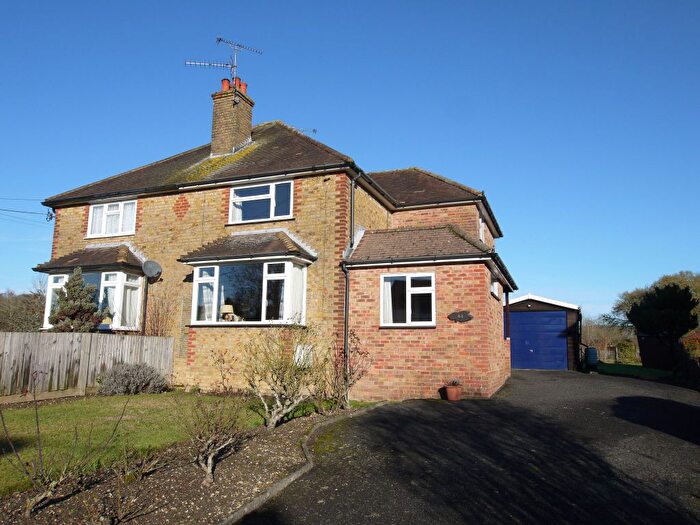
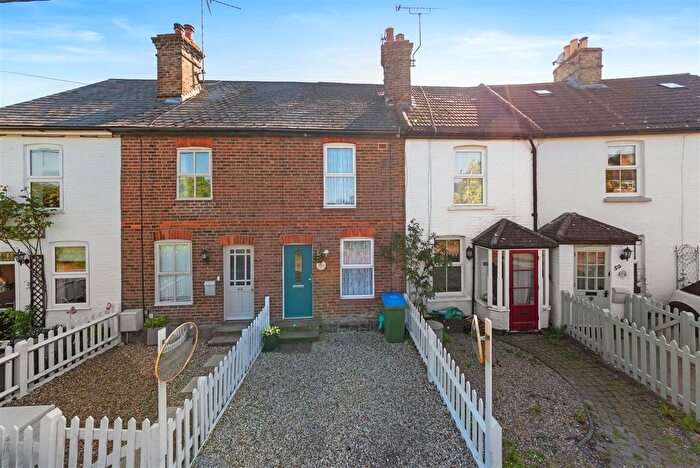
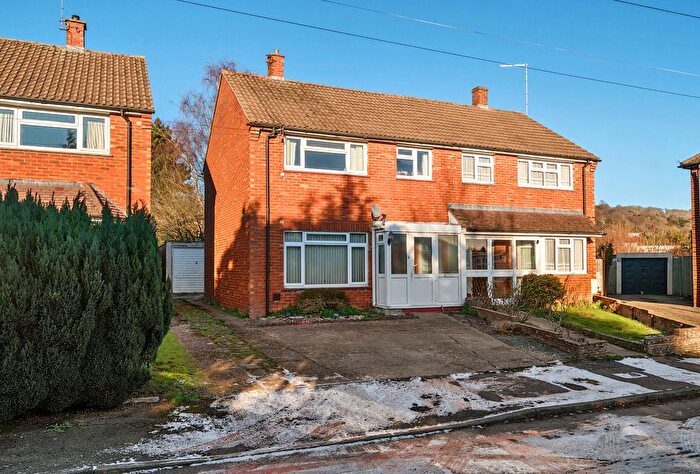
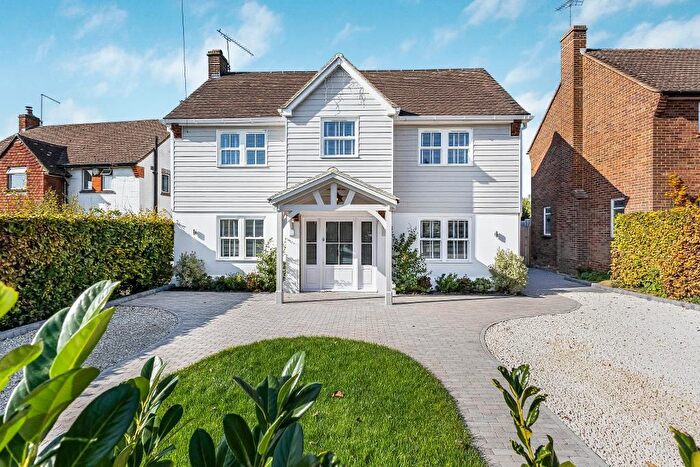
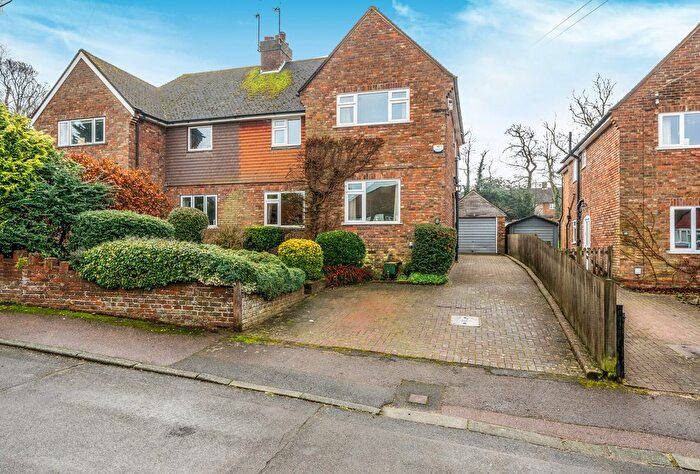
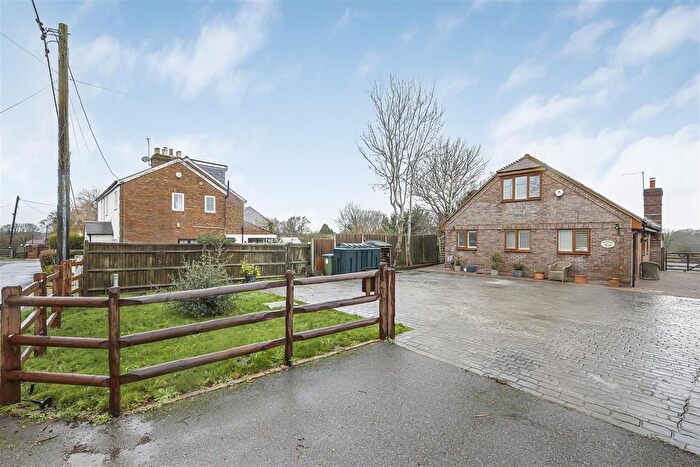
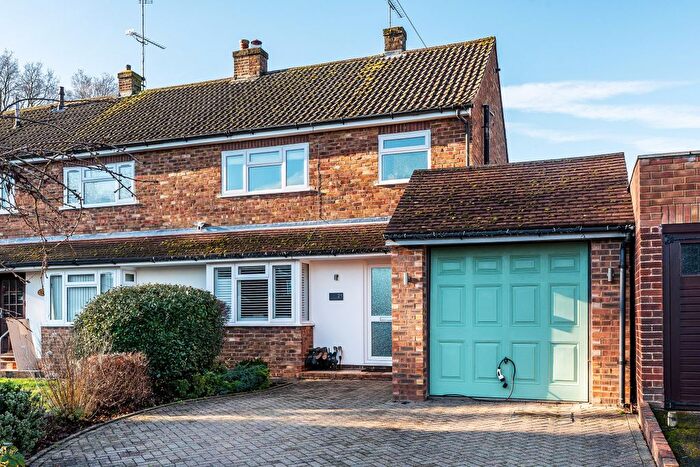
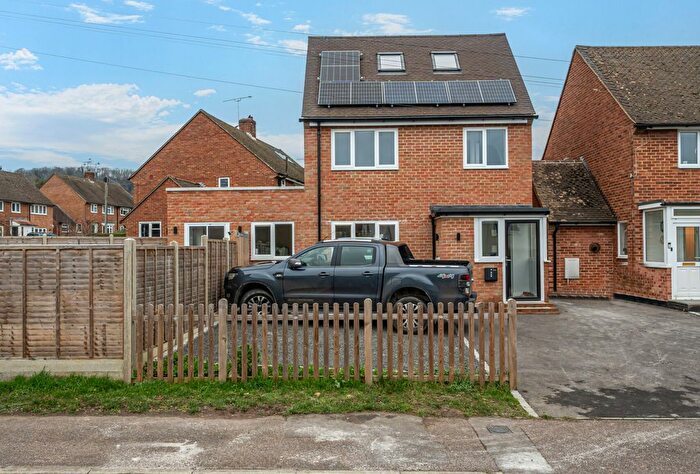
Houses for sale & to rent in Kemsing, Sevenoaks
House Prices in Kemsing
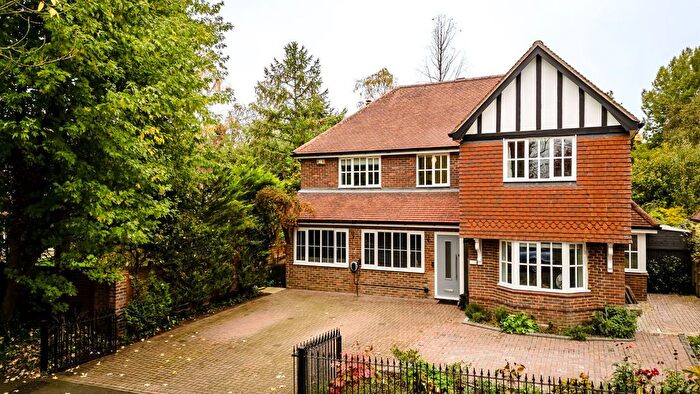
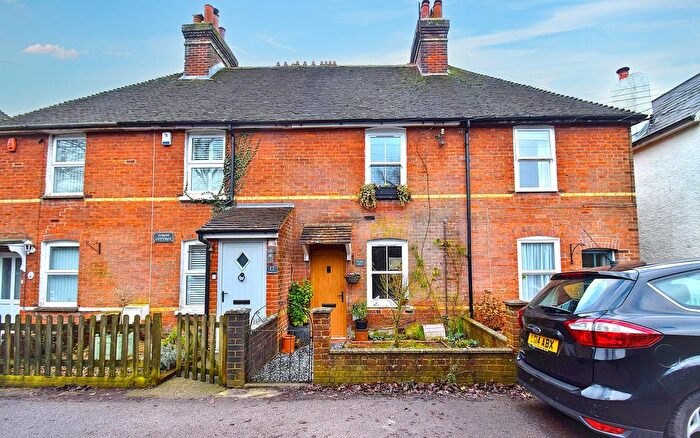
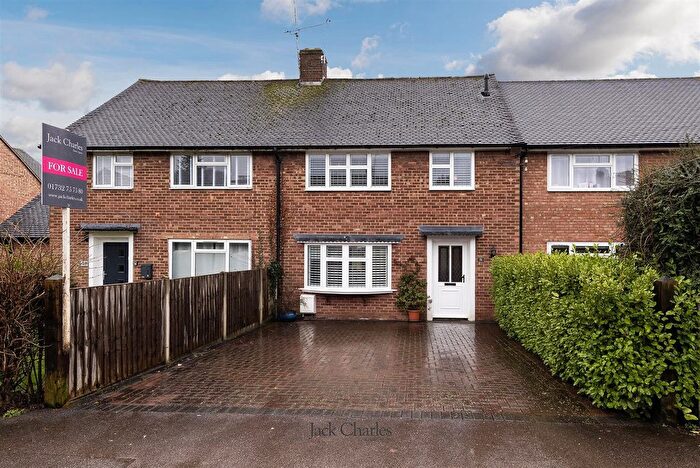
Properties in Kemsing have an average house price of £633,102.00 and had 147 Property Transactions within the last 3 years¹.
Kemsing is an area in Sevenoaks, Kent with 1,691 households², where the most expensive property was sold for £1,725,000.00.
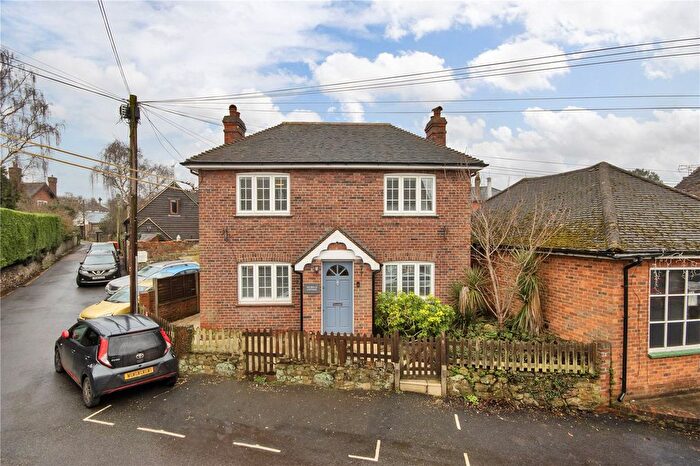
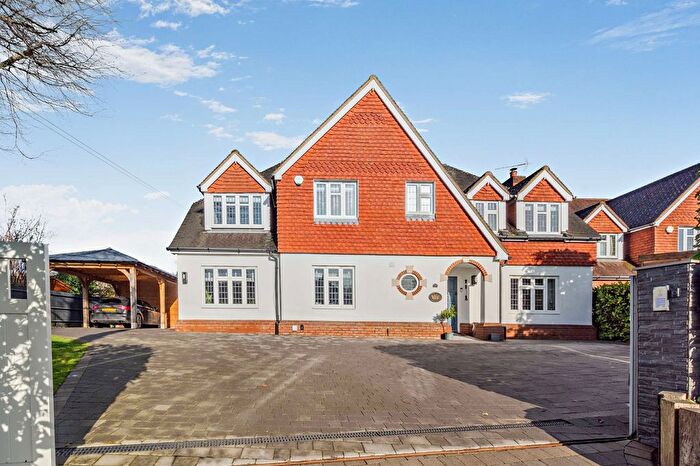
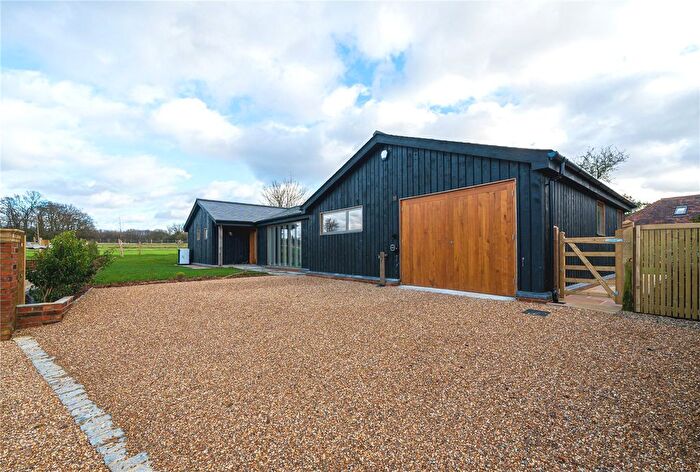
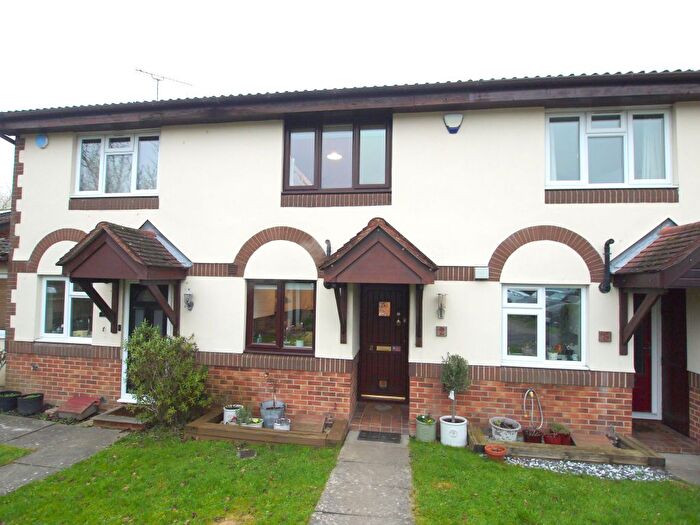
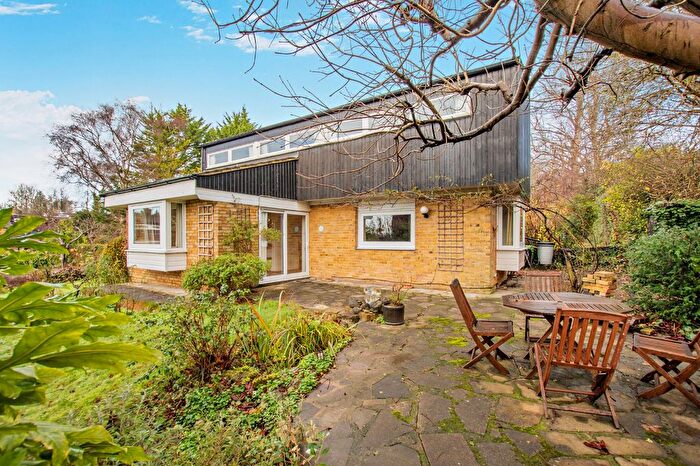
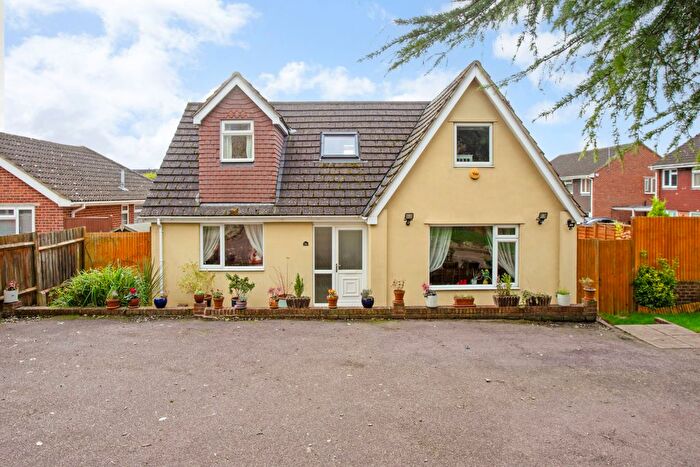
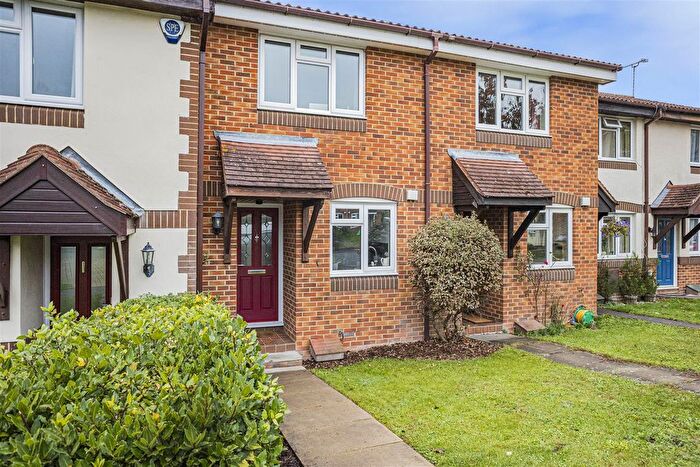
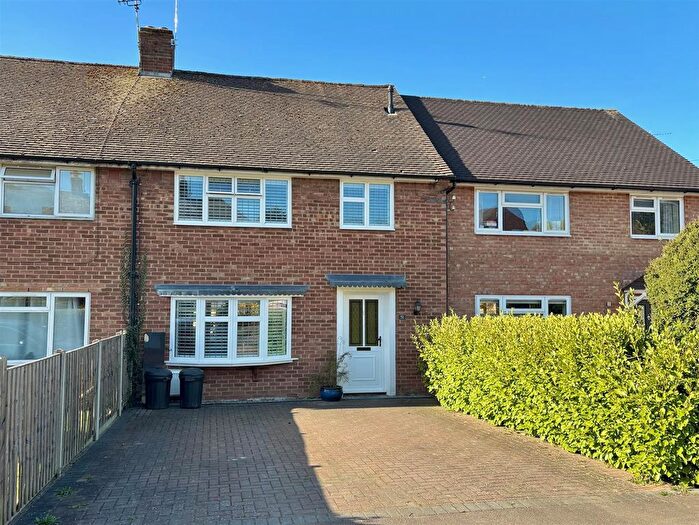
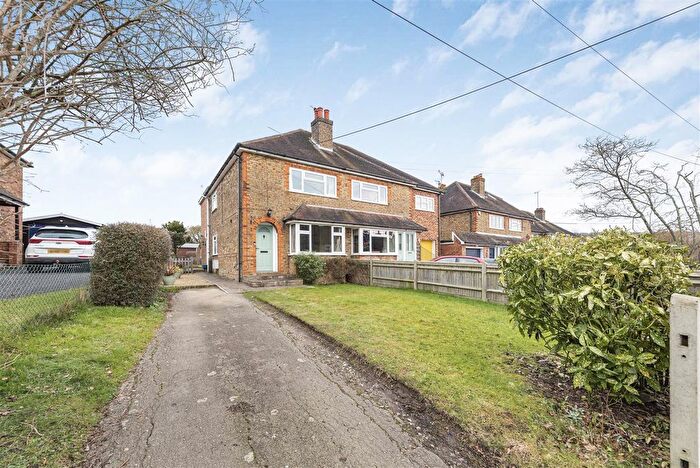
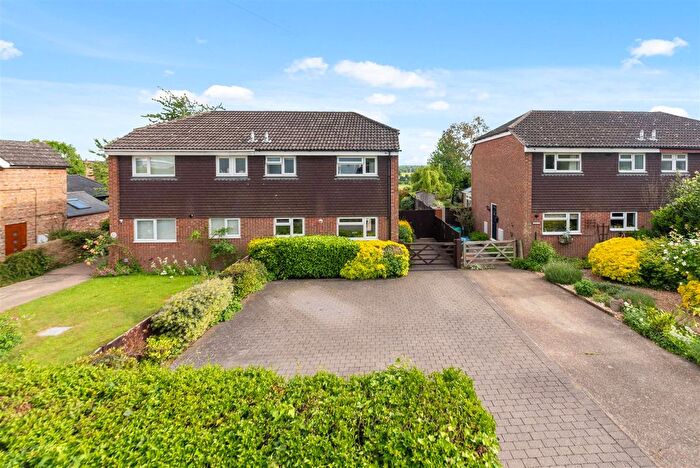
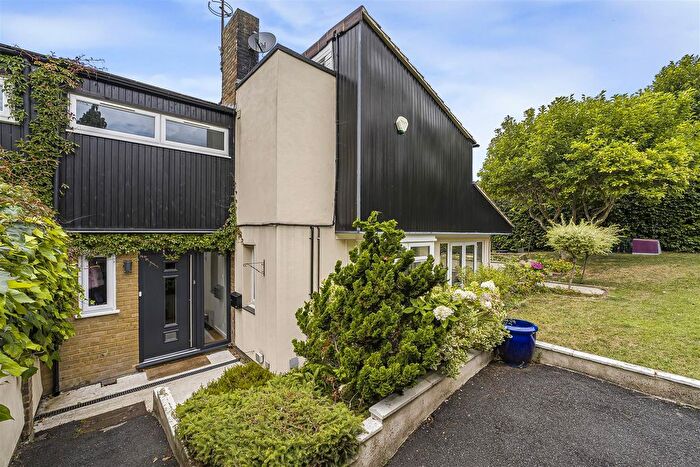
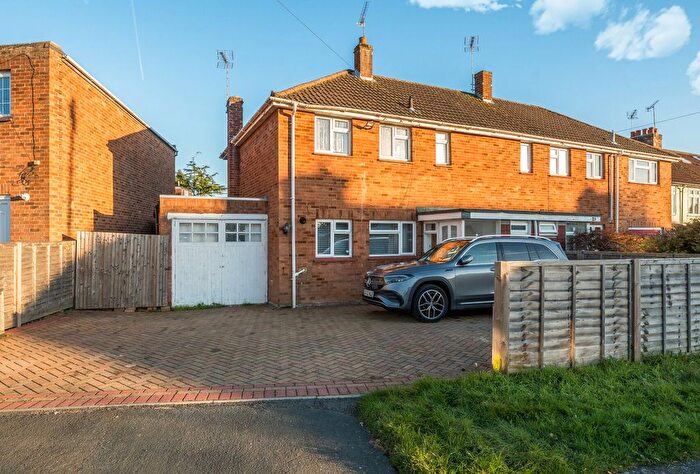
Properties for sale in Kemsing
Previously listed properties in Kemsing
Roads and Postcodes in Kemsing
Navigate through our locations to find the location of your next house in Kemsing, Sevenoaks for sale or to rent.
| Streets | Postcodes |
|---|---|
| Barclay Field | TN15 6SN |
| Barnfield Crescent | TN15 6SE |
| Beechy Lees Road | TN14 5QJ |
| Birchin Cross Road | TN15 6XJ |
| Boleyn Road | TN15 6RY |
| Bowden Court | TN15 6TQ |
| Brookfield | TN15 6SQ |
| Castle Drive | TN15 6RL TN15 6RN TN15 6RP TN15 6RR TN15 6RS TN15 6RW |
| Chart View | TN15 6PP |
| Chaucer Business Park | TN15 6PL TN15 6PW TN15 6HU TN15 6PJ TN15 6QY TN15 6YP TN15 6YT TN15 6YU |
| Childsbridge Lane | TN15 0BZ TN15 6QN TN15 6QR TN15 6TH TN15 6TJ TN15 6TL TN15 6QS |
| Church Lane | TN15 6GD TN15 6LU |
| Clarkes Green Lane | TN15 6XE |
| Cleves Road | TN15 6RX |
| Collet Road | TN15 6SH TN15 6SJ |
| Copperfields | TN15 6QG |
| Copperfields Close | TN15 6QW |
| Copperfields Orchard | TN15 6QH |
| Copperfields Walk | TN15 6QF |
| Cotmans Ash Lane | TN15 6NJ TN15 6XD |
| Dippers Close | TN15 6QD |
| Dynes Road | TN15 6RA TN15 6RB TN15 6RD TN15 6RF |
| Edgar Road | TN15 6RT |
| Fairfield Close | TN15 6QZ |
| Greenlands Road | TN15 6PG TN15 6PH TN15 6PQ |
| Greystones Close | TN15 6QP |
| Heaverham Road | TN15 6NE TN15 6NF TN15 6NG TN15 6NQ TN15 6NH |
| High Street | TN15 6LY TN15 6LZ TN15 6NA TN15 6NB TN15 6PU TN15 6LX |
| Highfield Road | TN15 6TN |
| Hillside Road | TN15 6SG |
| Honey Pot Lane | TN15 6NT |
| Knavewood Road | TN15 6RH TN15 6RJ |
| Mary Burrows Gardens | TN15 6LR |
| Montfort Road | TN15 6SA |
| Nightingale Road | TN15 6RU |
| Noahs Ark | TN15 6PA TN15 6PD TN15 6PF TN15 6PS TN15 6PB |
| Noahs Place | TN15 6QQ |
| Norman Close | TN15 6SF |
| Northdown Road | TN15 6SB TN15 6SD |
| Old Barn Close | TN15 6RZ |
| Orchard Way | TN15 6QA |
| Oxenhill Road | TN15 6RG TN15 6RQ |
| Park Hill Road | TN14 5QH |
| Park Lane | TN15 6NU TN15 6NX |
| Pilgrims Way | TN15 6LS TN15 6TD TN15 6TE TN15 6TR TN15 6XA TN15 6XB TN15 6HY TN15 6TB |
| Pilgrims Way Cottages | TN15 6TA |
| Pilgrims Way East | TN14 5SJ TN14 5SL TN14 5QL |
| Rushymead | TN15 6NY |
| Sherborne Grove | TN15 6QU |
| Shorehill Court | TN15 6BF |
| Shorehill Lane | TN15 6XL TN15 6XF |
| Spring Head Close | TN15 6FE |
| Spring Head Road | TN15 6QL |
| St Clere | TN15 6NL |
| St Ediths Road | TN15 6JQ TN15 6PT |
| Stable Yard | TN15 6NZ |
| The Chase | TN15 6TP |
| The Landway | TN15 6TG |
| The Parade | TN15 6RE |
| Theobalds Close | TN15 6ST |
| Treetops | TN15 6SP |
| Watery Lane | TN15 6NP TN15 6NR |
| West End | TN15 6PX TN15 6PY TN15 6PZ TN15 6QB TN15 6QE TN15 6QJ TN15 6FN |
| Whitebeam Close | TN15 6DZ |
| Wulfred Way | TN15 6PR |
Transport near Kemsing
-
Kemsing Station
-
Otford Station
-
Bat and Ball Station
-
Shoreham (Kent) Station
-
Dunton Green Station
-
Sevenoaks Station
- FAQ
- Price Paid By Year
- Property Type Price
Frequently asked questions about Kemsing
What is the average price for a property for sale in Kemsing?
The average price for a property for sale in Kemsing is £633,102. This amount is 13% lower than the average price in Sevenoaks. There are 475 property listings for sale in Kemsing.
What streets have the most expensive properties for sale in Kemsing?
The streets with the most expensive properties for sale in Kemsing are Birchin Cross Road at an average of £1,600,000, Whitebeam Close at an average of £1,235,000 and Chart View at an average of £1,220,000.
What streets have the most affordable properties for sale in Kemsing?
The streets with the most affordable properties for sale in Kemsing are Fairfield Close at an average of £303,125, Theobalds Close at an average of £336,000 and Norman Close at an average of £410,000.
Which train stations are available in or near Kemsing?
Some of the train stations available in or near Kemsing are Kemsing, Otford and Bat and Ball.
Property Price Paid in Kemsing by Year
The average sold property price by year was:
| Year | Average Sold Price | Price Change |
Sold Properties
|
|---|---|---|---|
| 2025 | £619,203 | -7% |
52 Properties |
| 2024 | £663,562 | 7% |
48 Properties |
| 2023 | £617,372 | -21% |
47 Properties |
| 2022 | £749,931 | 21% |
63 Properties |
| 2021 | £589,558 | 1% |
98 Properties |
| 2020 | £583,327 | -1% |
52 Properties |
| 2019 | £589,880 | -11% |
39 Properties |
| 2018 | £652,771 | 21% |
53 Properties |
| 2017 | £512,844 | 3% |
79 Properties |
| 2016 | £499,679 | 1% |
81 Properties |
| 2015 | £492,672 | 10% |
57 Properties |
| 2014 | £445,784 | 18% |
68 Properties |
| 2013 | £364,406 | 5% |
58 Properties |
| 2012 | £346,958 | -16% |
53 Properties |
| 2011 | £401,671 | 4% |
49 Properties |
| 2010 | £385,174 | 2% |
71 Properties |
| 2009 | £376,091 | 2% |
52 Properties |
| 2008 | £370,365 | 6% |
30 Properties |
| 2007 | £348,032 | 8% |
71 Properties |
| 2006 | £320,587 | 1% |
80 Properties |
| 2005 | £318,358 | 1% |
54 Properties |
| 2004 | £313,701 | 9% |
75 Properties |
| 2003 | £284,257 | 12% |
53 Properties |
| 2002 | £250,046 | 22% |
92 Properties |
| 2001 | £195,875 | 9% |
73 Properties |
| 2000 | £179,049 | 19% |
71 Properties |
| 1999 | £145,402 | -14% |
66 Properties |
| 1998 | £165,875 | 21% |
63 Properties |
| 1997 | £131,359 | 23% |
62 Properties |
| 1996 | £101,377 | -27% |
68 Properties |
| 1995 | £128,952 | - |
39 Properties |
Property Price per Property Type in Kemsing
Here you can find historic sold price data in order to help with your property search.
The average Property Paid Price for specific property types in the last three years are:
| Property Type | Average Sold Price | Sold Properties |
|---|---|---|
| Semi Detached House | £549,659.00 | 69 Semi Detached Houses |
| Detached House | £919,011.00 | 44 Detached Houses |
| Terraced House | £439,421.00 | 31 Terraced Houses |
| Flat | £360,333.00 | 3 Flats |

