
Houses for sale & to rent in TN15 0HA, Seal And Weald, Sevenoaks
House Prices in TN15 0HA, Seal And Weald
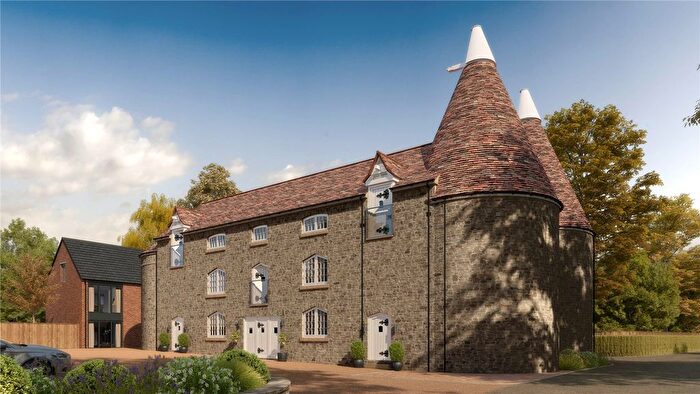
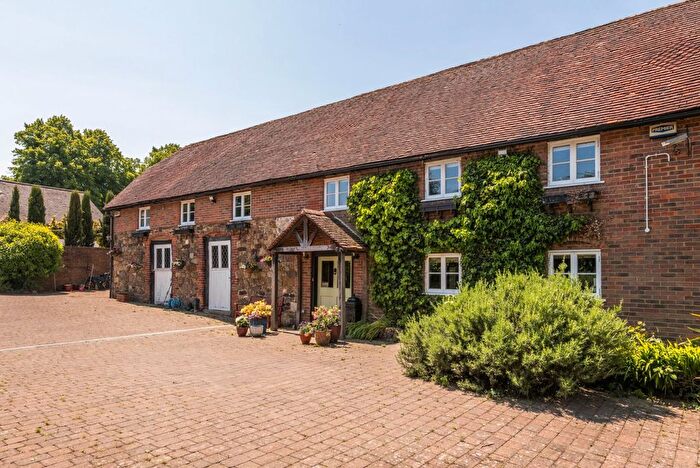
Properties in TN15 0HA have no sales history available within the last 3 years. TN15 0HA is a postcode in Seal And Weald, an area in Sevenoaks, Kent, with 4 households².
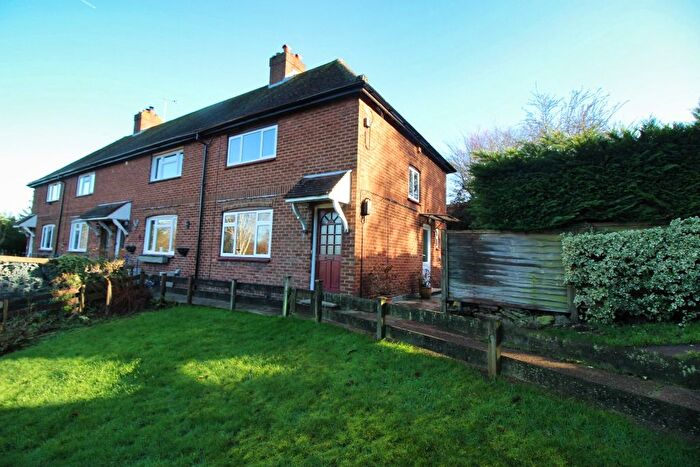
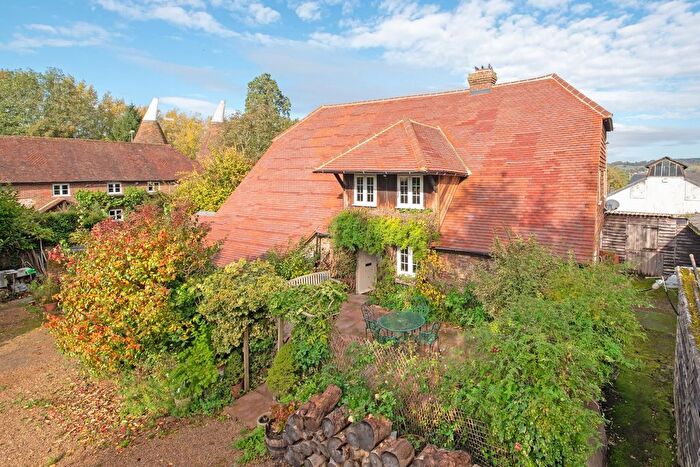
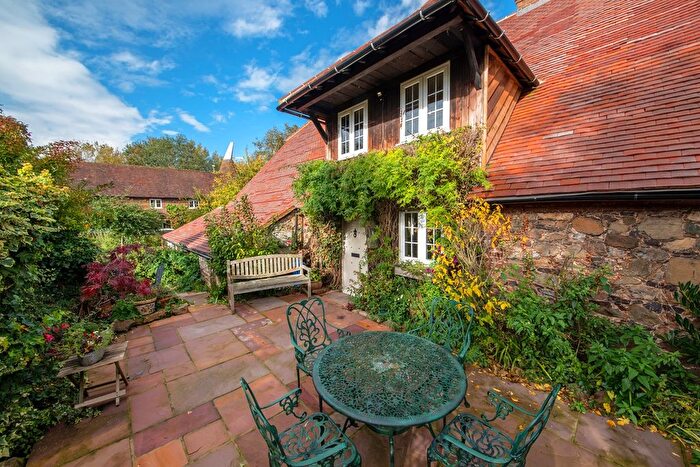
Properties for sale near TN15 0HA

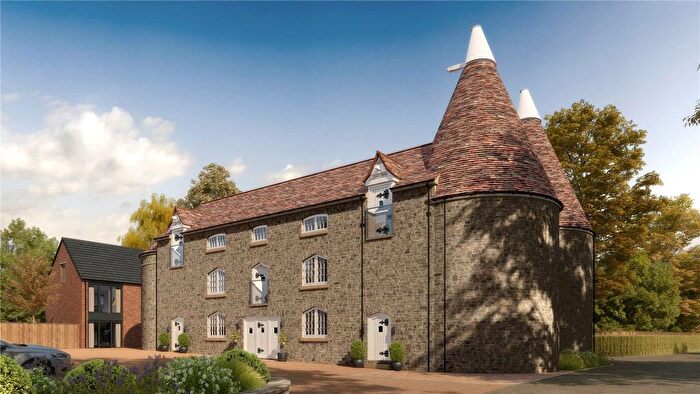
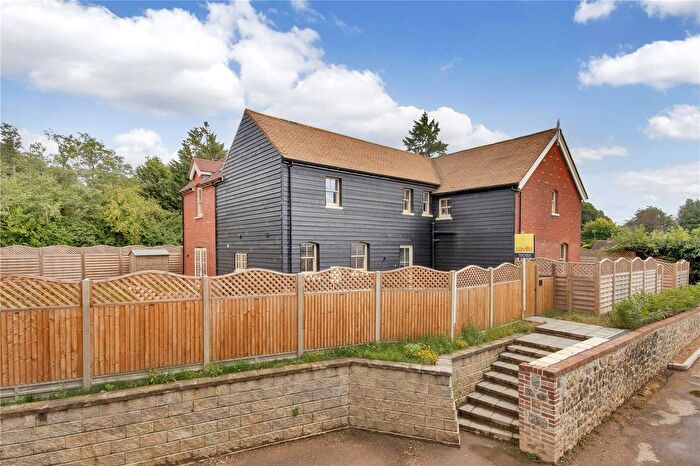
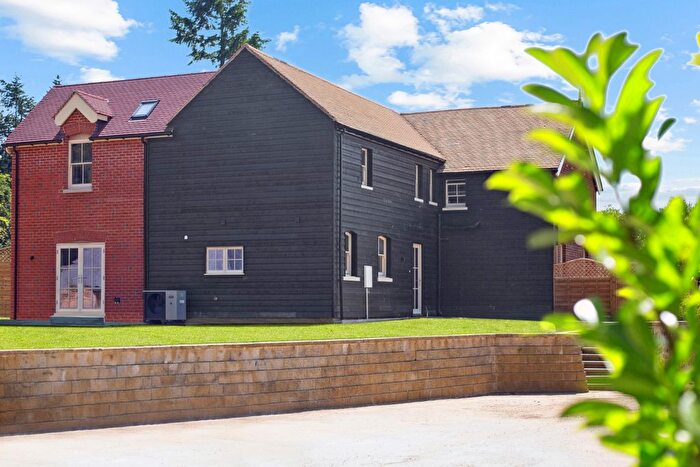
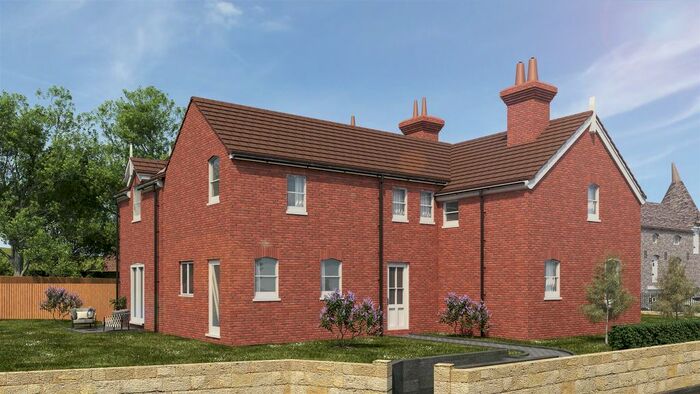
Previously listed properties near TN15 0HA
![]()
If you are looking to sell your house, let it out, or receive a property valuation, an expert can help you.
Click the button below to get started.


Price Paid in TN15 0HA, Seal And Weald
AVENUE COTTAGE TN15 0HA, Seal And Weald Sevenoaks
Property AVENUE COTTAGE has been sold 2 times. The last time it was sold was in 21/01/2011 and the sold price was £700,000.00.
This detached house, sold as a freehold on 21/01/2011, is a 170 sqm detached house with an EPC rating of G.
| Date | Price | Property Type | Tenure | Classification |
|---|---|---|---|---|
| 21/01/2011 | £700,000.00 | Detached House | freehold | Established Building |
| 06/11/2002 | £490,000.00 | Detached House | freehold | Established Building |
LITTLE FRANKFIELD TN15 0HA, Seal And Weald Sevenoaks
Property LITTLE FRANKFIELD has been sold 2 times. The last time it was sold was in 10/10/2006 and the sold price was £150,000.00.
This terraced house, sold as a freehold on 10/10/2006, is a 253 sqm detached house with an EPC rating of E.
| Date | Price | Property Type | Tenure | Classification |
|---|---|---|---|---|
| 10/10/2006 | £150,000.00 | Terraced House | freehold | Established Building |
| 07/07/2006 | £150,000.00 | Semi Detached House | freehold | Established Building |
CHARTFIELD TN15 0HA, Seal And Weald Sevenoaks
Property CHARTFIELD has been sold 1 time. The last time it was sold was in 27/07/2004 and the sold price was £1,060,000.00.
This is a Detached House which was sold as a freehold in 27/07/2004
| Date | Price | Property Type | Tenure | Classification |
|---|---|---|---|---|
| 27/07/2004 | £1,060,000.00 | Detached House | freehold | Established Building |
Transport near TN15 0HA

House price paid reports for TN15 0HA
Click on the buttons below to see price paid reports by year or property price:
- Price Paid By Year
Property Price Paid in TN15 0HA by Year
The average sold property price by year was:
| Year | Average Sold Price | Price Change |
Sold Properties
|
|---|---|---|---|
| 2011 | £700,000 | 79% |
1 Property |
| 2006 | £150,000 | -607% |
2 Properties |
| 2004 | £1,060,000 | 54% |
1 Property |
| 2002 | £490,000 | - |
1 Property |