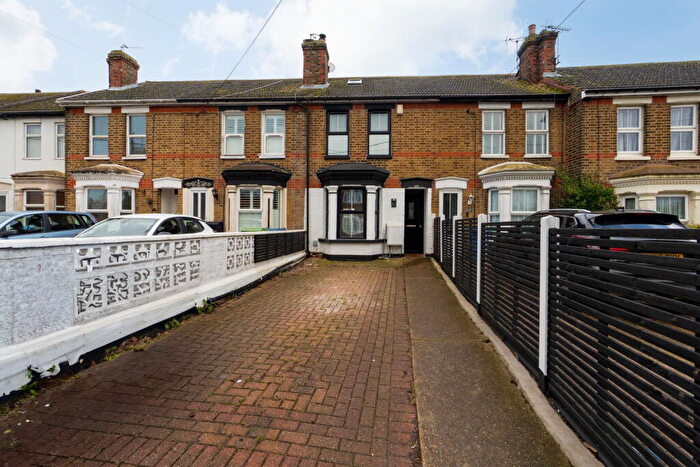
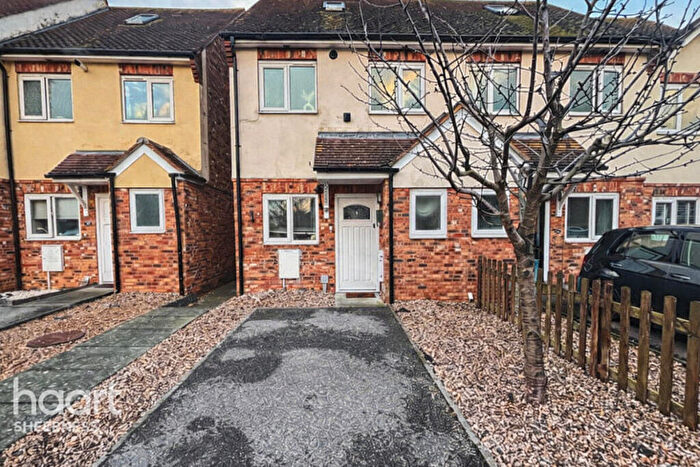
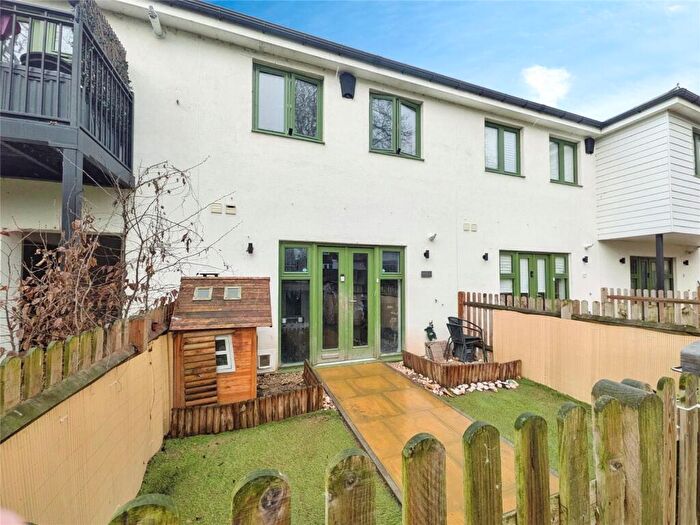
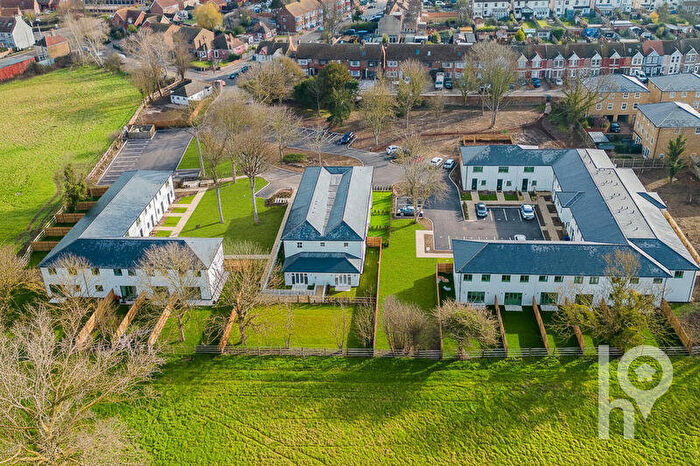
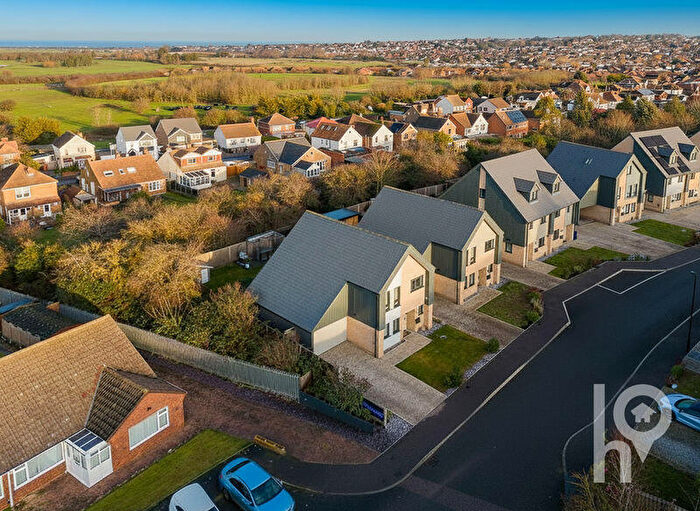
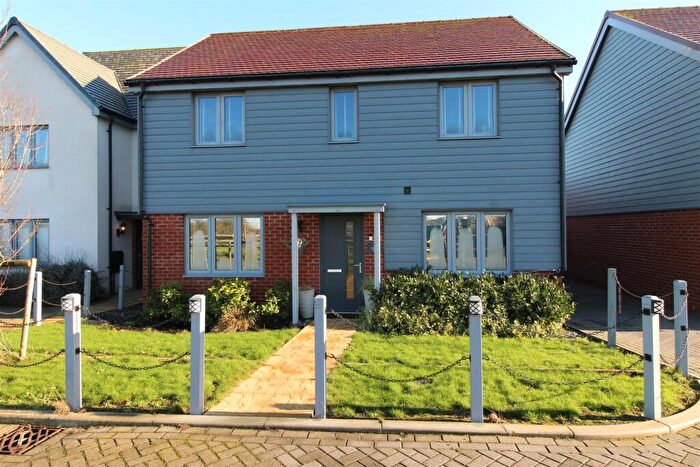
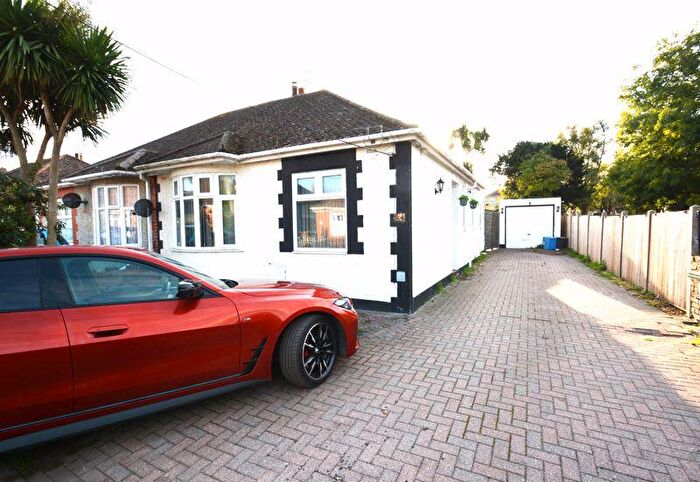
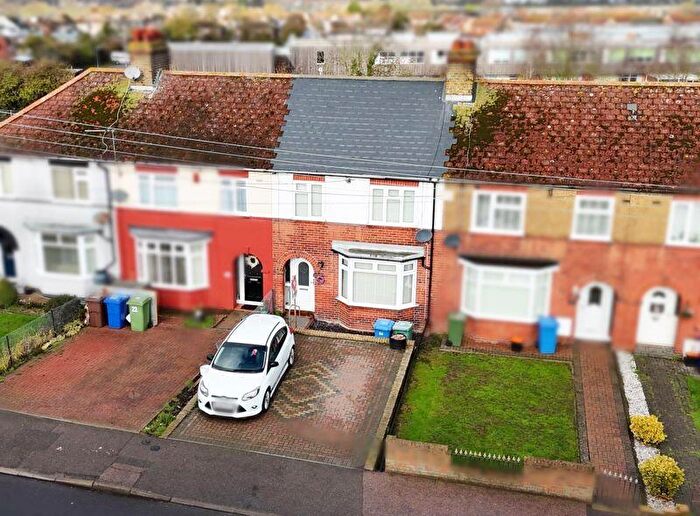
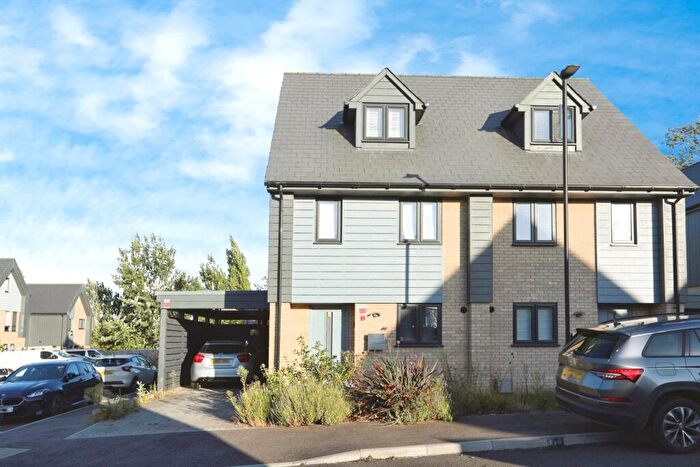
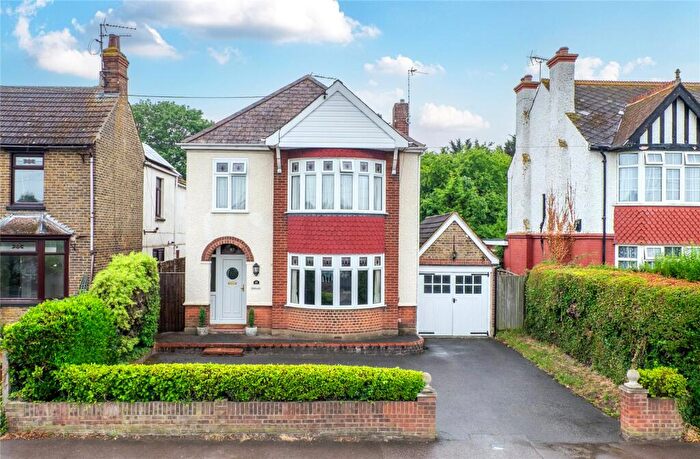
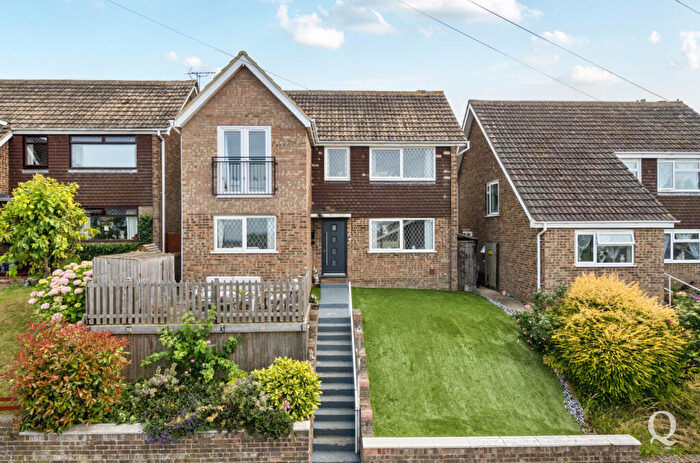
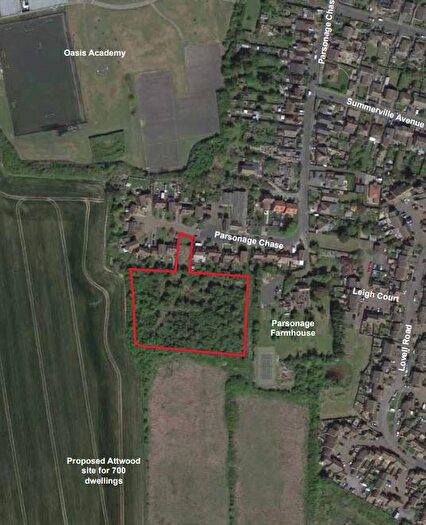
Houses for sale & to rent in Queenborough And Halfway, Sheerness
House Prices in Queenborough And Halfway
Properties in Queenborough And Halfway have an average house price of £294,937.00 and had 178 Property Transactions within the last 3 years¹.
Queenborough And Halfway is an area in Sheerness, Kent with 1,694 households², where the most expensive property was sold for £560,000.00.
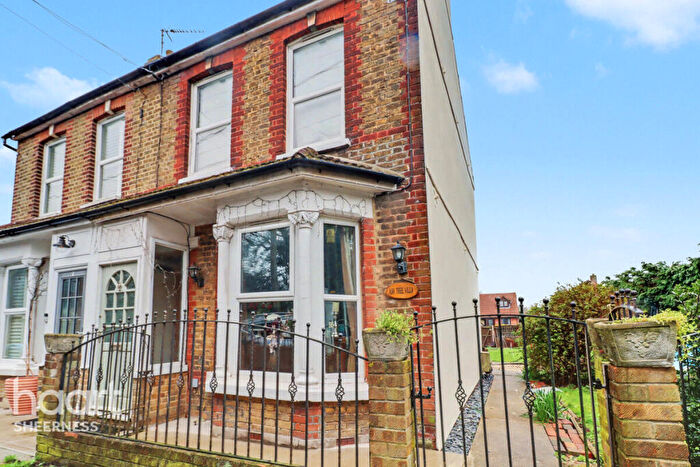
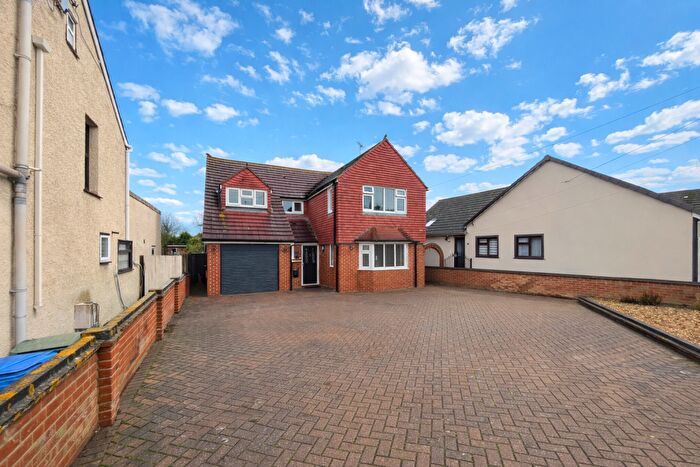
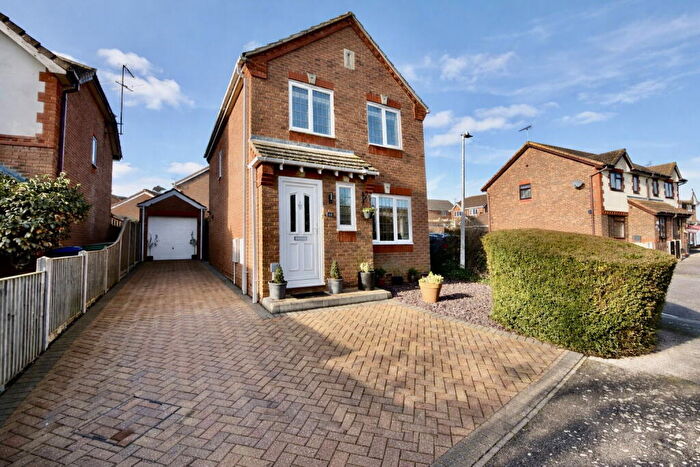
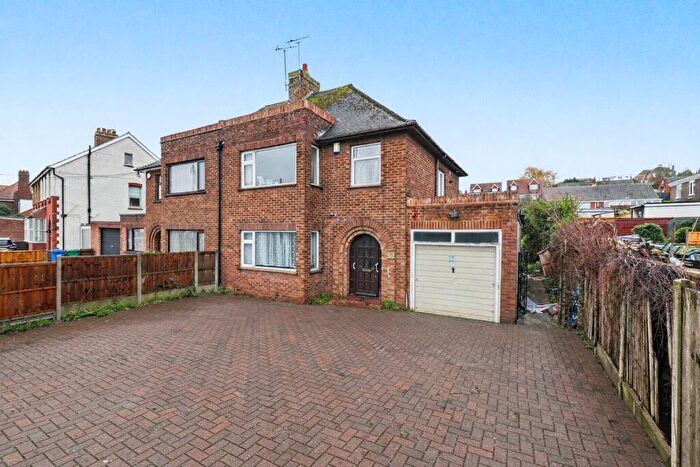
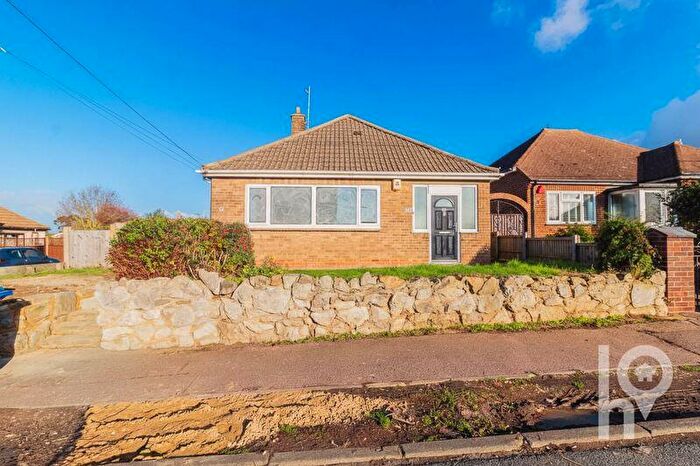
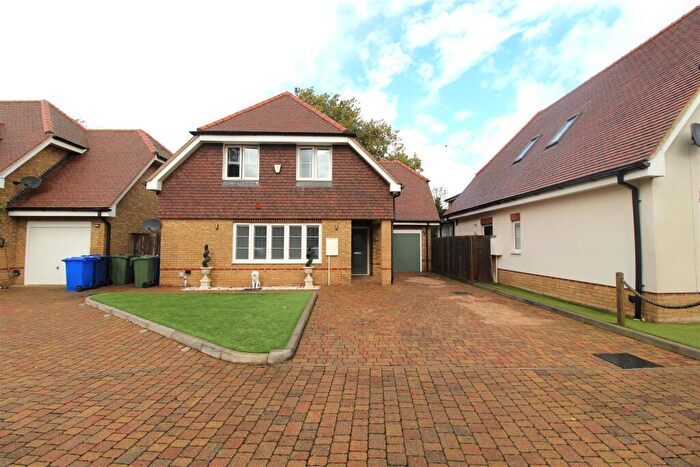
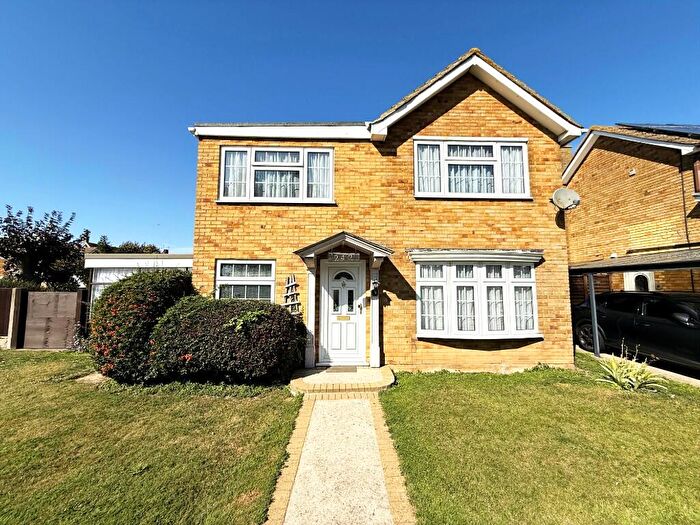
Properties for sale in Queenborough And Halfway
Roads and Postcodes in Queenborough And Halfway
Navigate through our locations to find the location of your next house in Queenborough And Halfway, Sheerness for sale or to rent.
| Streets | Postcodes |
|---|---|
| Adelaide Gardens | ME12 3HN |
| Admirals Walk | ME12 3AY ME12 3BB |
| Appleford Drive | ME12 2SR ME12 2TB ME12 2TX |
| Ashley Close | ME12 3ED |
| Banner Way | ME12 3AX |
| Bartletts Close | ME12 3EG |
| Belgrave Avenue | ME12 3UW |
| Belgrave Road | ME12 3EA ME12 3EB ME12 3EE |
| Belmont Road | ME12 3BL |
| Buddle Drive | ME12 3EP |
| Commodores Close | ME12 3UU |
| Criterion Green | ME12 3UX |
| Danley Road | ME12 3AP |
| Darter Avenue | ME12 3UY |
| Dickens Close | ME12 3UZ |
| Dunlin End | ME12 3WH |
| Eastern Avenue | ME12 3BP |
| Ferndale Close | ME12 3HW |
| Fieldview Close | ME12 3DP |
| Filer Road | ME12 3AL |
| Furze Hill Crescent | ME12 3HS |
| Halfway Road | ME12 3AR ME12 3AT ME12 3AU ME12 3AS |
| Highfield Road | ME12 3AZ ME12 3BA |
| Hilda Road | ME12 3BN ME12 3BW |
| Holmside Avenue | ME12 3EX ME12 3EY ME12 3EZ |
| Labworth Close | ME12 3HP |
| Lime Grove | ME12 3DX |
| Lowfield Road | ME12 3BJ |
| Lynsted Road | ME12 3AG |
| Marr Close | ME12 2RQ |
| Mills Close | ME12 2RJ |
| Minster Road | ME12 3JD ME12 3JE ME12 3JF ME12 3JH ME12 3JJ ME12 3FQ ME12 3JQ |
| Neats Court Cottages | ME12 3RJ |
| Pleasant Place | ME12 3JG |
| Plover End | ME12 3WL |
| Power Station Road | ME12 3TL |
| Queenborough Road | ME12 3BY ME12 3BZ ME12 3DA ME12 3DB ME12 3DE ME12 3DF ME12 3DG ME12 3DJ ME12 3EL ME12 3EN ME12 3EW ME12 3RH ME12 3DL ME12 3EU ME12 3RL |
| Raleigh Way | ME12 3BH |
| Redshank View | ME12 3WP |
| Rosemary Avenue | ME12 3HT ME12 3HU ME12 3HX |
| Sandpiper View | ME12 3WQ |
| Scotchmen Close | ME12 3BX |
| Selwood Close | ME12 3HR |
| Southdown Road | ME12 3BD ME12 3BE ME12 3BG |
| St Katherine Road | ME12 3AH |
| St Peters Close | ME12 3DD |
| Sunnyfields Drive | ME12 3DH ME12 3DQ |
| Swallow Place | ME12 3XA |
| The Crescent | ME12 3BQ |
| The Dell | ME12 3HY |
| The Rise | ME12 3EJ |
| Uplands Way | ME12 3EF ME12 3EH |
| Western Avenue | ME12 3BS |
| Whimbrel Drive | ME12 3XB |
| William Rigby Drive | ME12 3TE |
Transport near Queenborough And Halfway
- FAQ
- Price Paid By Year
- Property Type Price
Frequently asked questions about Queenborough And Halfway
What is the average price for a property for sale in Queenborough And Halfway?
The average price for a property for sale in Queenborough And Halfway is £294,937. This amount is 5% higher than the average price in Sheerness. There are 454 property listings for sale in Queenborough And Halfway.
What streets have the most expensive properties for sale in Queenborough And Halfway?
The streets with the most expensive properties for sale in Queenborough And Halfway are Uplands Way at an average of £387,000, Mills Close at an average of £385,000 and Bartletts Close at an average of £385,000.
What streets have the most affordable properties for sale in Queenborough And Halfway?
The streets with the most affordable properties for sale in Queenborough And Halfway are Fieldview Close at an average of £200,000, Belmont Road at an average of £215,000 and St Katherine Road at an average of £252,500.
Which train stations are available in or near Queenborough And Halfway?
Some of the train stations available in or near Queenborough And Halfway are Queenborough, Sheerness-On-Sea and Swale.
Property Price Paid in Queenborough And Halfway by Year
The average sold property price by year was:
| Year | Average Sold Price | Price Change |
Sold Properties
|
|---|---|---|---|
| 2025 | £309,600 | 10% |
60 Properties |
| 2024 | £278,846 | -7% |
66 Properties |
| 2023 | £298,442 | -5% |
52 Properties |
| 2022 | £312,451 | 9% |
67 Properties |
| 2021 | £284,558 | 7% |
111 Properties |
| 2020 | £264,399 | 6% |
83 Properties |
| 2019 | £248,606 | -0,4% |
65 Properties |
| 2018 | £249,701 | 1% |
68 Properties |
| 2017 | £248,104 | 13% |
81 Properties |
| 2016 | £214,797 | 9% |
70 Properties |
| 2015 | £196,205 | 9% |
84 Properties |
| 2014 | £179,110 | 15% |
62 Properties |
| 2013 | £153,004 | 2% |
58 Properties |
| 2012 | £149,766 | -4% |
58 Properties |
| 2011 | £156,136 | -3% |
55 Properties |
| 2010 | £161,259 | 0,2% |
46 Properties |
| 2009 | £160,921 | -5% |
58 Properties |
| 2008 | £168,176 | -7% |
48 Properties |
| 2007 | £179,384 | 8% |
113 Properties |
| 2006 | £164,836 | 6% |
89 Properties |
| 2005 | £155,673 | -1% |
84 Properties |
| 2004 | £157,240 | 11% |
111 Properties |
| 2003 | £140,249 | 21% |
84 Properties |
| 2002 | £111,234 | 20% |
102 Properties |
| 2001 | £88,790 | 6% |
98 Properties |
| 2000 | £83,651 | 12% |
129 Properties |
| 1999 | £73,324 | 7% |
156 Properties |
| 1998 | £68,552 | 8% |
120 Properties |
| 1997 | £62,877 | 2% |
113 Properties |
| 1996 | £61,685 | 8% |
82 Properties |
| 1995 | £56,820 | - |
83 Properties |
Property Price per Property Type in Queenborough And Halfway
Here you can find historic sold price data in order to help with your property search.
The average Property Paid Price for specific property types in the last three years are:
| Property Type | Average Sold Price | Sold Properties |
|---|---|---|
| Semi Detached House | £284,998.00 | 72 Semi Detached Houses |
| Detached House | £344,783.00 | 60 Detached Houses |
| Terraced House | £248,777.00 | 45 Terraced Houses |
| Flat | £97,000.00 | 1 Flat |

