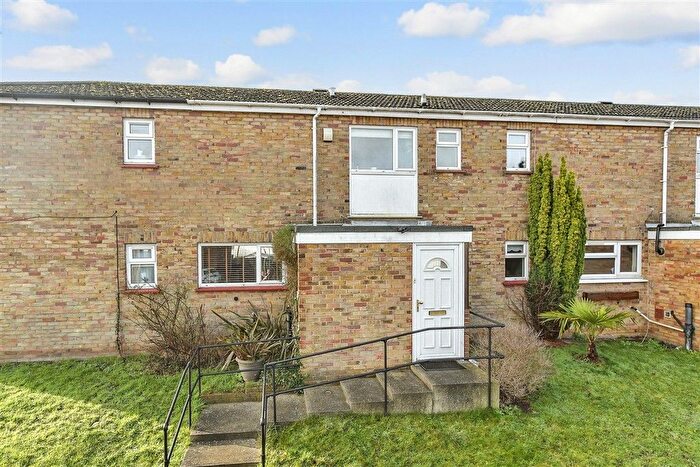
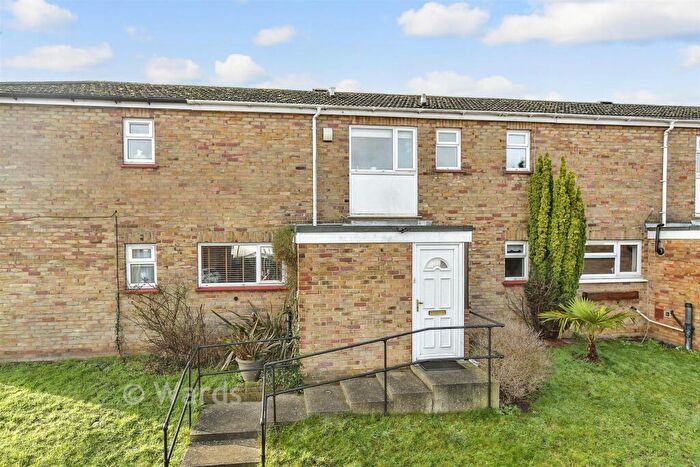
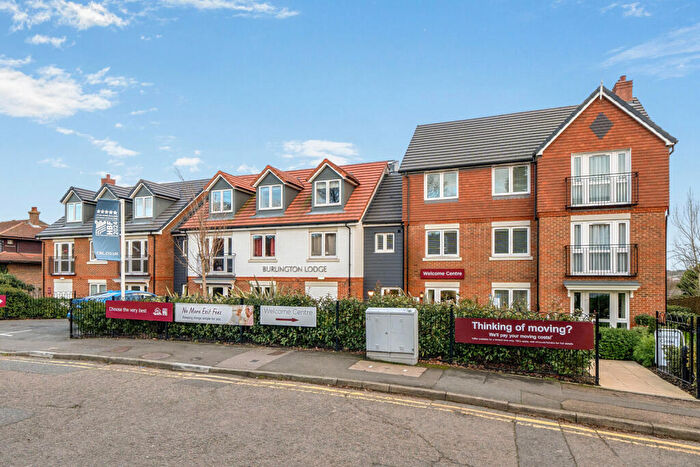
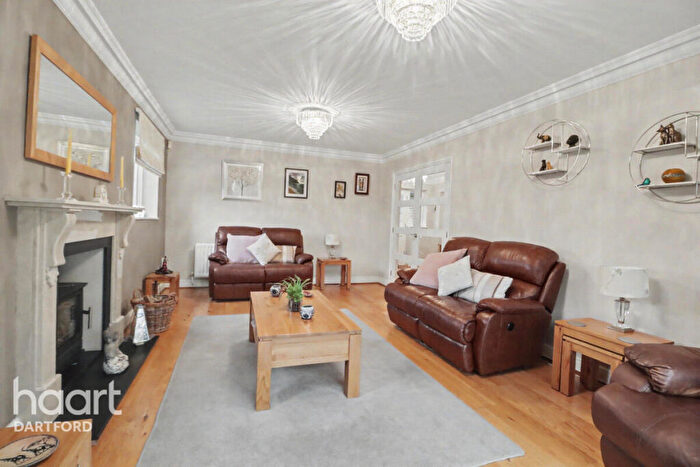
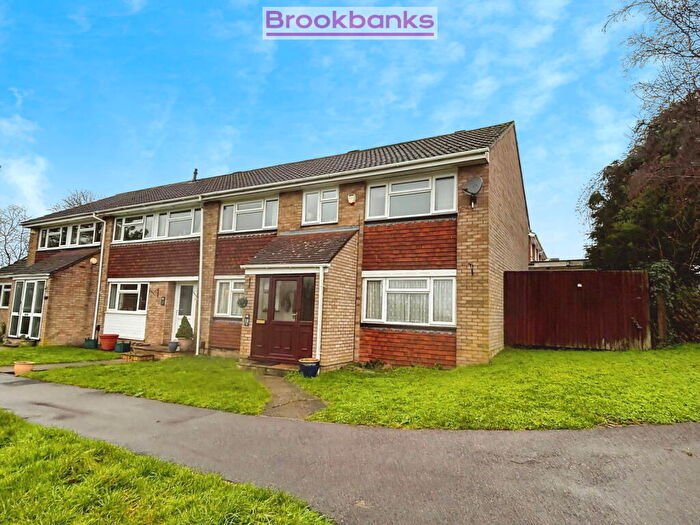
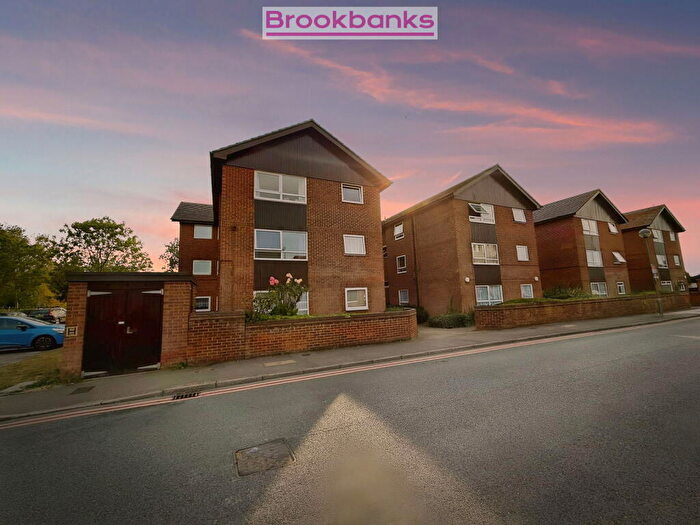
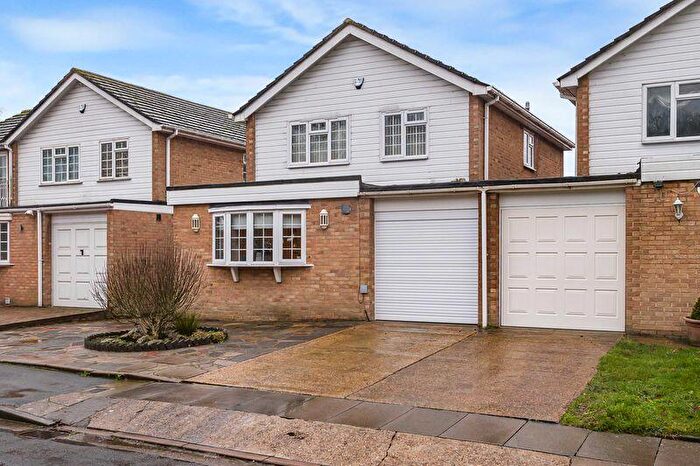
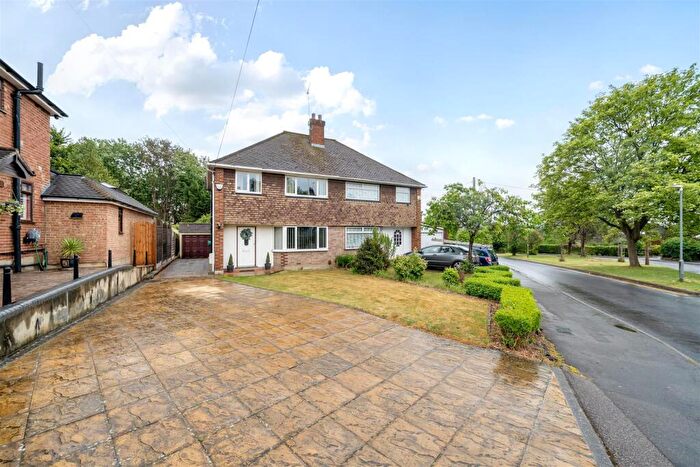
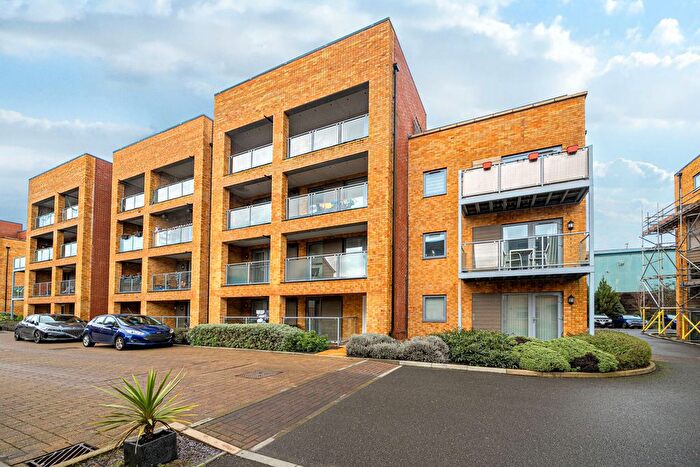
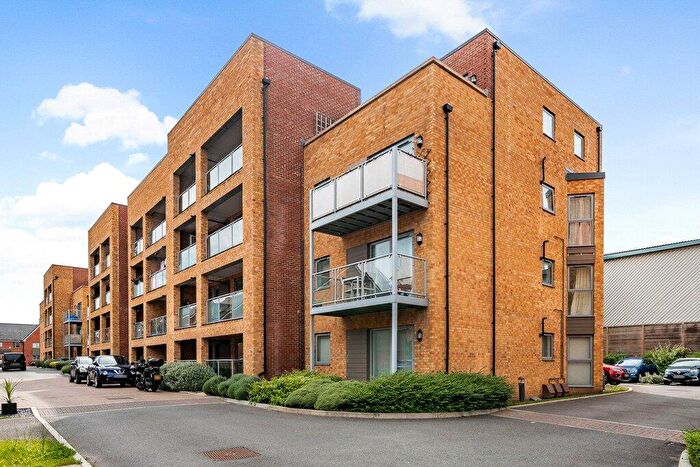
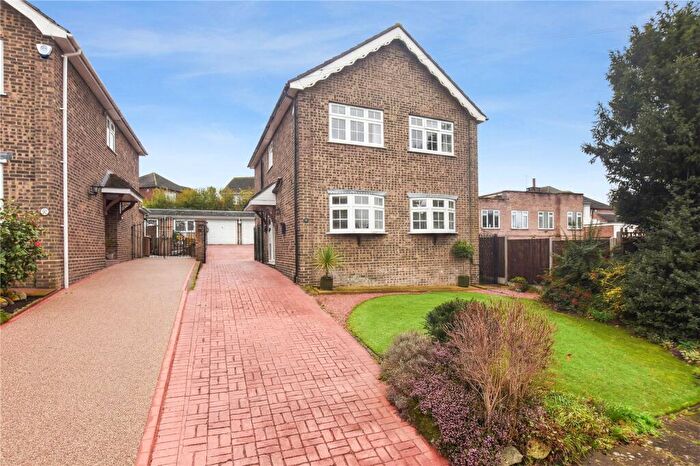
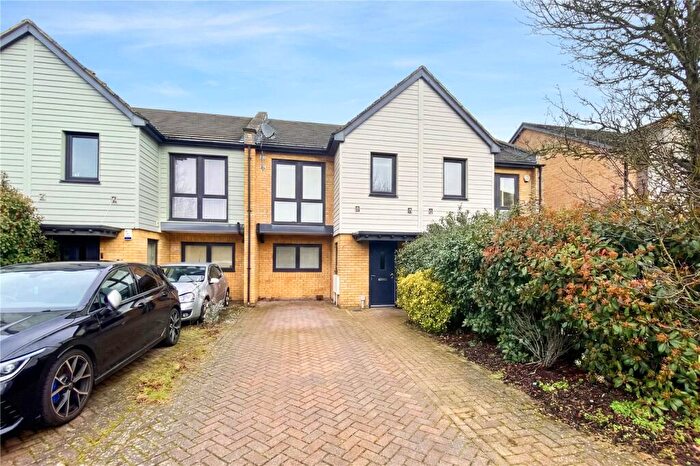
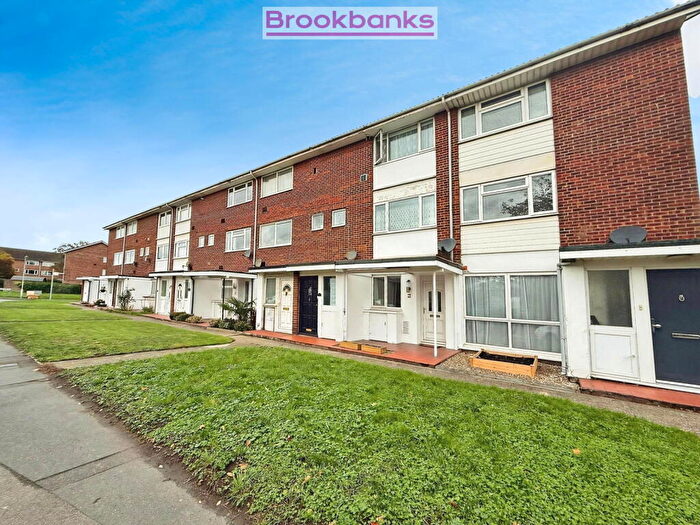
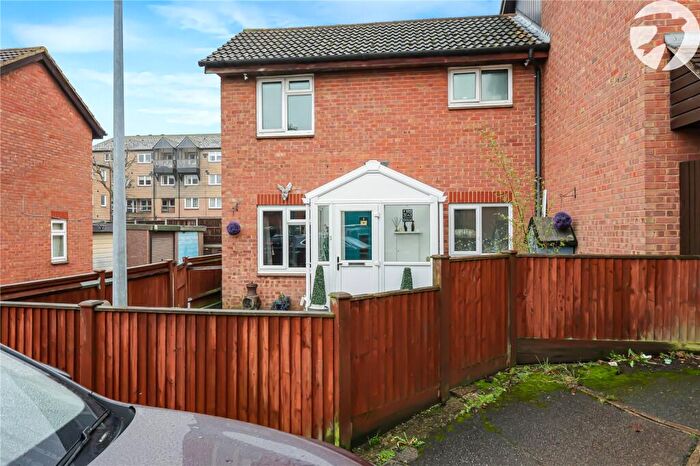
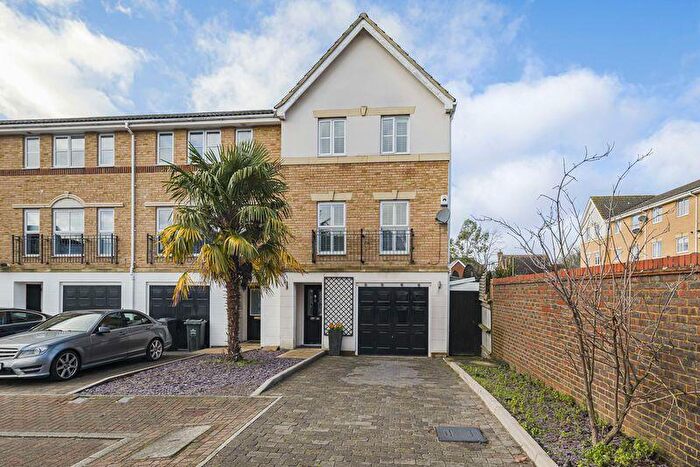
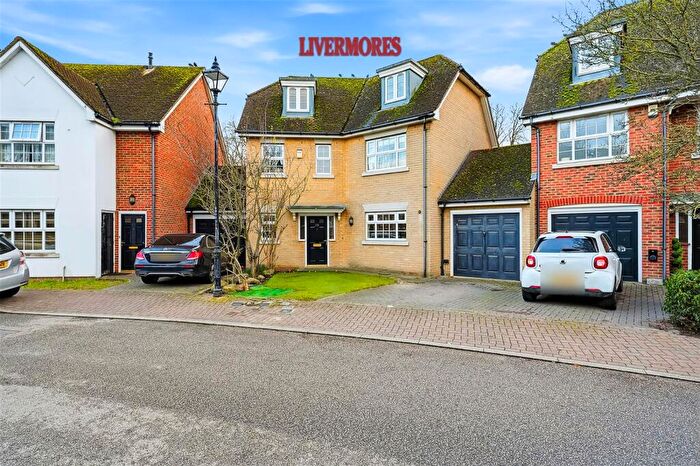
Houses for sale & to rent in Swanley, Kent
House Prices in Swanley
Properties in Swanley have an average house price of £395,781.00 and had 858 Property Transactions within the last 3 years.¹
Swanley is an area in Kent with 9,143 households², where the most expensive property was sold for £3,750,001.00.
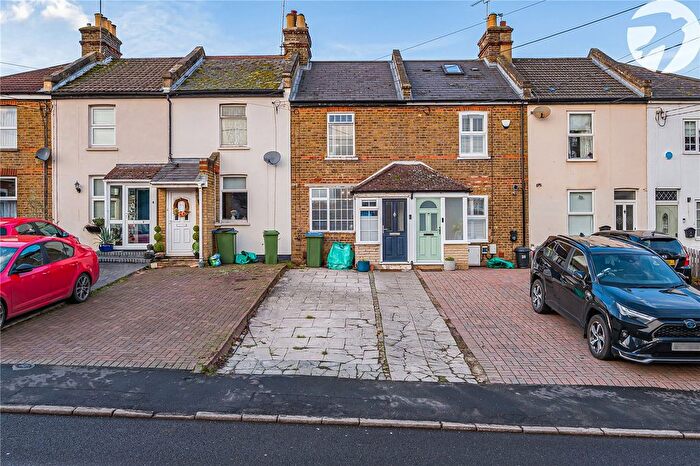
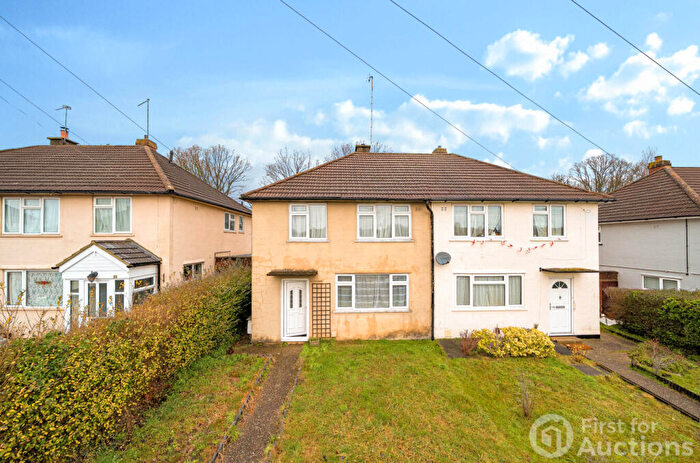
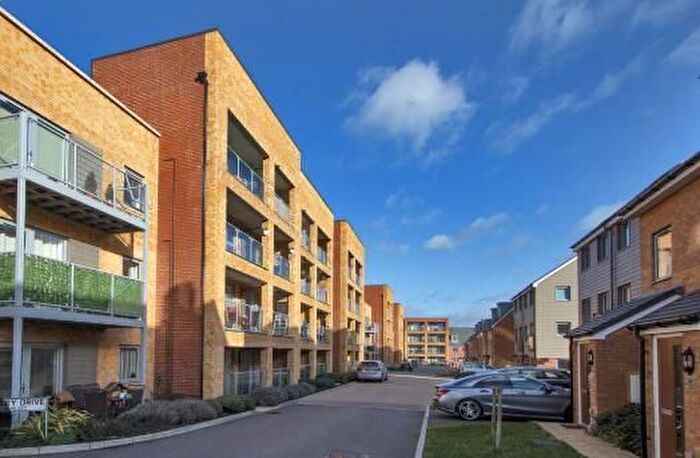
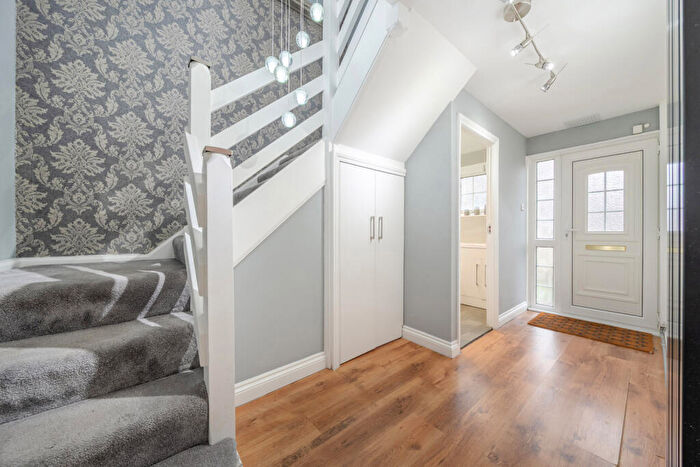
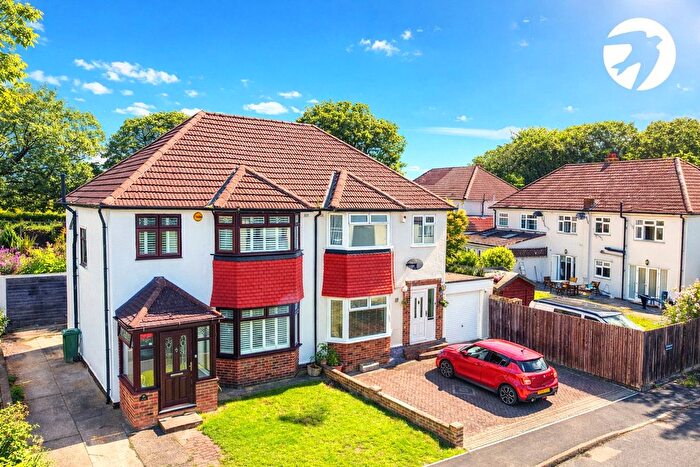
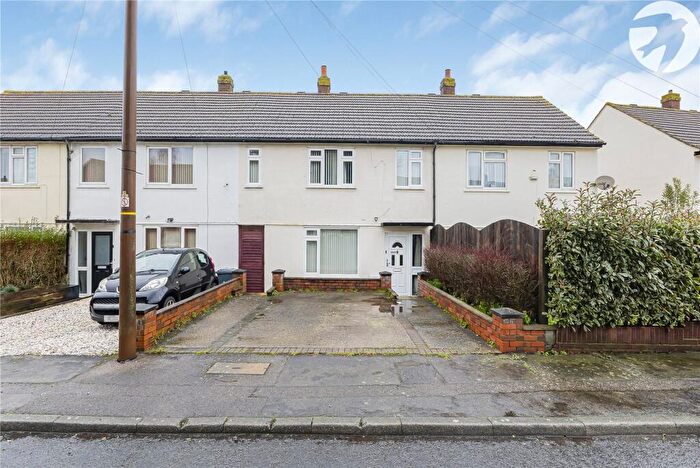
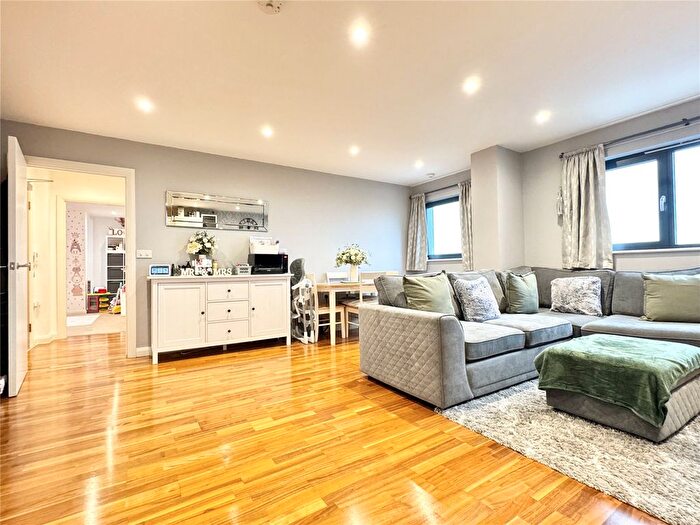
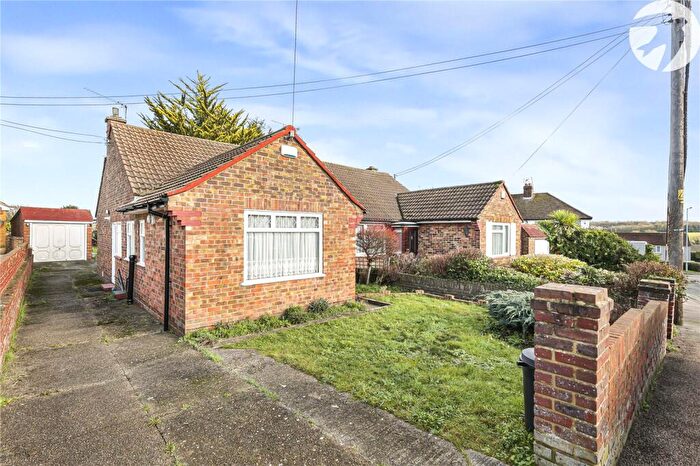
Properties for sale in Swanley
Neighbourhoods in Swanley
Navigate through our locations to find the location of your next house in Swanley, Kent for sale or to rent.
Transport in Swanley
Please see below transportation links in this area:
- FAQ
- Price Paid By Year
- Property Type Price
Frequently asked questions about Swanley
What is the average price for a property for sale in Swanley?
The average price for a property for sale in Swanley is £395,781. This amount is 0.91% higher than the average price in Kent. There are 3,246 property listings for sale in Swanley.
What locations have the most expensive properties for sale in Swanley?
The locations with the most expensive properties for sale in Swanley are Sutton-at-hone And Hawley at an average of £570,999, Hextable at an average of £459,672 and Crockenhill And Well Hill at an average of £446,640.
What locations have the most affordable properties for sale in Swanley?
The locations with the most affordable properties for sale in Swanley are Swanley White Oak at an average of £349,959, Swanley St Marys at an average of £379,770 and Swanley Christchurch And Swanley Village at an average of £404,016.
Which train stations are available in or near Swanley?
Some of the train stations available in or near Swanley are Swanley, Farningham Road and Eynsford.
Property Price Paid in Swanley by Year
The average sold property price by year was:
| Year | Average Sold Price | Price Change |
Sold Properties
|
|---|---|---|---|
| 2025 | £408,843 | 4% |
269 Properties |
| 2024 | £392,487 | 1% |
277 Properties |
| 2023 | £387,443 | -7% |
312 Properties |
| 2022 | £416,251 | 6% |
300 Properties |
| 2021 | £391,248 | 9% |
429 Properties |
| 2020 | £357,609 | 3% |
326 Properties |
| 2019 | £348,322 | -1% |
366 Properties |
| 2018 | £350,695 | 4% |
341 Properties |
| 2017 | £338,377 | 11% |
342 Properties |
| 2016 | £299,559 | 11% |
345 Properties |
| 2015 | £266,340 | 11% |
318 Properties |
| 2014 | £237,590 | 9% |
321 Properties |
| 2013 | £216,635 | -5% |
275 Properties |
| 2012 | £228,428 | 10% |
238 Properties |
| 2011 | £206,260 | 4% |
247 Properties |
| 2010 | £198,818 | -1% |
234 Properties |
| 2009 | £201,586 | -7% |
174 Properties |
| 2008 | £215,027 | -3% |
216 Properties |
| 2007 | £221,059 | 7% |
397 Properties |
| 2006 | £205,649 | 4% |
450 Properties |
| 2005 | £198,354 | -0,4% |
331 Properties |
| 2004 | £199,183 | 6% |
407 Properties |
| 2003 | £186,392 | 20% |
392 Properties |
| 2002 | £148,391 | 9% |
411 Properties |
| 2001 | £135,601 | 17% |
397 Properties |
| 2000 | £112,129 | 12% |
333 Properties |
| 1999 | £99,219 | 12% |
374 Properties |
| 1998 | £87,548 | 1% |
335 Properties |
| 1997 | £86,629 | 7% |
396 Properties |
| 1996 | £80,892 | 9% |
297 Properties |
| 1995 | £73,777 | - |
263 Properties |
Property Price per Property Type in Swanley
Here you can find historic sold price data in order to help with your property search.
The average Property Paid Price for specific property types in the last three years are:
| Property Type | Average Sold Price | Sold Properties |
|---|---|---|
| Semi Detached House | £432,667.00 | 339 Semi Detached Houses |
| Detached House | £591,556.00 | 102 Detached Houses |
| Terraced House | £361,775.00 | 256 Terraced Houses |
| Flat | £248,152.00 | 161 Flats |

