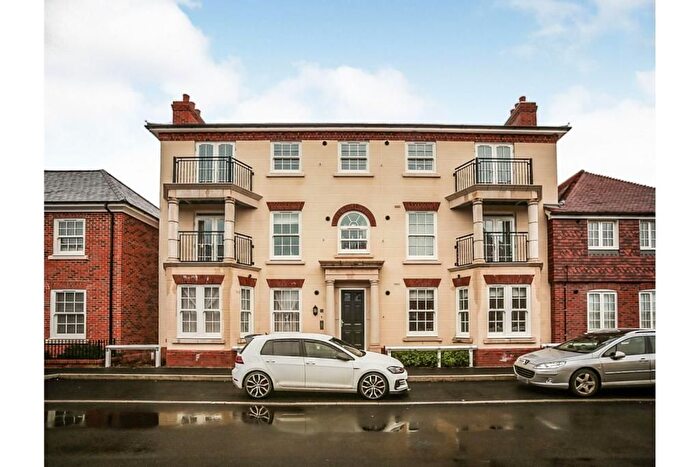
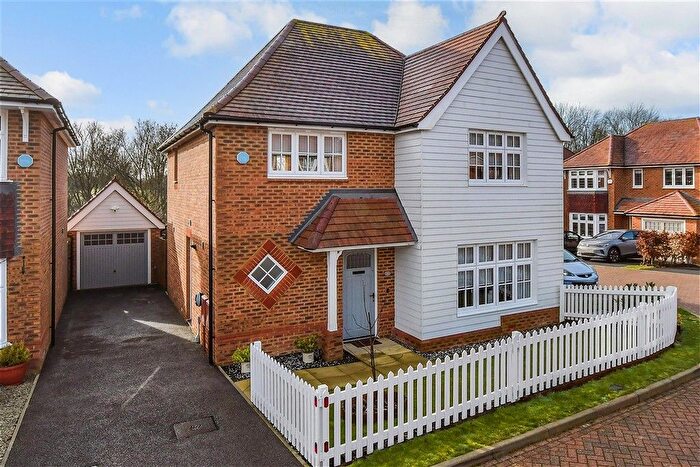
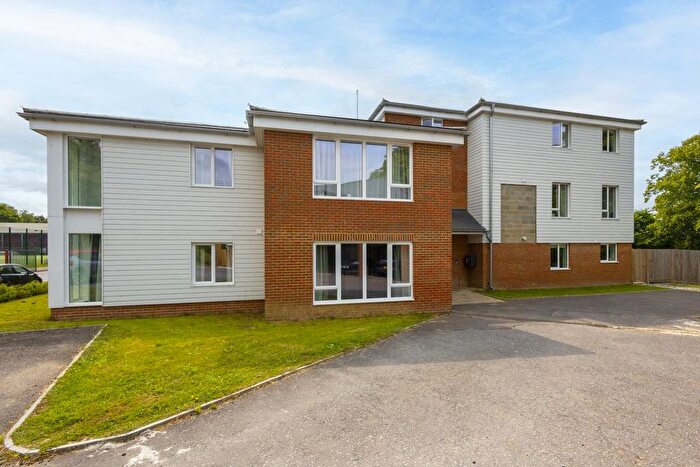
Houses for sale & to rent in Tenterden South, Tenterden
House Prices in Tenterden South
Properties in Tenterden South have an average house price of £487,176.00 and had 144 Property Transactions within the last 3 years¹.
Tenterden South is an area in Tenterden, Kent with 1,072 households², where the most expensive property was sold for £1,480,000.00.
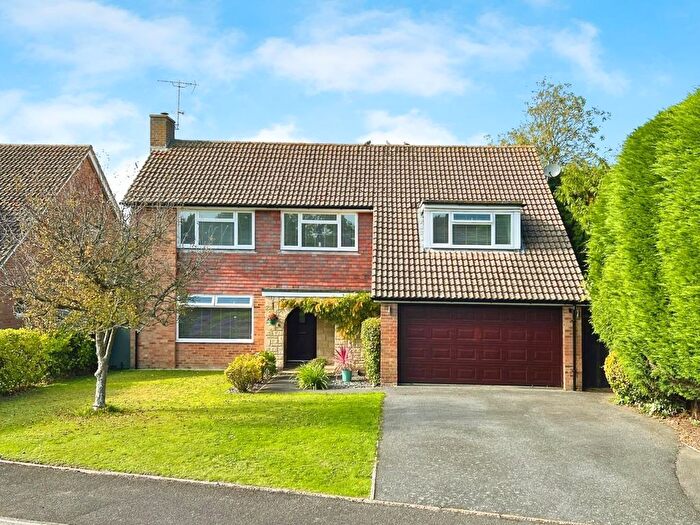
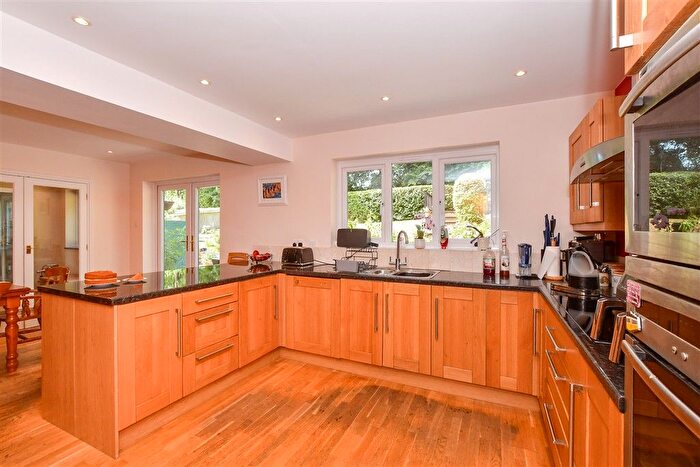
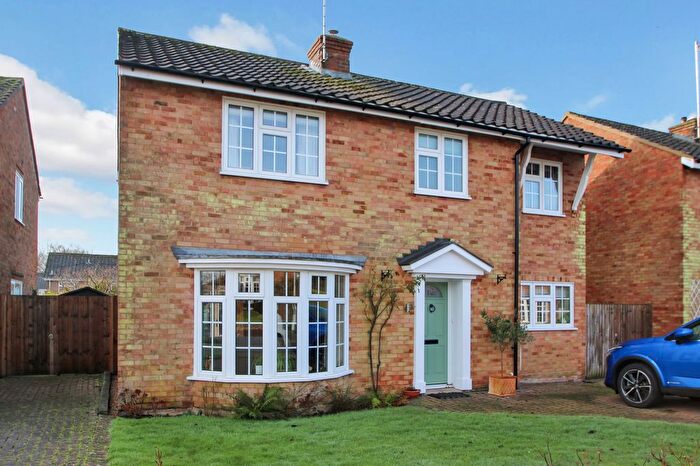
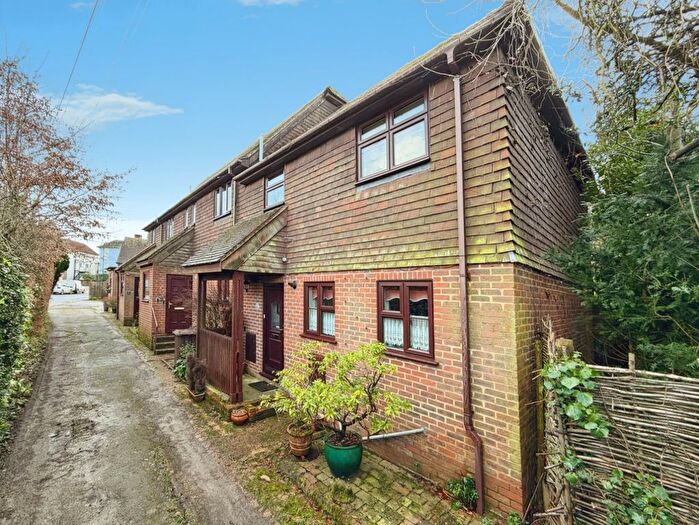
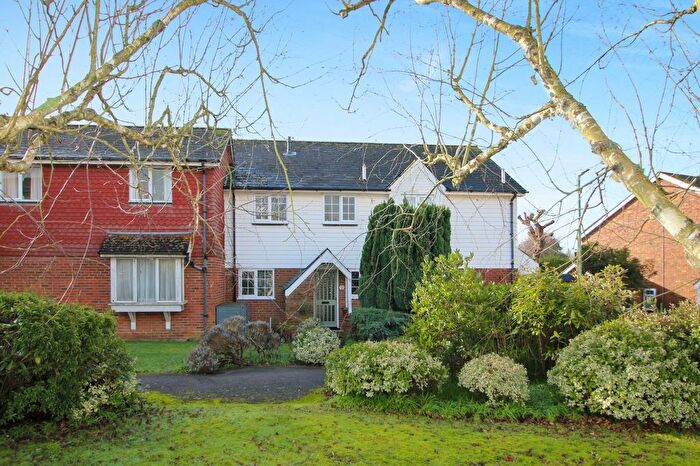
Properties for sale in Tenterden South
Previously listed properties in Tenterden South
Roads and Postcodes in Tenterden South
Navigate through our locations to find the location of your next house in Tenterden South, Tenterden for sale or to rent.
| Streets | Postcodes |
|---|---|
| Abbott Way | TN30 7BZ |
| Acorn Road | TN30 7FA |
| Appledore Road | TN30 7AY TN30 7BD TN30 7BE TN30 7DB TN30 7DD TN30 7DF TN30 7DG TN30 7DH TN30 7DJ TN30 7DE TN30 7DL |
| Austens Orchard | TN30 7LQ |
| Beacon Oak Road | TN30 6RW TN30 6RX TN30 6RY TN30 6RZ |
| Beacon Walk | TN30 6SF |
| Bells Close | TN30 6EU |
| Bells Lane | TN30 6ES |
| Bennetts Mews | TN30 6JN |
| Bishop Crescent | TN30 7BF |
| Bramley Grove | TN30 7FB |
| Bridewell Lane | TN30 6EY TN30 6FA |
| Burgess Drive | TN30 6FD |
| Burgess Row | TN30 6JU |
| Cherry Orchard | TN30 7LP |
| Collison Place | TN30 7BU |
| Craythorne | TN30 6SA TN30 6SB TN30 6SD |
| Cruttenden Close | TN30 7AB |
| East Hill | TN30 6RL |
| Eastgate Road | TN30 7AH |
| Elmfield | TN30 6RE |
| Fuggle Drive | TN30 6FJ |
| Goodsall Road | TN30 7DX |
| Hales Close | TN30 6RJ |
| High Street | TN30 6BD TN30 6BJ TN30 6JS TN30 6JY TN30 6LB TN30 6BB TN30 6BH TN30 6BN |
| Highbury Lane | TN30 6LE |
| Holdstock Road | TN30 7DU |
| Ivy Court | TN30 6RB |
| Kiln Field | TN30 7BY |
| Limes Close | TN30 7BB |
| Longfield | TN30 7NH |
| Malt House Lane | TN30 6LA |
| Martins Close | TN30 7AJ |
| Mayors Place | TN30 6JX |
| Mercer Drive | TN30 6FB |
| Mount Pleasant | TN30 7AG |
| Oaks Road | TN30 6RF TN30 6RH |
| Old Tannery Close | TN30 7LJ |
| Pierce Lane | TN30 6FE |
| Preston Lane | TN30 7DN TN30 7DW |
| Priory Way | TN30 7BX |
| Reading Street | TN30 7HS TN30 7HT TN30 7LA |
| Recreation Ground Road | TN30 6BL TN30 6BS TN30 6FH TN30 6RA |
| Roethorne Gardens | TN30 6RU |
| Rother Drive | TN30 7EZ |
| Sandy Lane | TN30 7DA |
| Sayers Lane | TN30 6BW |
| Shrubcote | TN30 7BA TN30 7BG TN30 7BH TN30 7BJ TN30 7BN TN30 7BP TN30 7BW |
| Six Fields | TN30 6EX |
| Smallhythe Road | TN30 7EQ |
| Southgate Road | TN30 7BS |
| Stace Close | TN30 6RP |
| The Croft | TN30 6RG |
| Theatre Square | TN30 6ET |
| Three Fields Road | TN30 7AQ TN30 7DY TN30 7DZ |
| Tilden Gill Road | TN30 7BQ |
| West Cross | TN30 6JR |
| William Judge Close | TN30 7DS |
| Willow Tree | TN30 6LD |
| Woodbury Lane | TN30 6JH |
| Woodchurch Road | TN30 7AD TN30 7AE TN30 7AN TN30 7DR TN30 7DP |
| TN30 6FL TN30 7BL |
Transport near Tenterden South
-
Appledore Station
-
Pluckley Station
-
Ham Street Station
-
Headcorn Station
-
Rye Station
-
Winchelsea Station
-
Ashford International Station
-
Staplehurst Station
- FAQ
- Price Paid By Year
- Property Type Price
Frequently asked questions about Tenterden South
What is the average price for a property for sale in Tenterden South?
The average price for a property for sale in Tenterden South is £487,176. This amount is 2% lower than the average price in Tenterden. There are 869 property listings for sale in Tenterden South.
What streets have the most expensive properties for sale in Tenterden South?
The streets with the most expensive properties for sale in Tenterden South are East Hill at an average of £1,195,000, Woodchurch Road at an average of £946,250 and Reading Street at an average of £877,500.
What streets have the most affordable properties for sale in Tenterden South?
The streets with the most affordable properties for sale in Tenterden South are Pierce Lane at an average of £76,500, Recreation Ground Road at an average of £157,500 and Priory Way at an average of £201,833.
Which train stations are available in or near Tenterden South?
Some of the train stations available in or near Tenterden South are Appledore, Pluckley and Ham Street.
Property Price Paid in Tenterden South by Year
The average sold property price by year was:
| Year | Average Sold Price | Price Change |
Sold Properties
|
|---|---|---|---|
| 2025 | £502,681 | 8% |
44 Properties |
| 2024 | £464,941 | -9% |
61 Properties |
| 2023 | £504,461 | 7% |
39 Properties |
| 2022 | £469,160 | -10% |
46 Properties |
| 2021 | £514,378 | 4% |
82 Properties |
| 2020 | £494,735 | 12% |
97 Properties |
| 2019 | £434,885 | 10% |
105 Properties |
| 2018 | £390,164 | -19% |
131 Properties |
| 2017 | £462,509 | 20% |
41 Properties |
| 2016 | £370,220 | -13% |
41 Properties |
| 2015 | £419,342 | 18% |
49 Properties |
| 2014 | £345,012 | 16% |
54 Properties |
| 2013 | £290,921 | -28% |
46 Properties |
| 2012 | £372,209 | 22% |
36 Properties |
| 2011 | £289,777 | -17% |
34 Properties |
| 2010 | £338,804 | 23% |
50 Properties |
| 2009 | £260,576 | -8% |
26 Properties |
| 2008 | £282,468 | 3% |
36 Properties |
| 2007 | £274,249 | -15% |
74 Properties |
| 2006 | £316,412 | 3% |
81 Properties |
| 2005 | £306,900 | 13% |
49 Properties |
| 2004 | £268,263 | 1% |
79 Properties |
| 2003 | £266,451 | 25% |
58 Properties |
| 2002 | £200,883 | 14% |
60 Properties |
| 2001 | £173,355 | 13% |
38 Properties |
| 2000 | £151,000 | 12% |
50 Properties |
| 1999 | £133,263 | 5% |
45 Properties |
| 1998 | £126,058 | 18% |
49 Properties |
| 1997 | £103,388 | -1% |
73 Properties |
| 1996 | £104,390 | 5% |
72 Properties |
| 1995 | £98,784 | - |
41 Properties |
Property Price per Property Type in Tenterden South
Here you can find historic sold price data in order to help with your property search.
The average Property Paid Price for specific property types in the last three years are:
| Property Type | Average Sold Price | Sold Properties |
|---|---|---|
| Semi Detached House | £528,137.00 | 40 Semi Detached Houses |
| Detached House | £709,602.00 | 44 Detached Houses |
| Terraced House | £355,500.00 | 29 Terraced Houses |
| Flat | £241,804.00 | 31 Flats |

