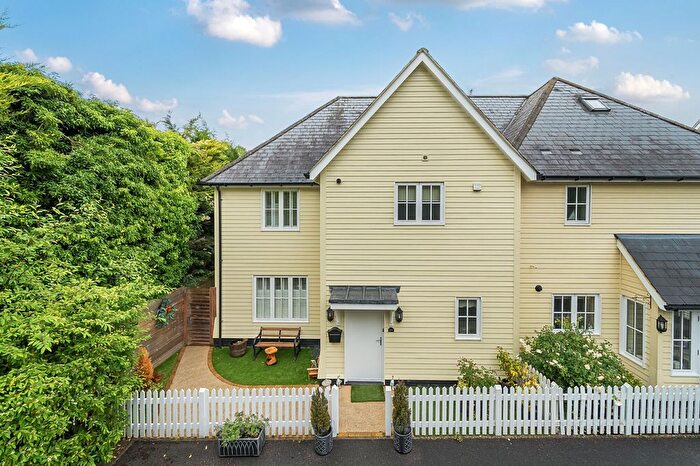
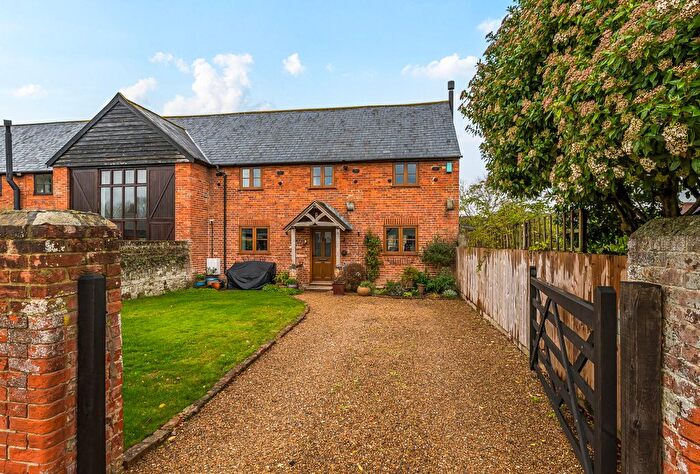
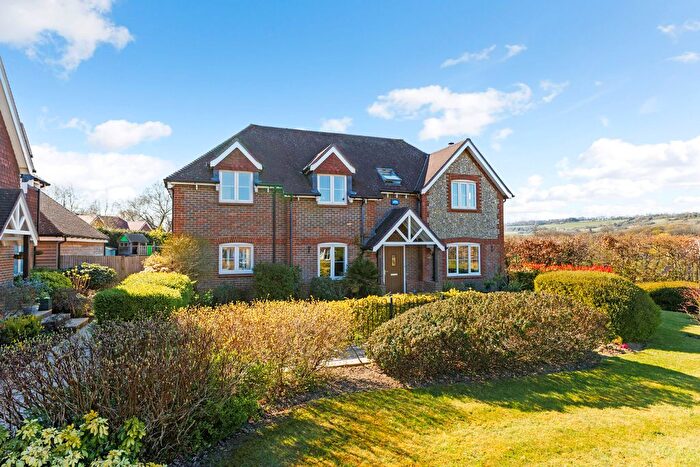
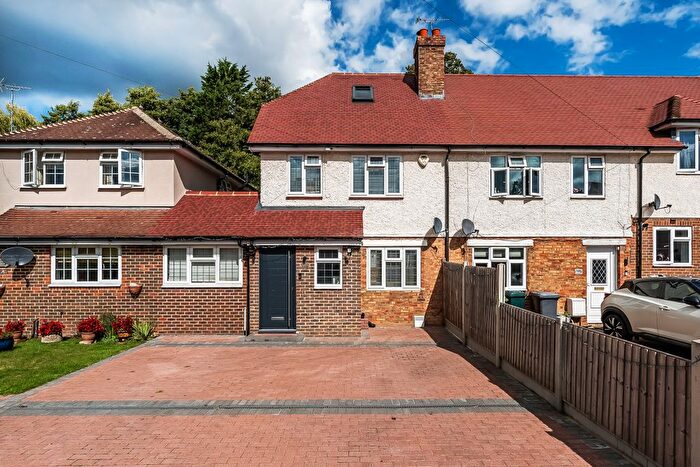
Houses for sale & to rent in Brasted, Chevening And Sundridge, Westerham
House Prices in Brasted, Chevening And Sundridge
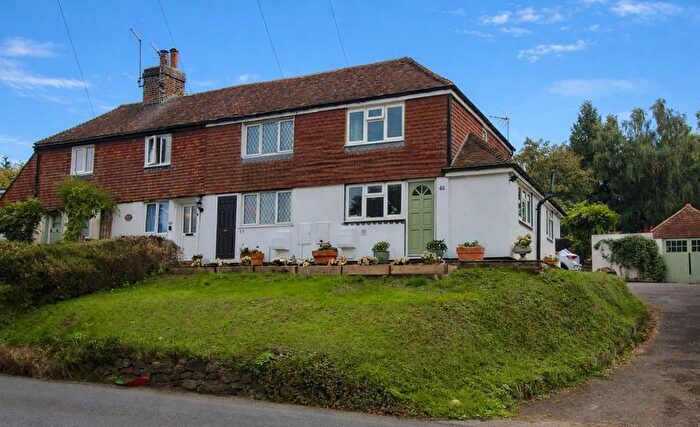
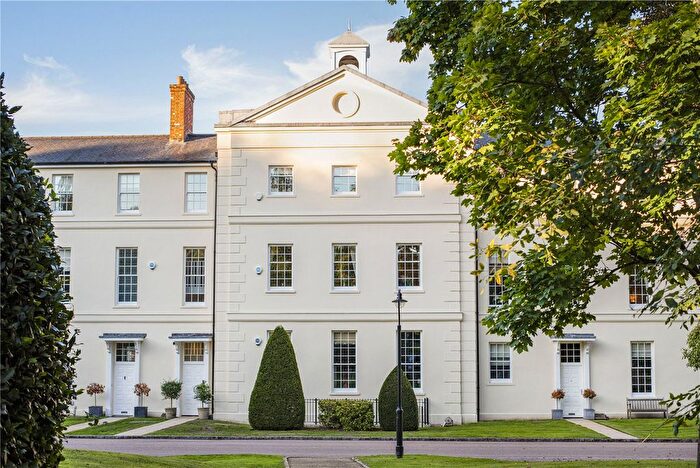
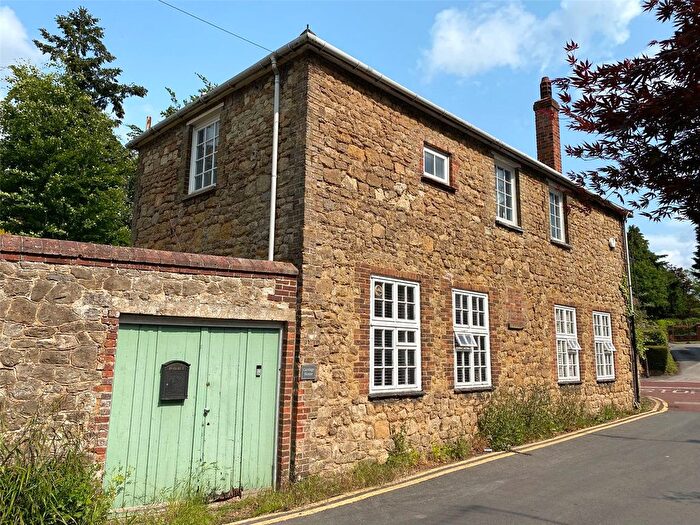
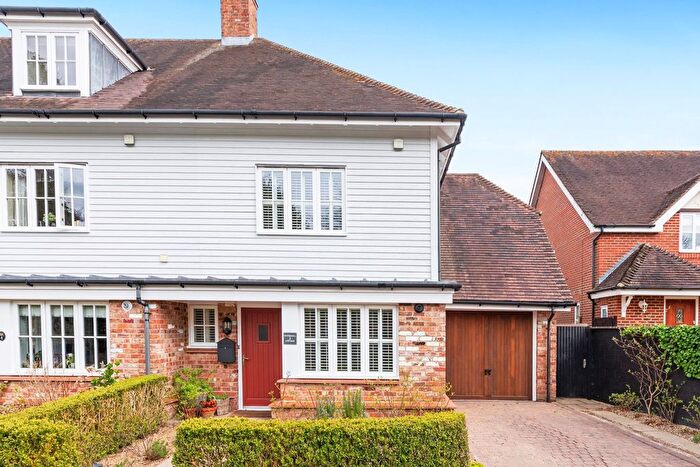
Properties in Brasted, Chevening And Sundridge have an average house price of £821,888.00 and had 52 Property Transactions within the last 3 years¹.
Brasted, Chevening And Sundridge is an area in Westerham, Kent with 526 households², where the most expensive property was sold for £3,350,000.00.
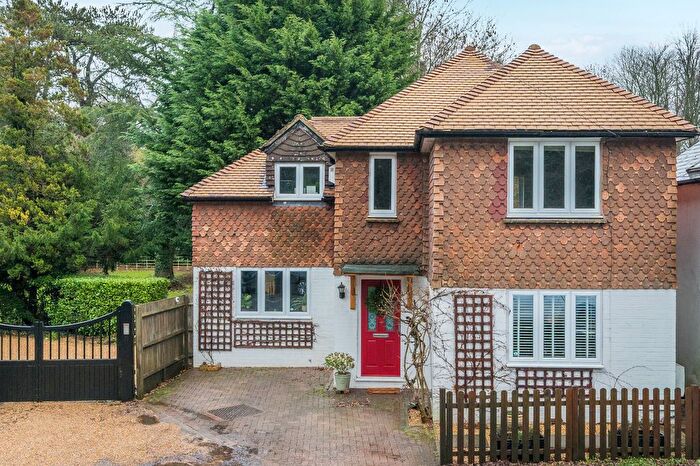
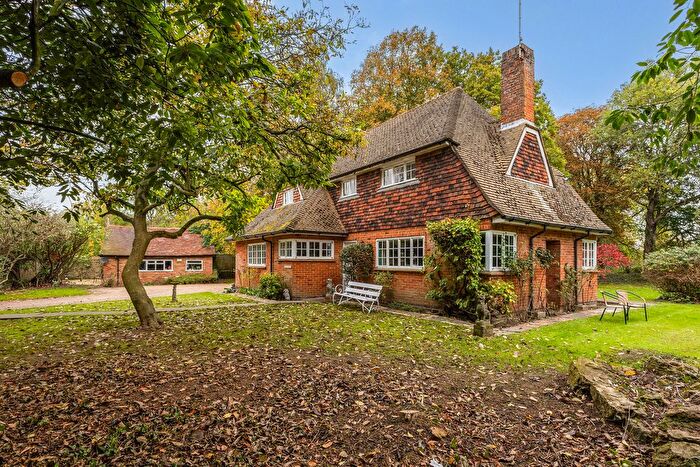
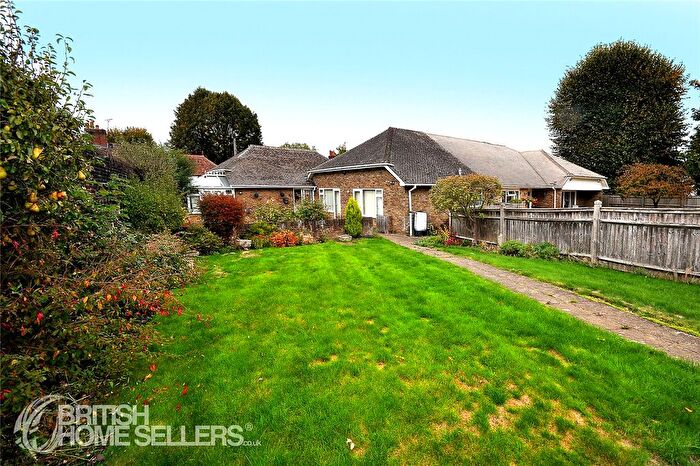
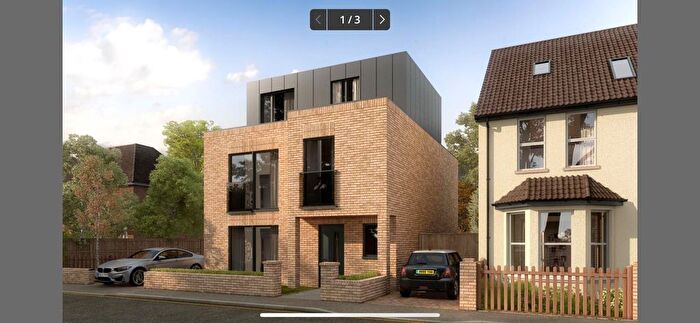
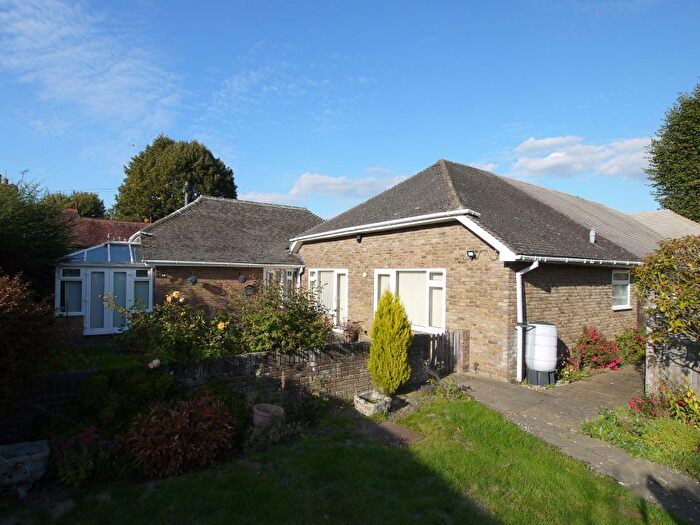
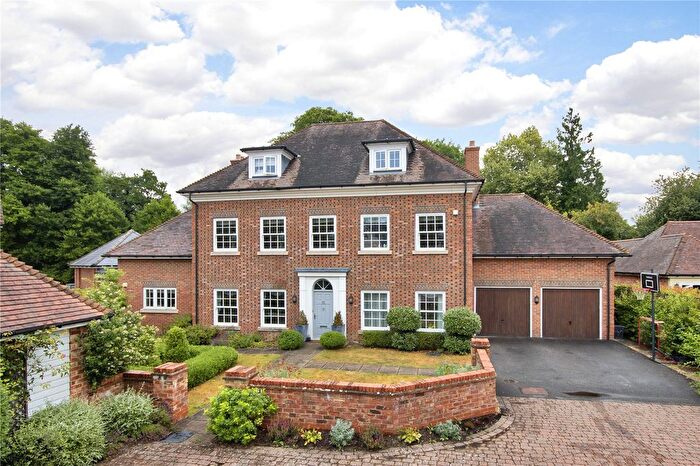
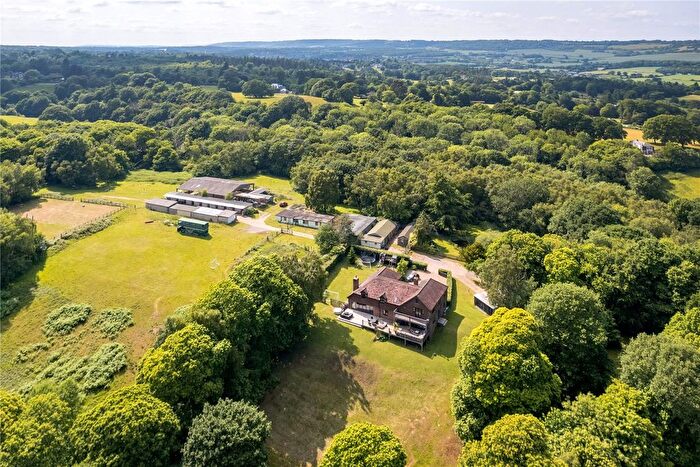
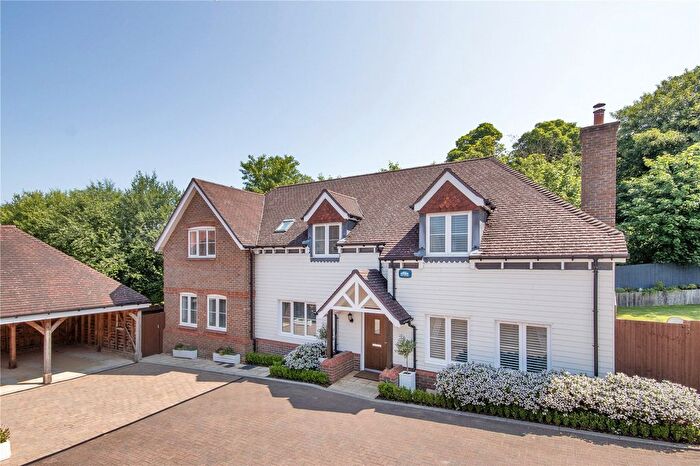
Properties for sale in Brasted, Chevening And Sundridge
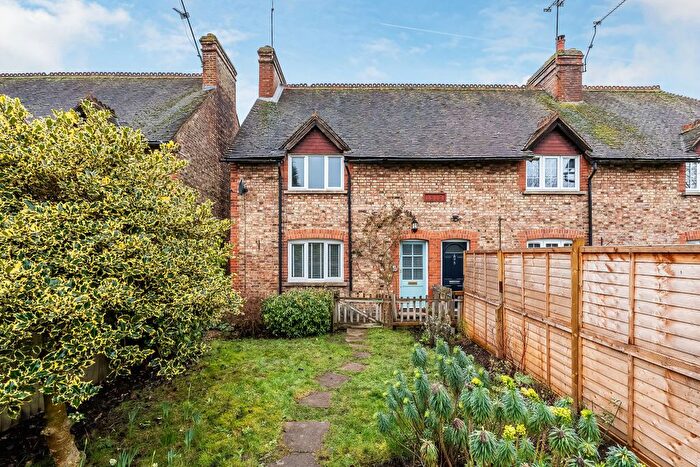
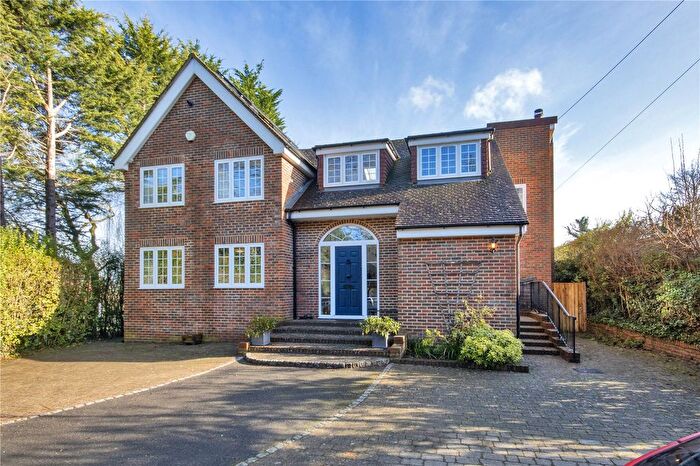
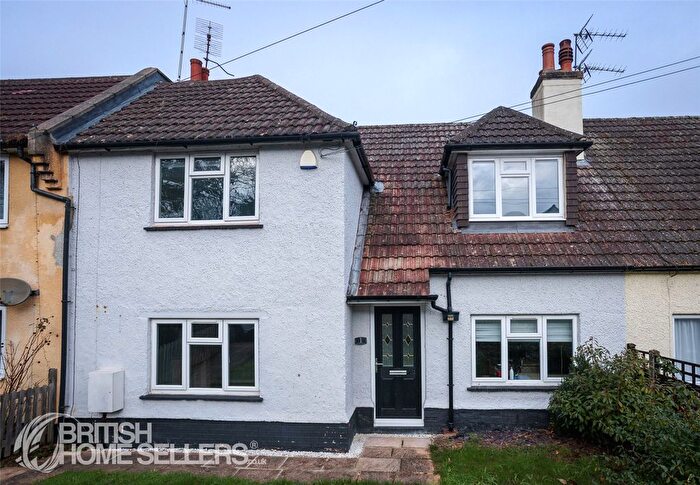
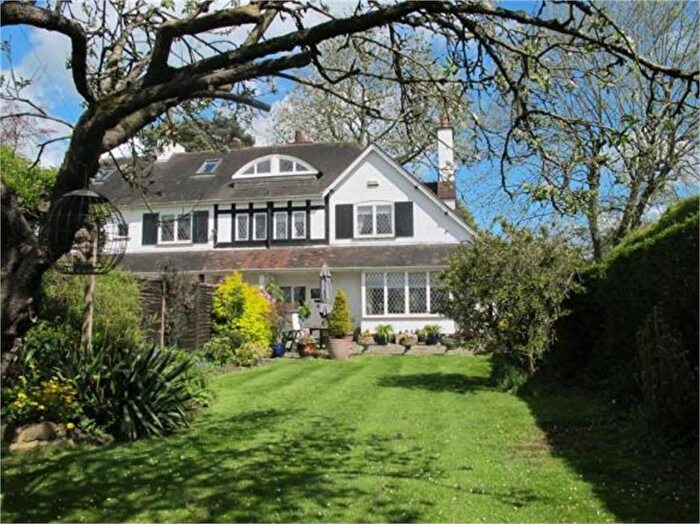
Previously listed properties in Brasted, Chevening And Sundridge
Roads and Postcodes in Brasted, Chevening And Sundridge
Navigate through our locations to find the location of your next house in Brasted, Chevening And Sundridge, Westerham for sale or to rent.
| Streets | Postcodes |
|---|---|
| Algernon Terrace | TN16 1HR |
| Alms Row | TN16 1HU |
| Brasted Hill Road | TN16 1NJ |
| Brasted Road | TN16 1LL |
| Canons Walk | TN16 1NA |
| Chart Lane | TN16 1LN TN16 1LR |
| Church Road | TN16 1HY TN16 1HZ |
| Coles Lane | TN16 1NN TN16 1NR |
| Colinette Cottages | TN16 1LP |
| Elliotts Lane | TN16 1JD |
| Glebe Cottages | TN16 1NS |
| Hawthorn Cottages | TN16 1HP |
| High Street | TN16 1HL TN16 1HN TN16 1HS TN16 1JA TN16 1JB TN16 1JE TN16 1JJ TN16 1JN TN16 1HW TN16 1JF |
| Hogtrough Hill | TN16 1NU TN16 1NX |
| Horizon Close | TN16 1DH |
| Lower Chart Cottages | TN16 1LS |
| Magdala Cottages | TN16 1LQ |
| Mulberry Place | TN16 1DB |
| Old Bull Mews | TN16 1FA |
| Pipers Green Road | TN16 1ND |
| Pipers Lane | TN16 1NE |
| Puddledock Lane | TN16 1PY |
| Pym Orchard | TN16 1JT |
| Rectory Lane | TN16 1JU TN16 1NH TN16 1JQ TN16 1JR TN16 1JS |
| St Martins Meadow | TN16 1NL |
| Station Road | TN16 1NT |
| Tally Ho Cottages | TN16 1QD |
| The Carriage Way | TN16 1JX |
| The Green | TN16 1JL |
| The Old Yard | TN16 1JP |
| Thorns Meadow | TN16 1NP |
| Toys Hill | TN16 1QB TN16 1QE TN16 1QG |
| Watermill Close | TN16 1DG |
| West End | TN16 1HT |
| Westerham Road | TN16 1FH TN16 1HJ |
| Wilkins Way | TN16 1JG |
| Woodside Cottages | TN16 1LZ |
| TN16 1LU TN16 1LX TN16 1LY TN16 1NB TN16 1LW TN16 1NG |
Transport near Brasted, Chevening And Sundridge
-
Sevenoaks Station
-
Dunton Green Station
-
Bat and Ball Station
-
Edenbridge Station
-
Hurst Green Station
-
Oxted Station
-
Otford Station
- FAQ
- Price Paid By Year
- Property Type Price
Frequently asked questions about Brasted, Chevening And Sundridge
What is the average price for a property for sale in Brasted, Chevening And Sundridge?
The average price for a property for sale in Brasted, Chevening And Sundridge is £821,888. This amount is 30% higher than the average price in Westerham. There are 228 property listings for sale in Brasted, Chevening And Sundridge.
What streets have the most expensive properties for sale in Brasted, Chevening And Sundridge?
The streets with the most expensive properties for sale in Brasted, Chevening And Sundridge are Puddledock Lane at an average of £1,775,000, Colinette Cottages at an average of £1,400,000 and Toys Hill at an average of £1,347,500.
What streets have the most affordable properties for sale in Brasted, Chevening And Sundridge?
The streets with the most affordable properties for sale in Brasted, Chevening And Sundridge are Alms Row at an average of £312,500, Elliotts Lane at an average of £387,500 and Church Road at an average of £425,000.
Which train stations are available in or near Brasted, Chevening And Sundridge?
Some of the train stations available in or near Brasted, Chevening And Sundridge are Sevenoaks, Dunton Green and Bat and Ball.
Property Price Paid in Brasted, Chevening And Sundridge by Year
The average sold property price by year was:
| Year | Average Sold Price | Price Change |
Sold Properties
|
|---|---|---|---|
| 2025 | £952,040 | 3% |
11 Properties |
| 2024 | £920,236 | 27% |
19 Properties |
| 2023 | £671,875 | -2% |
22 Properties |
| 2022 | £684,947 | 20% |
19 Properties |
| 2021 | £551,040 | -78% |
25 Properties |
| 2020 | £981,502 | 22% |
23 Properties |
| 2019 | £761,681 | 4% |
21 Properties |
| 2018 | £734,750 | -10% |
20 Properties |
| 2017 | £809,200 | 29% |
15 Properties |
| 2016 | £574,849 | -9% |
16 Properties |
| 2015 | £629,009 | 19% |
22 Properties |
| 2014 | £507,757 | -16% |
25 Properties |
| 2013 | £589,776 | -24% |
32 Properties |
| 2012 | £733,062 | 31% |
16 Properties |
| 2011 | £506,313 | -19% |
19 Properties |
| 2010 | £600,472 | -2% |
20 Properties |
| 2009 | £615,056 | 22% |
28 Properties |
| 2008 | £481,842 | 3% |
19 Properties |
| 2007 | £468,350 | -1% |
20 Properties |
| 2006 | £472,673 | 5% |
17 Properties |
| 2005 | £450,313 | 9% |
23 Properties |
| 2004 | £408,097 | -4% |
19 Properties |
| 2003 | £423,050 | 35% |
20 Properties |
| 2002 | £276,888 | -1% |
18 Properties |
| 2001 | £280,734 | -10% |
20 Properties |
| 2000 | £307,655 | 35% |
19 Properties |
| 1999 | £200,268 | 13% |
24 Properties |
| 1998 | £173,550 | -30% |
19 Properties |
| 1997 | £226,280 | 36% |
23 Properties |
| 1996 | £143,835 | 9% |
17 Properties |
| 1995 | £130,781 | - |
8 Properties |
Property Price per Property Type in Brasted, Chevening And Sundridge
Here you can find historic sold price data in order to help with your property search.
The average Property Paid Price for specific property types in the last three years are:
| Property Type | Average Sold Price | Sold Properties |
|---|---|---|
| Semi Detached House | £546,200.00 | 10 Semi Detached Houses |
| Detached House | £1,324,464.00 | 21 Detached Houses |
| Terraced House | £382,467.00 | 17 Terraced Houses |
| Flat | £740,125.00 | 4 Flats |

