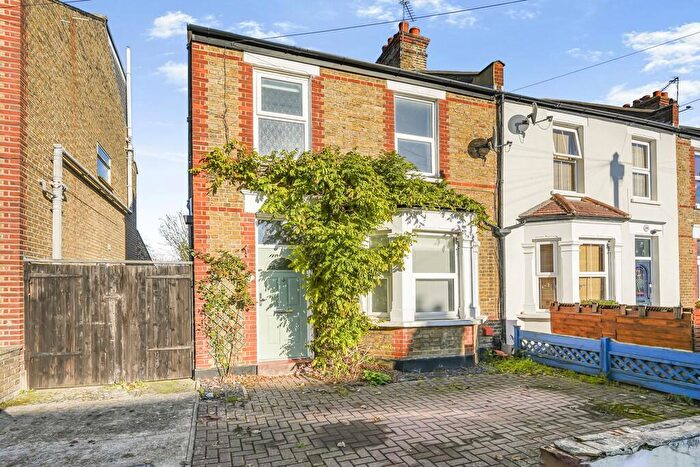
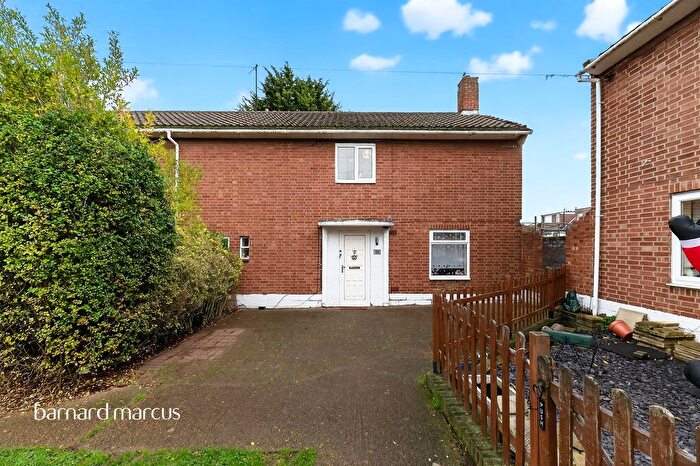
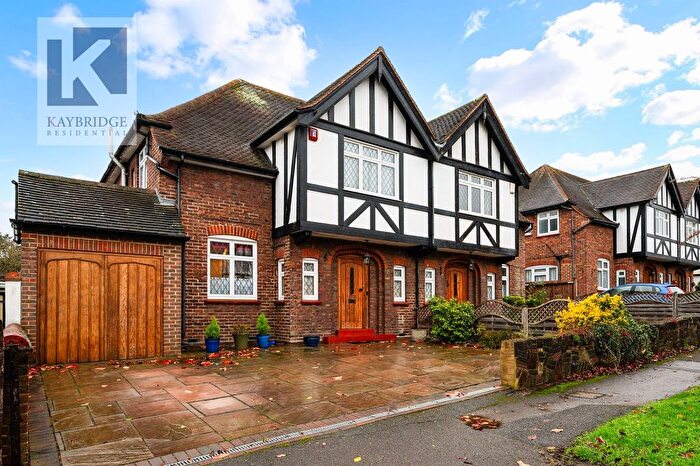
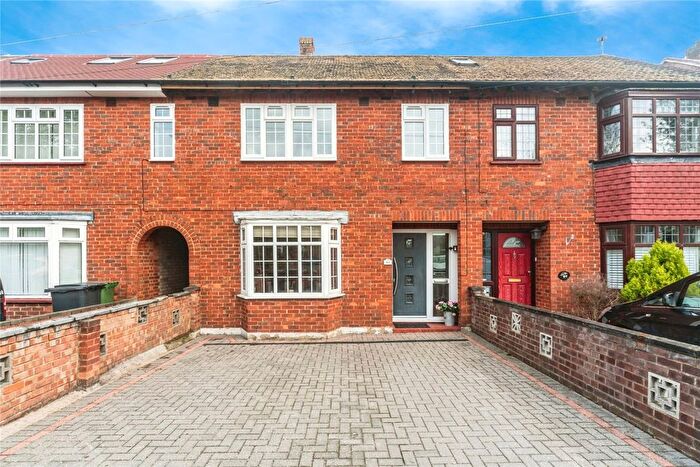
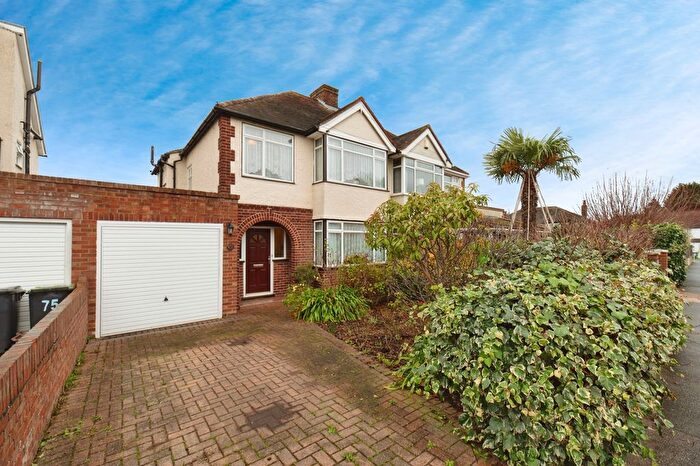
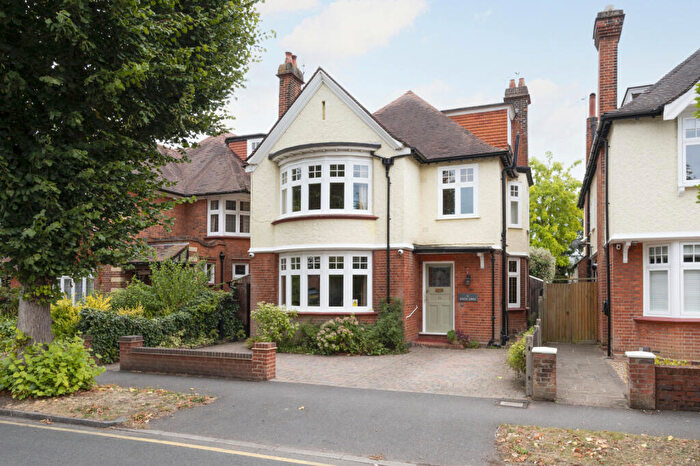
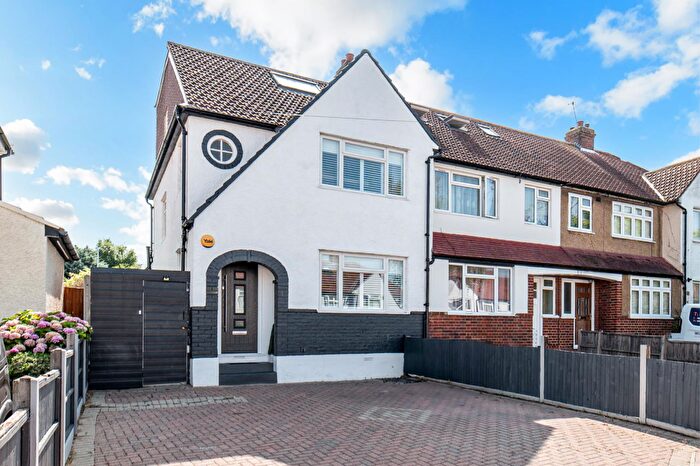
Houses for sale & to rent in Tolworth And Hook Rise, Chessington
House Prices in Tolworth And Hook Rise
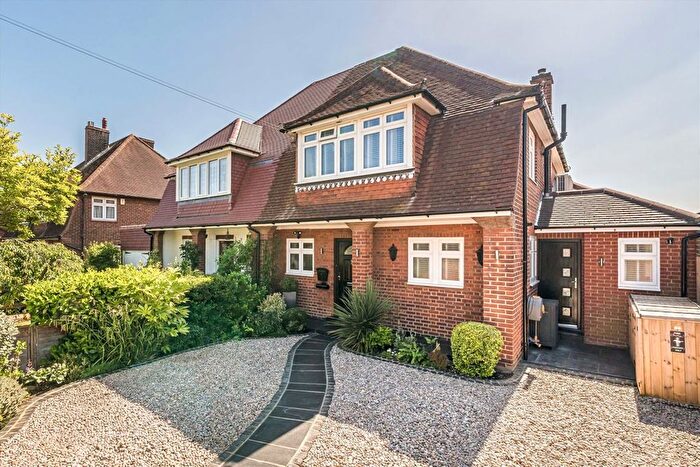
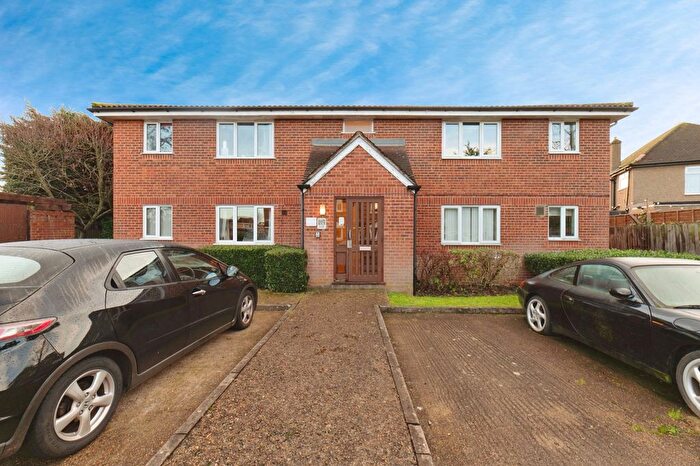
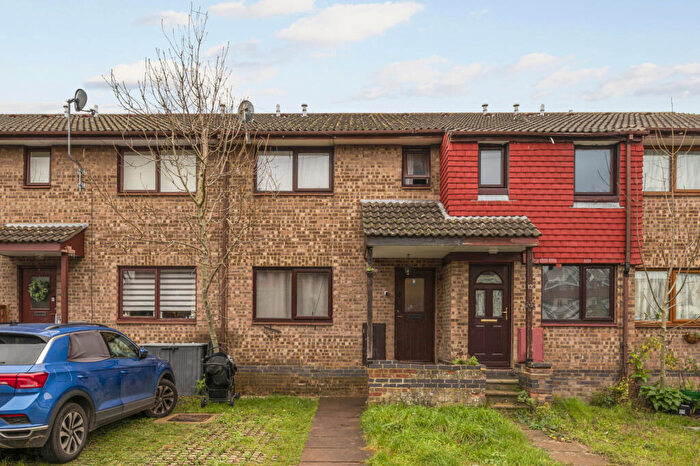
Properties in this part of Tolworth And Hook Rise within Chessington have an average house price of £484,636.00 and had 97 Property Transactions within the last 3 years¹. This area has 871 households² , where the most expensive property was sold for £925,000.00.
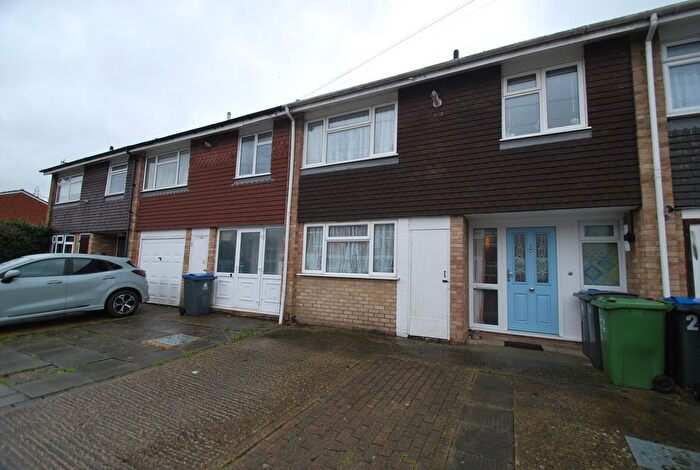
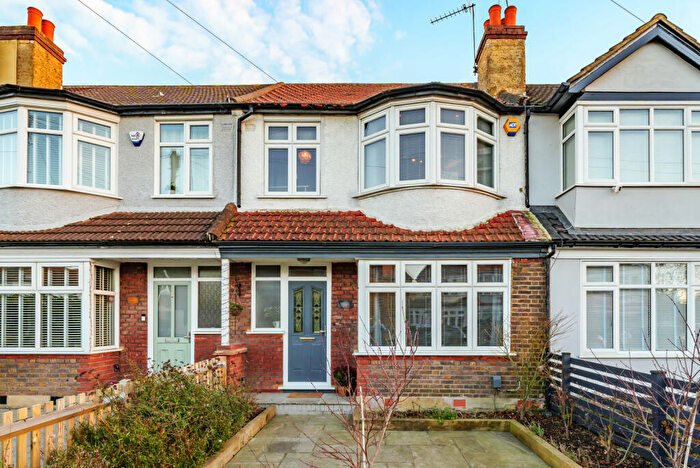
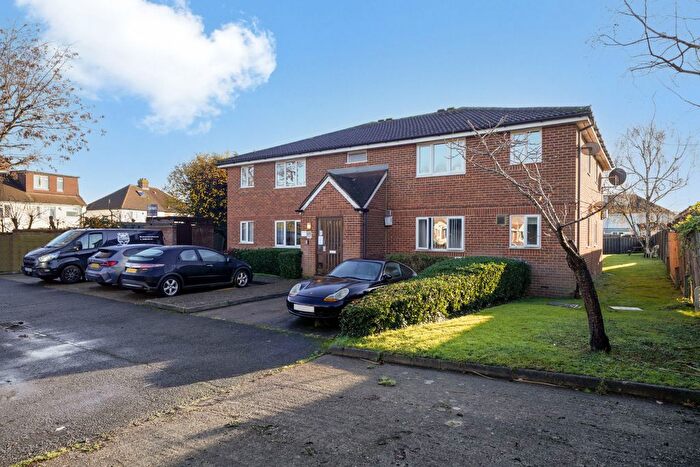
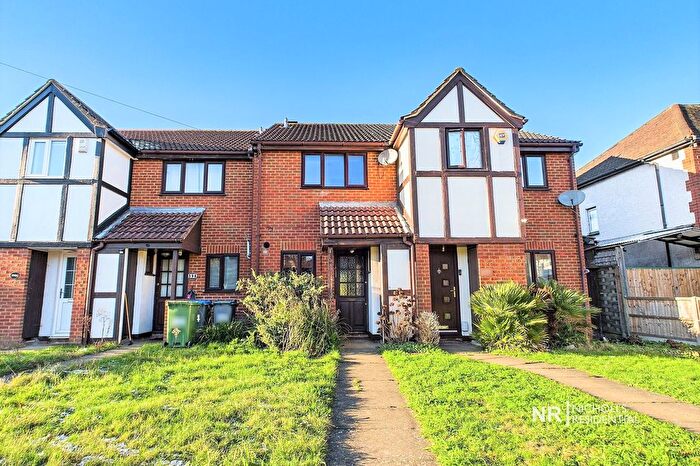
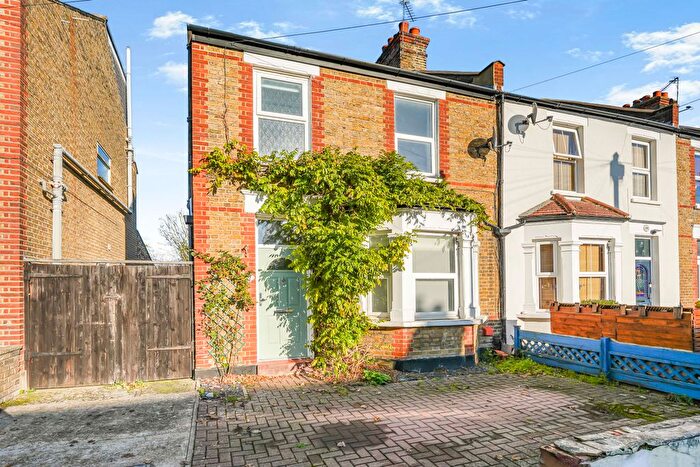
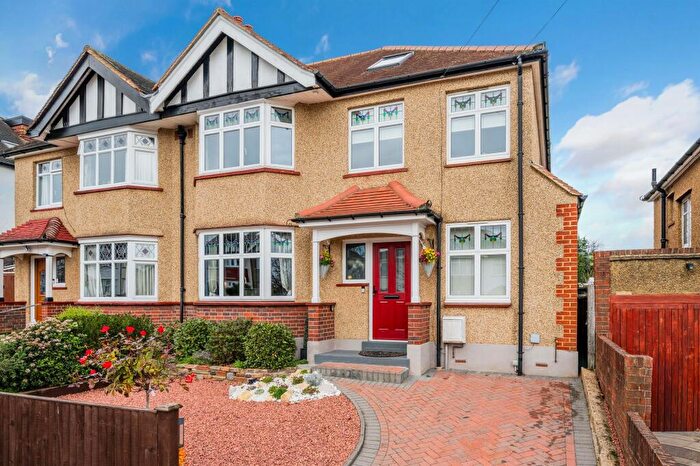
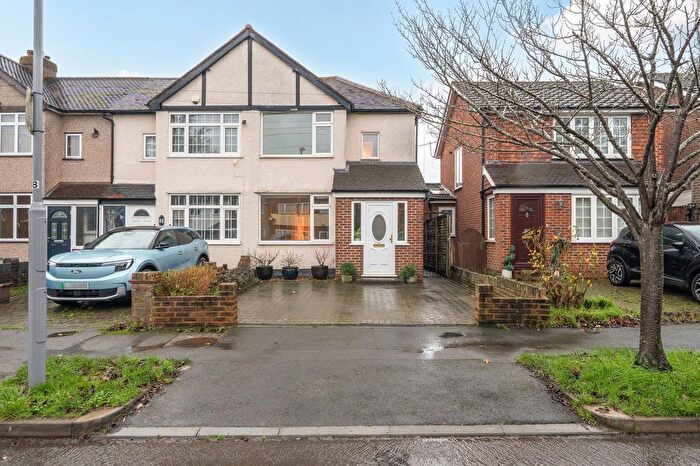
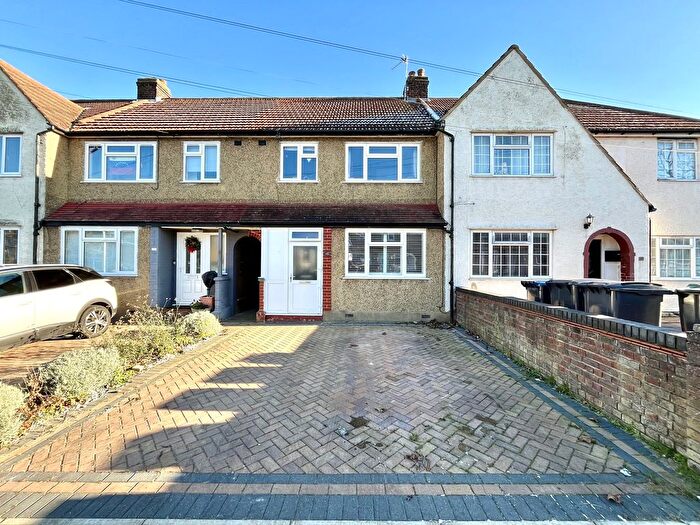
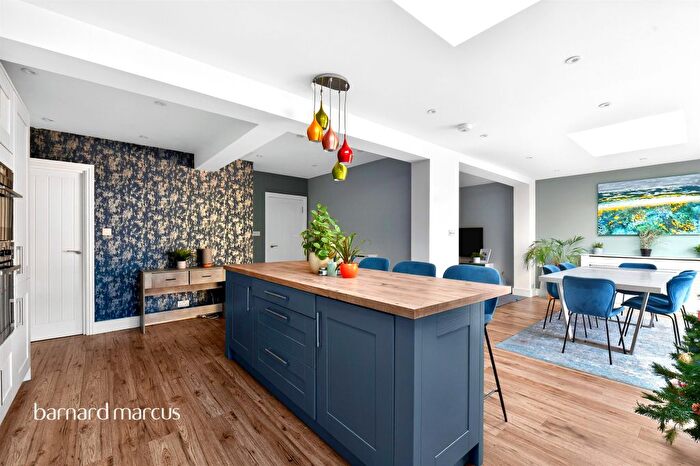
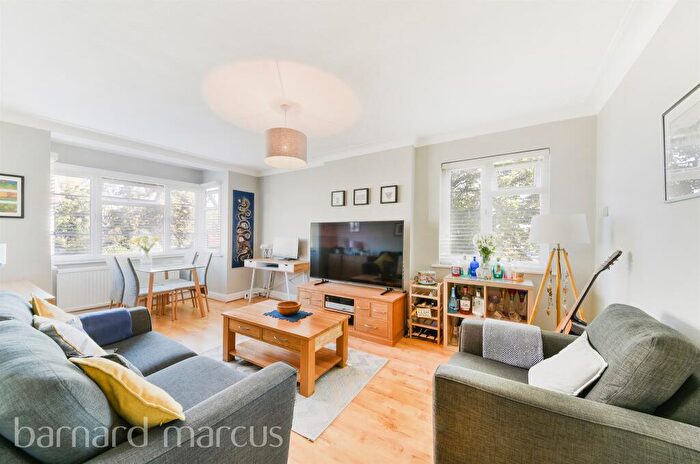
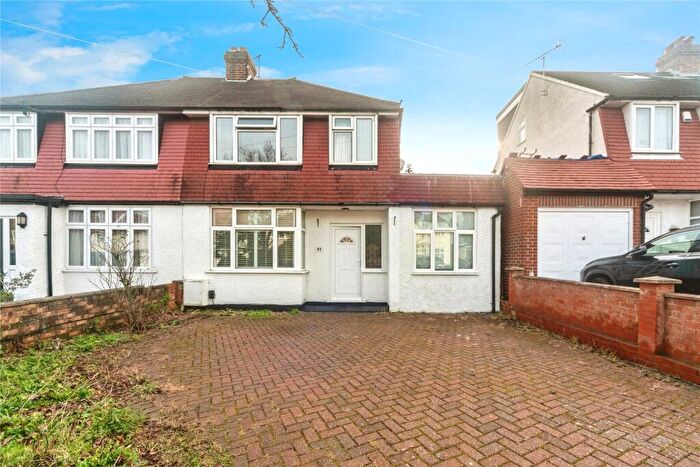
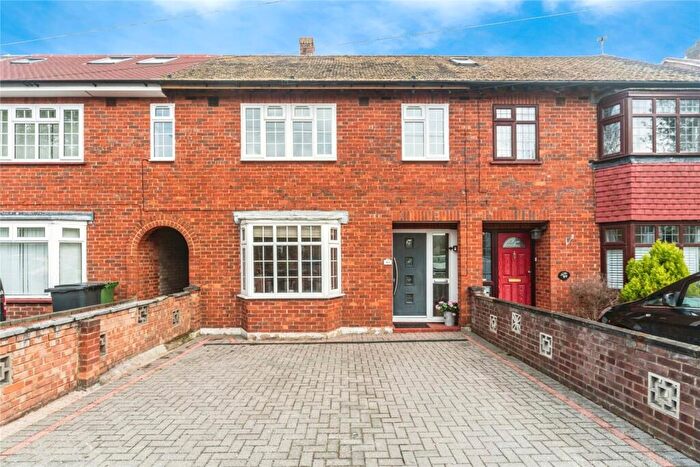
Properties for sale in Tolworth And Hook Rise
Roads and Postcodes in Tolworth And Hook Rise
Navigate through our locations to find the location of your next house in Tolworth And Hook Rise, Chessington for sale or to rent.
| Streets | Postcodes |
|---|---|
| Ace Parade | KT9 1DR KT9 1DS |
| Ashcroft Road | KT9 1RR |
| Beechcroft Road | KT9 1RL |
| Cedarcroft Road | KT9 1RP KT9 1RS |
| Coniston Way | KT9 1EE KT9 1ED |
| Cox Lane | KT9 1DF KT9 1SG KT9 1DN KT9 1SD KT9 1SN |
| Croft End Close | KT9 1RD |
| Cumberland Drive | KT9 1HH KT9 1HQ |
| Davis Road | KT9 1HS KT9 1SE KT9 1TH KT9 1TT KT9 1TY |
| Davis Road Industrial Park | KT9 1TQ |
| Elmcroft Close | KT9 1DX |
| Elmcroft Drive | KT9 1DU KT9 1DY KT9 1DZ KT9 1ET |
| Fircroft Road | KT9 1RN KT9 1RW |
| Fullers Way South | KT9 1HA KT9 1HF |
| Glen Road | KT9 1HD KT9 1HE |
| Hook Road | KT9 1EB KT9 1EA KT9 1HJ |
| Hunters Road | KT9 1RX KT9 1RY |
| Jubilee Way | KT9 1TR |
| Kelvin Grove | KT9 1DP |
| King Edward Drive | KT9 1DW |
| Kingston Business Centre | KT9 1DQ |
| Lynton Close | KT9 1HB |
| Oakcroft Road | KT9 1RH KT9 1BD |
| Oakcroft Villas | KT9 1RJ |
| Priory Road | KT9 1EF KT9 1EG |
| Ranyard Close | KT9 1HR |
| Willcocks Close | KT9 1HG |
Transport near Tolworth And Hook Rise
-
Chessington North Station
-
Tolworth Station
-
Chessington South Station
-
Surbiton Station
-
Malden Manor Station
-
Hinchley Wood Station
-
Berrylands Station
-
Thames Ditton Station
-
Stoneleigh Station
-
Ewell West Station
- FAQ
- Price Paid By Year
- Property Type Price
Frequently asked questions about Tolworth And Hook Rise
What is the average price for a property for sale in Tolworth And Hook Rise?
The average price for a property for sale in Tolworth And Hook Rise is £484,636. This amount is 4% higher than the average price in Chessington. There are 2,451 property listings for sale in Tolworth And Hook Rise.
What streets have the most expensive properties for sale in Tolworth And Hook Rise?
The streets with the most expensive properties for sale in Tolworth And Hook Rise are King Edward Drive at an average of £830,000, Elmcroft Drive at an average of £611,625 and Cumberland Drive at an average of £579,000.
What streets have the most affordable properties for sale in Tolworth And Hook Rise?
The streets with the most affordable properties for sale in Tolworth And Hook Rise are Ranyard Close at an average of £299,990, Coniston Way at an average of £315,625 and Oakcroft Road at an average of £428,333.
Which train stations are available in or near Tolworth And Hook Rise?
Some of the train stations available in or near Tolworth And Hook Rise are Chessington North, Tolworth and Chessington South.
Property Price Paid in Tolworth And Hook Rise by Year
The average sold property price by year was:
| Year | Average Sold Price | Price Change |
Sold Properties
|
|---|---|---|---|
| 2025 | £467,800 | -9% |
10 Properties |
| 2024 | £510,483 | 13% |
30 Properties |
| 2023 | £442,781 | -11% |
22 Properties |
| 2022 | £493,601 | 4% |
35 Properties |
| 2021 | £474,100 | 3% |
44 Properties |
| 2020 | £459,233 | 15% |
15 Properties |
| 2019 | £391,317 | -7% |
32 Properties |
| 2018 | £416,801 | -11% |
35 Properties |
| 2017 | £463,128 | 18% |
30 Properties |
| 2016 | £380,252 | 6% |
35 Properties |
| 2015 | £358,957 | 1% |
28 Properties |
| 2014 | £355,237 | 24% |
37 Properties |
| 2013 | £269,839 | -2% |
34 Properties |
| 2012 | £276,236 | 9% |
25 Properties |
| 2011 | £252,466 | -7% |
15 Properties |
| 2010 | £270,194 | 7% |
35 Properties |
| 2009 | £250,323 | -2% |
17 Properties |
| 2008 | £254,997 | 3% |
20 Properties |
| 2007 | £246,492 | 5% |
53 Properties |
| 2006 | £234,336 | 4% |
50 Properties |
| 2005 | £224,177 | 3% |
40 Properties |
| 2004 | £218,273 | 13% |
58 Properties |
| 2003 | £190,491 | 12% |
51 Properties |
| 2002 | £167,068 | 12% |
53 Properties |
| 2001 | £147,138 | 15% |
57 Properties |
| 2000 | £124,850 | 11% |
41 Properties |
| 1999 | £110,676 | 6% |
58 Properties |
| 1998 | £103,938 | 17% |
46 Properties |
| 1997 | £85,827 | 10% |
47 Properties |
| 1996 | £77,663 | 6% |
51 Properties |
| 1995 | £72,866 | - |
41 Properties |
Property Price per Property Type in Tolworth And Hook Rise
Here you can find historic sold price data in order to help with your property search.
The average Property Paid Price for specific property types in the last three years are:
| Property Type | Average Sold Price | Sold Properties |
|---|---|---|
| Semi Detached House | £529,775.00 | 52 Semi Detached Houses |
| Detached House | £682,142.00 | 7 Detached Houses |
| Terraced House | £470,402.00 | 21 Terraced Houses |
| Flat | £282,823.00 | 17 Flats |

