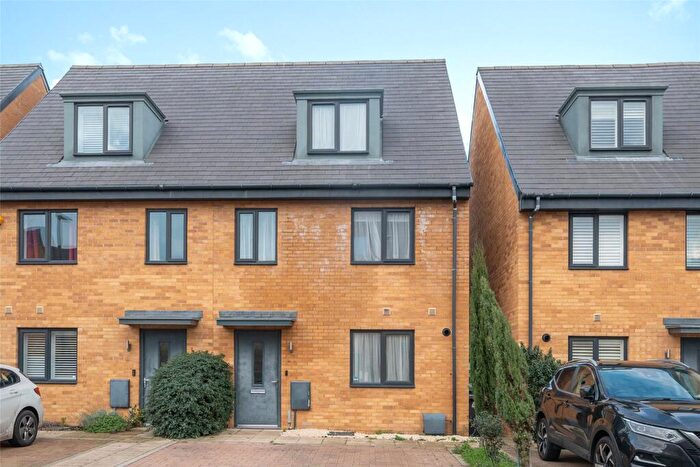
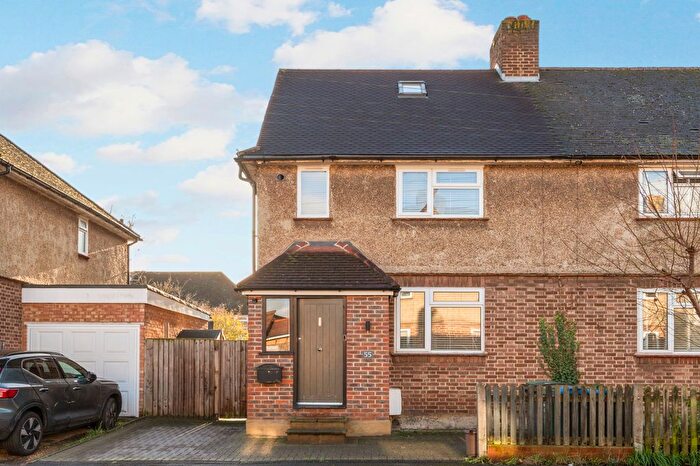
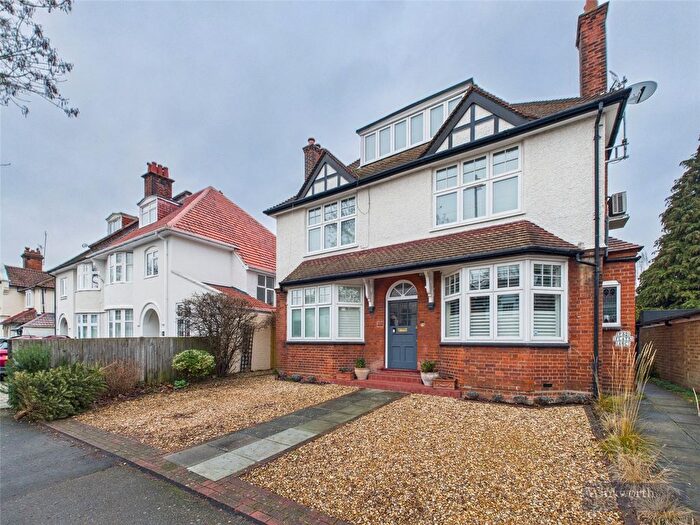
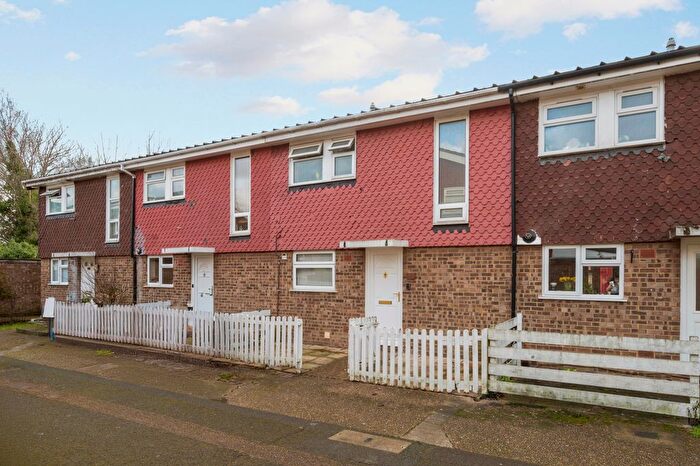
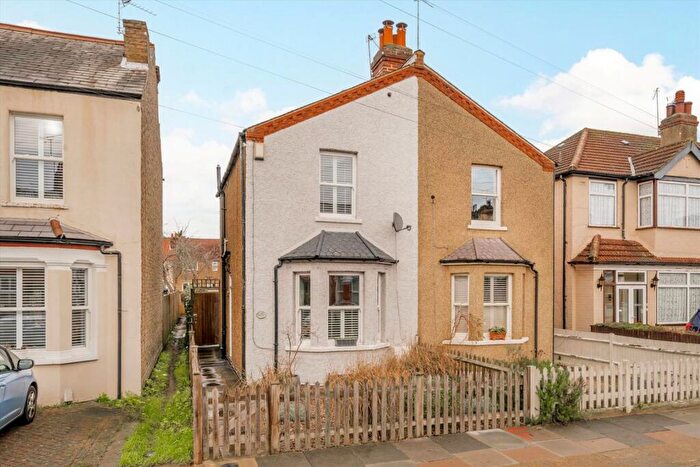
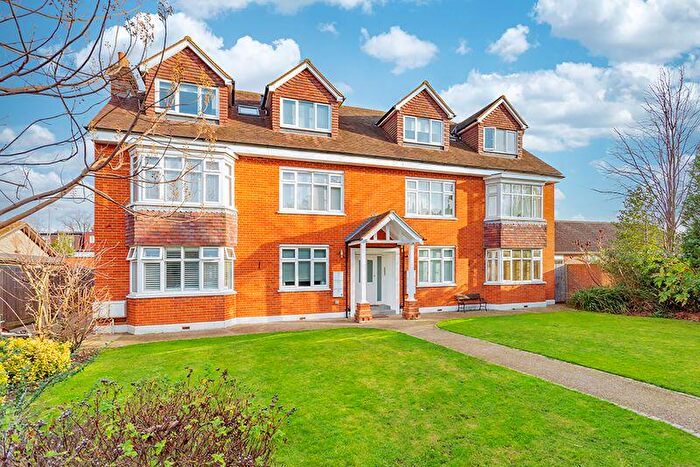
Houses for sale & to rent in Tolworth And Hook Rise, Surbiton
House Prices in Tolworth And Hook Rise
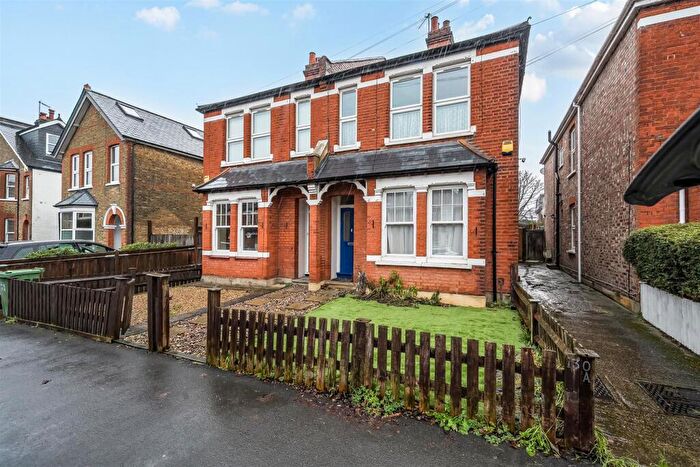
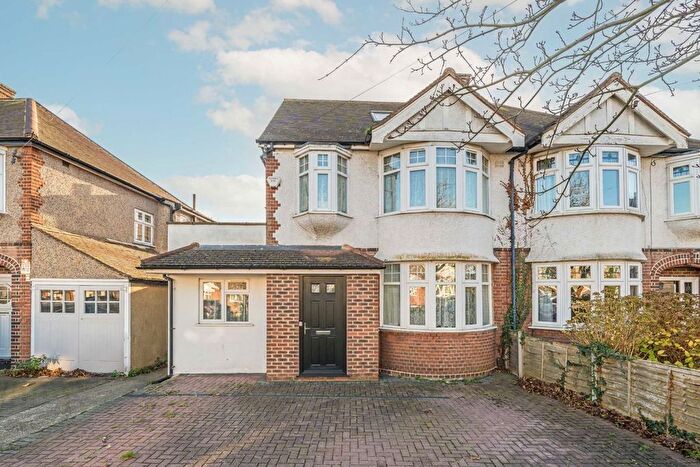
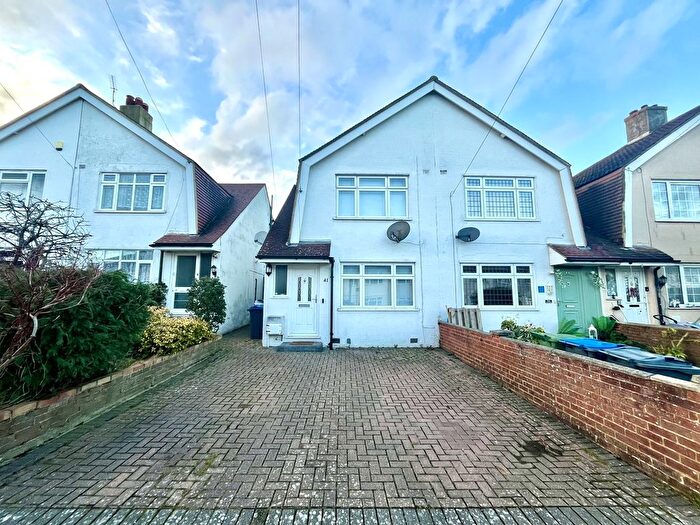
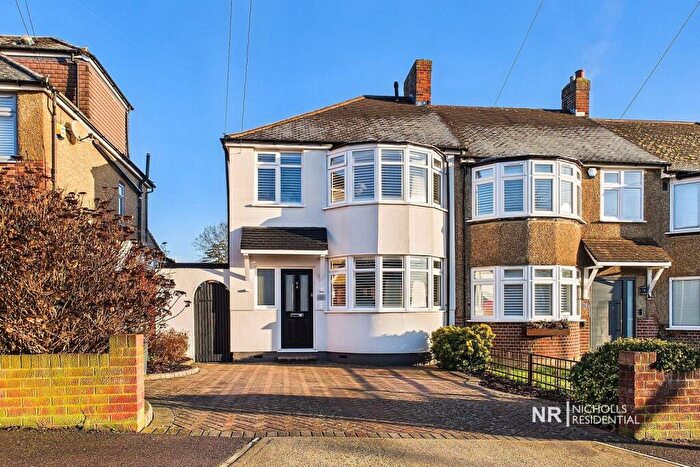
Properties in this part of Tolworth And Hook Rise within Surbiton have an average house price of £518,628.00 and had 230 Property Transactions within the last 3 years¹. This area has 2,858 households² , where the most expensive property was sold for £1,132,000.00.
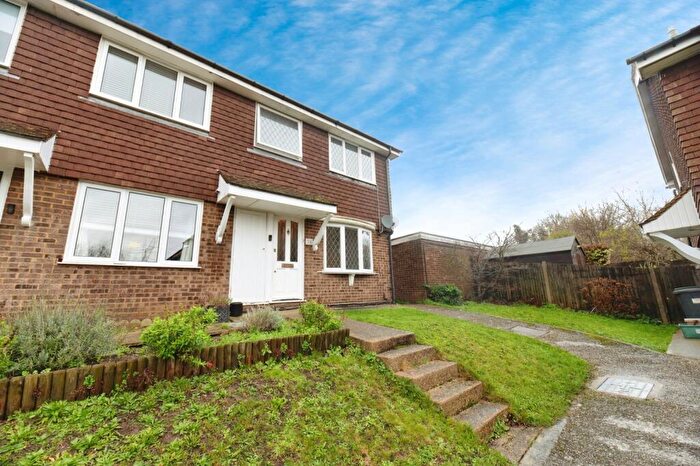
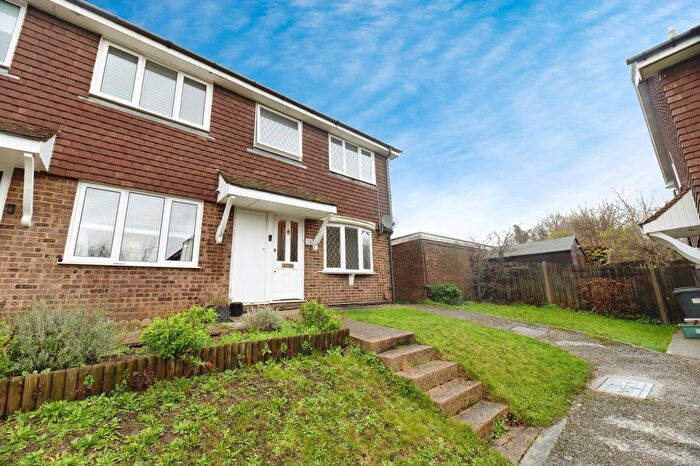
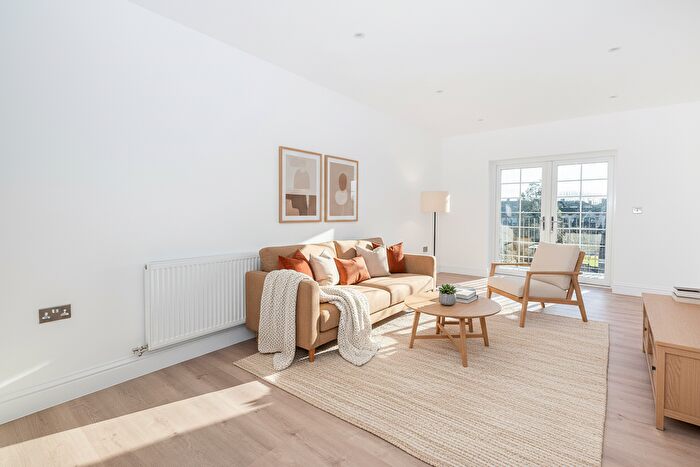
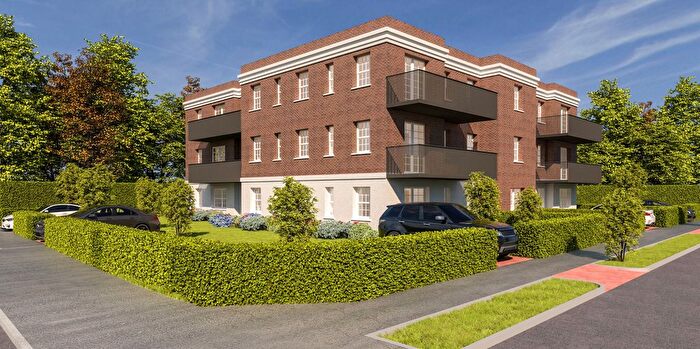
Properties for sale in Tolworth And Hook Rise
Roads and Postcodes in Tolworth And Hook Rise
Navigate through our locations to find the location of your next house in Tolworth And Hook Rise, Surbiton for sale or to rent.
| Streets | Postcodes |
|---|---|
| Agar Close | KT6 7XF |
| Ardingly Way | KT6 5DA |
| Argent Court | KT6 7NL |
| Baden Powell Close | KT6 7SW |
| Bakery Mews | KT6 7BP |
| Broad Oaks | KT6 7EZ |
| Brook Road | KT6 5DB |
| Burwood Close | KT6 7HW |
| Carnegie Close | KT6 7TR |
| Chaffinch Close | KT6 7PG KT6 7PH KT6 7PQ |
| Cranborne Avenue | KT6 7JP KT6 7JR KT6 7JS KT6 7JT |
| Culsac Road | KT6 7ST |
| Diana Gardens | KT6 7SQ |
| Ditton Road | KT6 5BF |
| Draycot Road | KT6 7BL |
| Ewell Road | KT6 7BB KT6 7BF KT6 7HD KT6 7HF KT6 7BA |
| Fullers Avenue | KT6 7TD KT6 7TE |
| Fullers Way North | KT6 7LH KT6 7LQ |
| Gladstone Road | KT6 5DD |
| Grand Parade | KT6 7BE |
| Hamilton Avenue | KT6 7PN KT6 7PS KT6 7PT KT6 7PW KT6 7PZ KT6 7QA |
| Haycroft Road | KT6 5AU |
| Herne Road | KT6 5BU KT6 5BX |
| Hook Rise North | KT6 7JU KT6 7JX KT6 7JY KT6 7JZ KT6 7LN KT6 5AT KT6 5DE |
| Hook Rise South | KT6 7LP KT6 7LS KT6 7LT KT6 7LW KT6 7NA KT6 7LD |
| Hook Road | KT6 5AF KT6 5AH KT6 5AR KT6 5BB KT6 5BZ KT6 5AS KT6 5DF |
| Ivy Road | KT6 7BJ |
| Kent Way | KT6 7SU KT6 7SY KT6 7SP KT6 7SX |
| Kingsmead Avenue | KT6 7PP |
| Kingston Road | KT5 9NY KT5 9NU KT5 9NX KT5 9PB |
| Ladywood Road | KT6 7PB KT6 7PD |
| Largewood Avenue | KT6 7NU KT6 7NX KT6 7NY KT6 7PA |
| Lenelby Road | KT6 7BG KT6 7BH |
| Love Lane | KT6 5BY |
| Mayroyd Avenue | KT6 7PR |
| Oakleigh Avenue | KT6 7PU KT6 7PX KT6 7PY |
| Princes Avenue | KT6 7JJ KT6 7JL KT6 7JN KT6 7JW |
| Pyne Road | KT6 7BN KT6 7BW |
| Queen Mary Close | KT6 7ND |
| Ravenswood Avenue | KT6 7NN KT6 7NP KT6 7NW |
| Red Lion Business Park | KT6 7QD KT6 7RD |
| Red Lion Road | KT6 7QN KT6 7QQ KT6 7QT KT6 7QX KT6 7QY KT6 7QZ KT6 7RA KT6 7RF KT6 7QU |
| Ronelean Road | KT6 7LJ KT6 7LL |
| Rosemead Close | KT6 7AY |
| Selbourne Avenue | KT6 7NR KT6 7NS KT6 7NT |
| St Georges Gardens | KT6 7PF |
| Sunningdale Close | KT6 7UU |
| Swallow Park Close | KT6 7JF |
| Tala Close | KT6 7DU KT6 7EY |
| Thornhill Avenue | KT6 7SS |
| Thornhill Road | KT6 7TF KT6 7TH KT6 7TL KT6 7TQ |
| Toby Way | KT5 9PA |
| Tolworth Broadway | KT6 7HR KT6 7JB KT6 7JD KT6 7GD KT6 7HL KT6 7HT |
| Tolworth Road | KT6 7SR KT6 7SZ KT6 7TA |
| Vale Road North | KT6 5AG |
| Vale Road South | KT6 5AQ |
| Verona Drive | KT6 5AJ KT6 5AL KT6 5BD KT6 5BE |
| Waterside Close | KT6 7SF KT6 7TT |
Transport near Tolworth And Hook Rise
-
Tolworth Station
-
Chessington North Station
-
Surbiton Station
-
Malden Manor Station
-
Berrylands Station
-
Chessington South Station
-
Worcester Park Station
-
Hinchley Wood Station
-
Thames Ditton Station
-
Stoneleigh Station
- FAQ
- Price Paid By Year
- Property Type Price
Frequently asked questions about Tolworth And Hook Rise
What is the average price for a property for sale in Tolworth And Hook Rise?
The average price for a property for sale in Tolworth And Hook Rise is £518,628. This amount is 8% lower than the average price in Surbiton. There are 3,080 property listings for sale in Tolworth And Hook Rise.
What streets have the most expensive properties for sale in Tolworth And Hook Rise?
The streets with the most expensive properties for sale in Tolworth And Hook Rise are Herne Road at an average of £759,000, Thornhill Road at an average of £708,695 and Vale Road North at an average of £688,000.
What streets have the most affordable properties for sale in Tolworth And Hook Rise?
The streets with the most affordable properties for sale in Tolworth And Hook Rise are Toby Way at an average of £239,633, Kingston Road at an average of £266,000 and Diana Gardens at an average of £282,750.
Which train stations are available in or near Tolworth And Hook Rise?
Some of the train stations available in or near Tolworth And Hook Rise are Tolworth, Chessington North and Surbiton.
Property Price Paid in Tolworth And Hook Rise by Year
The average sold property price by year was:
| Year | Average Sold Price | Price Change |
Sold Properties
|
|---|---|---|---|
| 2025 | £555,330 | 10% |
61 Properties |
| 2024 | £497,832 | -3% |
82 Properties |
| 2023 | £512,494 | -3% |
87 Properties |
| 2022 | £525,720 | 10% |
112 Properties |
| 2021 | £472,796 | 1% |
142 Properties |
| 2020 | £468,194 | 3% |
88 Properties |
| 2019 | £454,848 | -5% |
144 Properties |
| 2018 | £476,563 | 8% |
159 Properties |
| 2017 | £439,902 | 4% |
88 Properties |
| 2016 | £421,870 | 10% |
124 Properties |
| 2015 | £379,820 | 8% |
108 Properties |
| 2014 | £350,035 | 5% |
119 Properties |
| 2013 | £332,164 | 15% |
154 Properties |
| 2012 | £281,638 | 1% |
109 Properties |
| 2011 | £278,515 | 6% |
88 Properties |
| 2010 | £262,715 | 11% |
101 Properties |
| 2009 | £232,664 | -14% |
67 Properties |
| 2008 | £265,199 | -1% |
68 Properties |
| 2007 | £267,715 | 13% |
169 Properties |
| 2006 | £233,159 | 4% |
188 Properties |
| 2005 | £222,984 | 3% |
113 Properties |
| 2004 | £216,281 | 8% |
160 Properties |
| 2003 | £198,465 | 12% |
123 Properties |
| 2002 | £174,086 | 13% |
181 Properties |
| 2001 | £151,409 | 8% |
164 Properties |
| 2000 | £139,945 | 19% |
124 Properties |
| 1999 | £113,910 | 14% |
160 Properties |
| 1998 | £98,279 | 12% |
128 Properties |
| 1997 | £86,577 | 10% |
172 Properties |
| 1996 | £77,551 | 5% |
133 Properties |
| 1995 | £73,865 | - |
99 Properties |
Property Price per Property Type in Tolworth And Hook Rise
Here you can find historic sold price data in order to help with your property search.
The average Property Paid Price for specific property types in the last three years are:
| Property Type | Average Sold Price | Sold Properties |
|---|---|---|
| Semi Detached House | £606,204.00 | 84 Semi Detached Houses |
| Detached House | £637,400.00 | 10 Detached Houses |
| Terraced House | £527,909.00 | 91 Terraced Houses |
| Flat | £309,990.00 | 45 Flats |

