
Houses for sale & to rent in Norbiton, Kingston Upon Thames
House Prices in Norbiton
Properties in this part of Norbiton within Kingston Upon Thames have an average house price of £538,533.00 and had 290 Property Transactions within the last 3 years¹. This area has 3,794 households² , where the most expensive property was sold for £1,555,000.00.
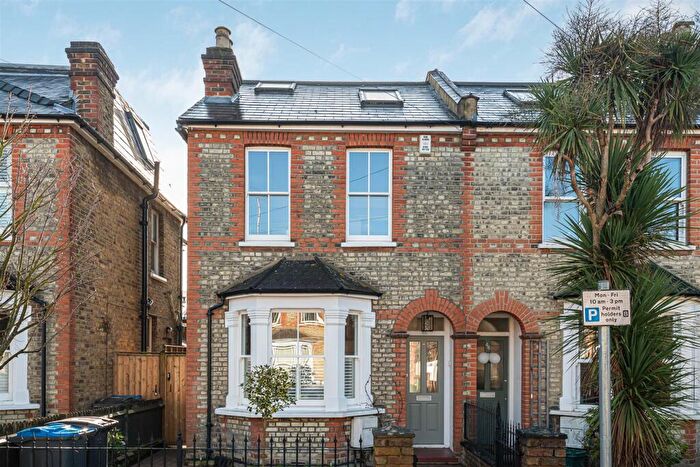
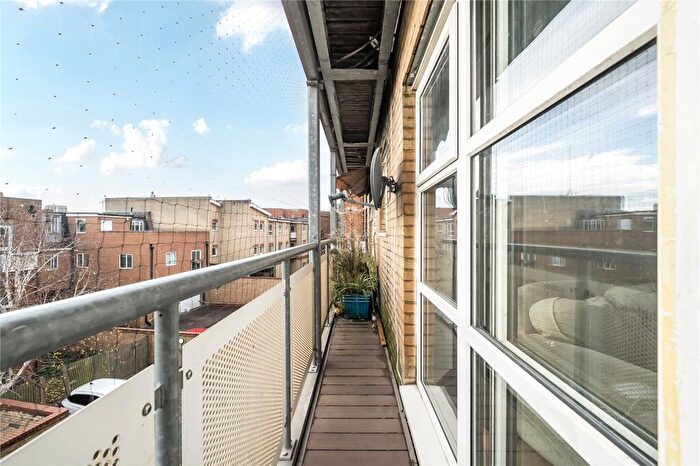
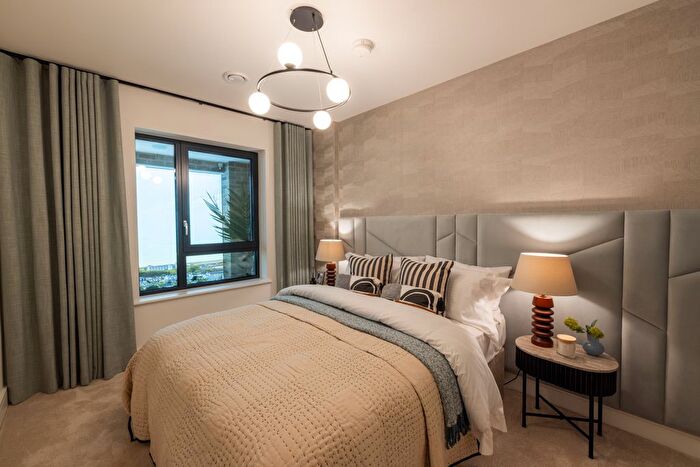
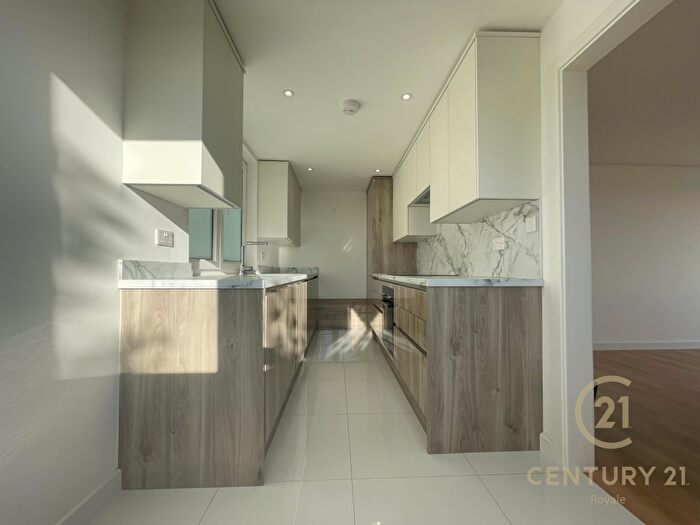
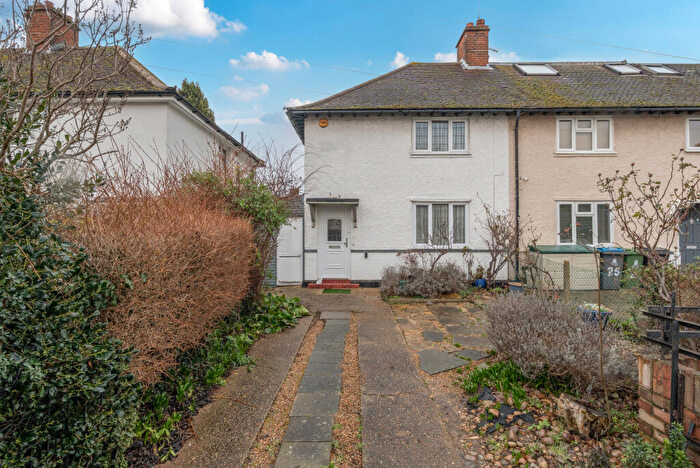
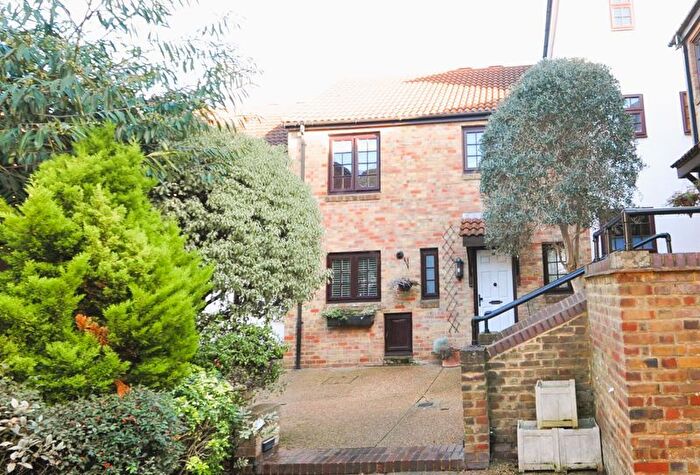
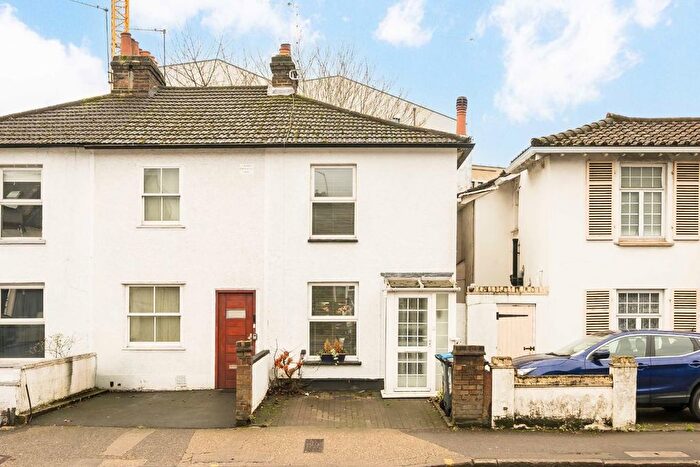
Properties for sale in Norbiton

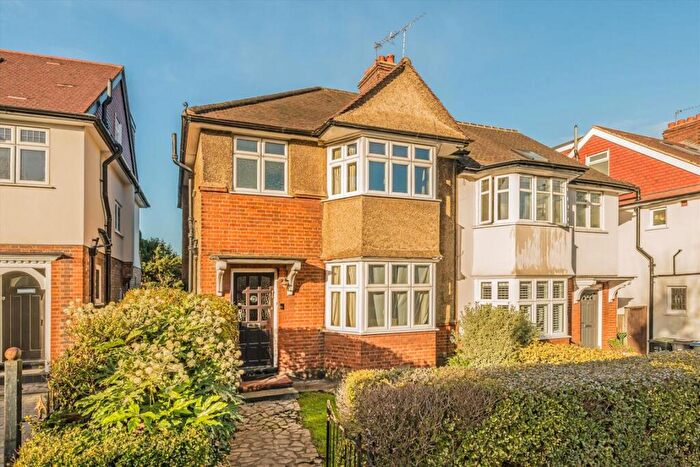
![]()
If you are looking to sell your house, let it out, or receive a property valuation, an expert can help you.
Click the button below to get started.


Roads and Postcodes in Norbiton
Navigate through our locations to find the location of your next house in Norbiton, Kingston Upon Thames for sale or to rent.
Transport near Norbiton
-
 Norbiton Station
 -
Kingston Station
-
Berrylands Station
-
Hampton Wick Station
-
Surbiton Station
-
New Malden Station
-
Malden Manor Station
-
Tolworth Station
-
Teddington Station
-
Motspur Park Station
- FAQ
- Price Paid By Year
- Property Type Price
Frequently asked questions about Norbiton
What is the average price for a property for sale in Norbiton?
The average price for a property for sale in Norbiton is £538,533. This amount is 28% lower than the average price in Kingston Upon Thames. There are 3,851 property listings for sale in Norbiton.
What streets have the most expensive properties for sale in Norbiton?
The streets with the most expensive properties for sale in Norbiton are Gloucester Road at an average of £1,024,875, Minerva Road at an average of £983,000 and Clevedon Road at an average of £971,250.
What streets have the most affordable properties for sale in Norbiton?
The streets with the most affordable properties for sale in Norbiton are Queen Elizabeth Road at an average of £204,994, Boundary Close at an average of £210,000 and Tithe Barn Close at an average of £272,475.
Which train stations are available in or near Norbiton?
Some of the train stations available in or near Norbiton are Norbiton, Kingston and Berrylands.
Property Price Paid in Norbiton by Year
The average sold property price by year was:
| Year | Average Sold Price | Price Change |
Sold Properties
|
|---|---|---|---|
| 2025 | £541,497 | 2% |
75 Properties |
| 2024 | £533,056 | -2% |
107 Properties |
| 2023 | £541,902 | -1% |
108 Properties |
| 2022 | £547,004 | 4% |
100 Properties |
| 2021 | £524,731 | -2% |
151 Properties |
| 2020 | £534,983 | 11% |
96 Properties |
| 2019 | £477,058 | -2% |
117 Properties |
| 2018 | £484,264 | 3% |
108 Properties |
| 2017 | £470,680 | 4% |
107 Properties |
| 2016 | £451,183 | 7% |
134 Properties |
| 2015 | £420,289 | 8% |
135 Properties |
| 2014 | £387,076 | 12% |
169 Properties |
| 2013 | £341,744 | 8% |
132 Properties |
| 2012 | £315,166 | -1% |
110 Properties |
| 2011 | £319,378 | 1% |
120 Properties |
| 2010 | £316,149 | 14% |
115 Properties |
| 2009 | £271,460 | -5% |
85 Properties |
| 2008 | £285,393 | -3% |
81 Properties |
| 2007 | £294,784 | 15% |
251 Properties |
| 2006 | £251,926 | 4% |
263 Properties |
| 2005 | £242,559 | 10% |
206 Properties |
| 2004 | £217,366 | 2% |
164 Properties |
| 2003 | £213,112 | 13% |
178 Properties |
| 2002 | £185,887 | 13% |
200 Properties |
| 2001 | £162,484 | -6% |
215 Properties |
| 2000 | £172,829 | 30% |
163 Properties |
| 1999 | £121,073 | 11% |
222 Properties |
| 1998 | £108,041 | 14% |
175 Properties |
| 1997 | £92,551 | 14% |
216 Properties |
| 1996 | £79,380 | 0,1% |
129 Properties |
| 1995 | £79,302 | - |
157 Properties |
Property Price per Property Type in Norbiton
Here you can find historic sold price data in order to help with your property search.
The average Property Paid Price for specific property types in the last three years are:
| Property Type | Average Sold Price | Sold Properties |
|---|---|---|
| Flat | £353,510.00 | 133 Flats |
| Semi Detached House | £706,228.00 | 102 Semi Detached Houses |
| Detached House | £1,036,733.00 | 15 Detached Houses |
| Terraced House | £539,291.00 | 40 Terraced Houses |