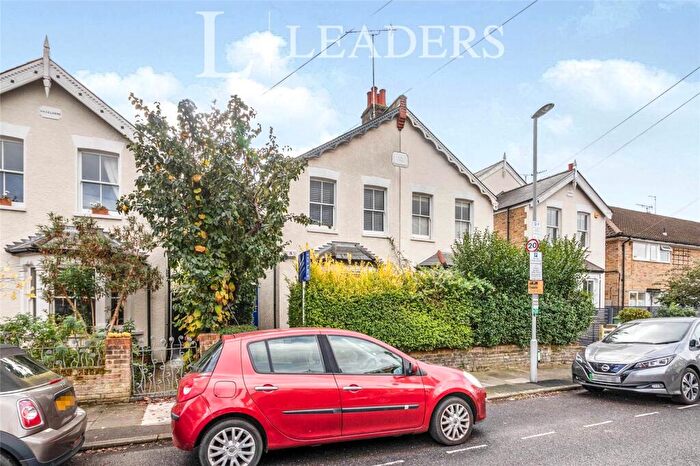
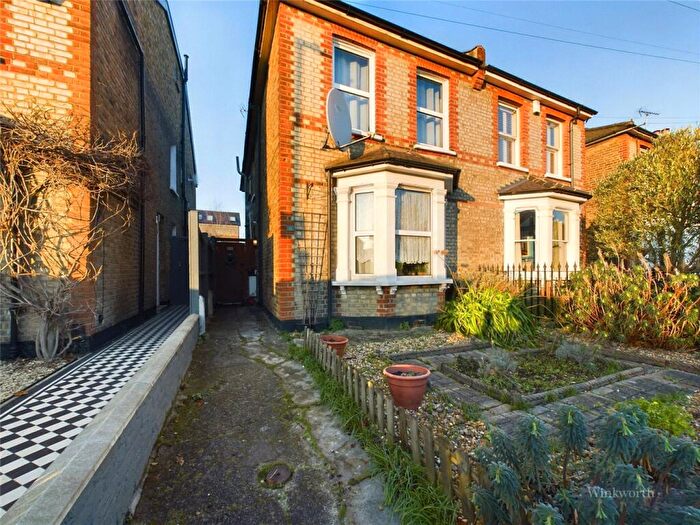
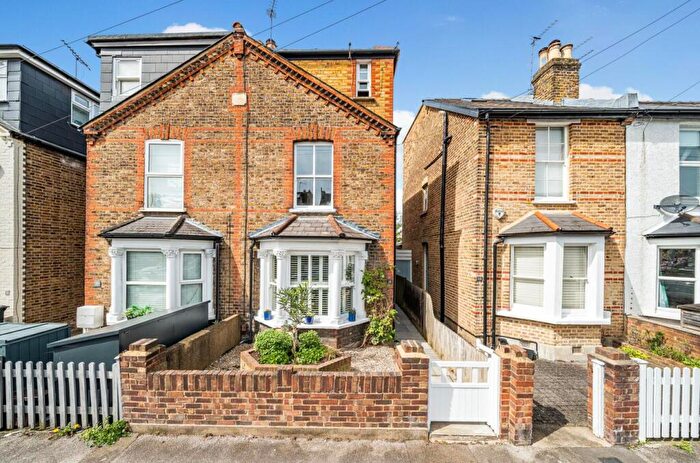
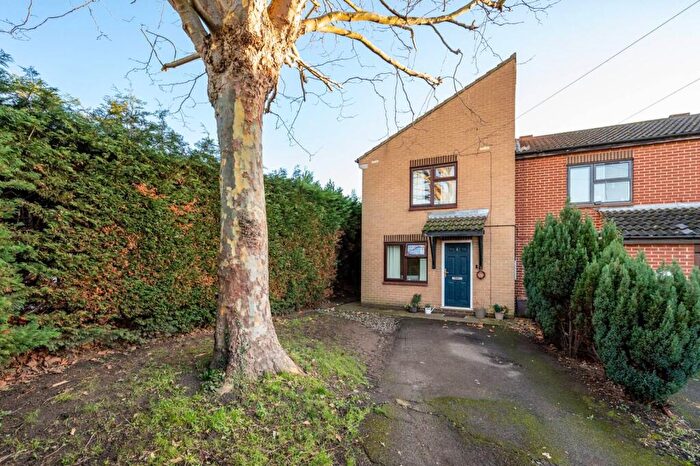
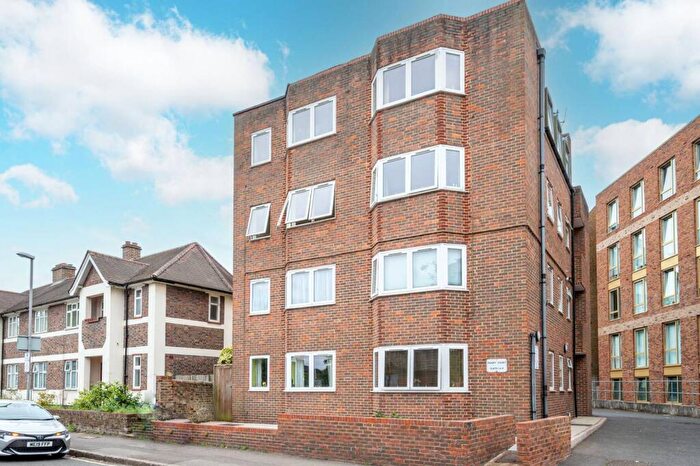
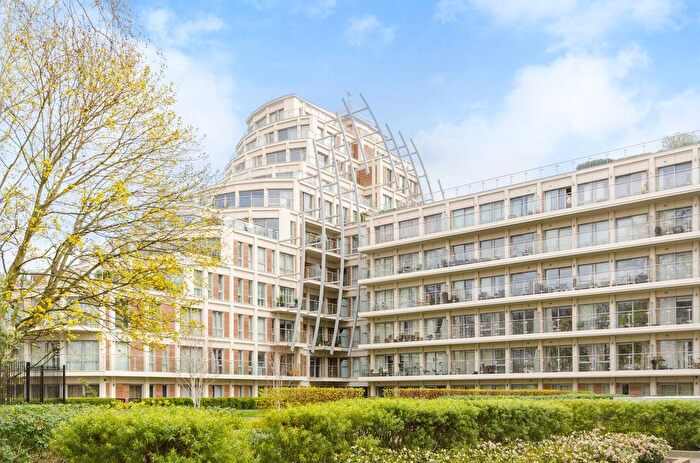
Houses for sale & to rent in Canbury, Kingston Upon Thames
House Prices in Canbury
Properties in this part of Canbury within Kingston Upon Thames have an average house price of £707,258.00 and had 688 Property Transactions within the last 3 years¹. This area has 5,064 households² , where the most expensive property was sold for £3,150,000.00.
Properties for sale in Canbury
Roads and Postcodes in Canbury
Navigate through our locations to find the location of your next house in Canbury, Kingston Upon Thames for sale or to rent.
Transport near Canbury
-
Kingston Station
-
Norbiton Station
-
Hampton Wick Station
-
Berrylands Station
-
Surbiton Station
-
Teddington Station
-
New Malden Station
-
Hampton Court Station
-
Strawberry Hill Station
-
Malden Manor Station
- FAQ
- Price Paid By Year
- Property Type Price
Frequently asked questions about Canbury
What is the average price for a property for sale in Canbury?
The average price for a property for sale in Canbury is £707,258. This amount is 7% lower than the average price in Kingston Upon Thames. There are 4,019 property listings for sale in Canbury.
What streets have the most expensive properties for sale in Canbury?
The streets with the most expensive properties for sale in Canbury are Wolverton Avenue at an average of £1,530,000, Burton Road at an average of £1,411,666 and Park Farm Road at an average of £1,300,333.
What streets have the most affordable properties for sale in Canbury?
The streets with the most affordable properties for sale in Canbury are Park Close at an average of £321,583, Glenville Road at an average of £325,000 and Cowleaze Road at an average of £353,115.
Which train stations are available in or near Canbury?
Some of the train stations available in or near Canbury are Kingston, Norbiton and Hampton Wick.
Property Price Paid in Canbury by Year
The average sold property price by year was:
| Year | Average Sold Price | Price Change |
Sold Properties
|
|---|---|---|---|
| 2025 | £663,950 | 2% |
113 Properties |
| 2024 | £649,068 | -15% |
195 Properties |
| 2023 | £748,998 | -0,2% |
155 Properties |
| 2022 | £750,685 | 8% |
225 Properties |
| 2021 | £690,464 | 9% |
264 Properties |
| 2020 | £627,301 | 6% |
158 Properties |
| 2019 | £587,365 | 4% |
345 Properties |
| 2018 | £564,932 | -6% |
344 Properties |
| 2017 | £599,075 | -1% |
185 Properties |
| 2016 | £605,185 | -0,3% |
214 Properties |
| 2015 | £606,733 | 14% |
259 Properties |
| 2014 | £519,344 | 12% |
422 Properties |
| 2013 | £455,248 | 4% |
306 Properties |
| 2012 | £435,493 | 9% |
187 Properties |
| 2011 | £398,095 | -5% |
260 Properties |
| 2010 | £416,012 | 17% |
226 Properties |
| 2009 | £343,571 | -5% |
187 Properties |
| 2008 | £360,408 | 1% |
171 Properties |
| 2007 | £358,123 | 11% |
391 Properties |
| 2006 | £317,374 | 9% |
410 Properties |
| 2005 | £288,123 | 1% |
335 Properties |
| 2004 | £286,543 | 8% |
487 Properties |
| 2003 | £262,937 | 6% |
336 Properties |
| 2002 | £247,224 | 11% |
372 Properties |
| 2001 | £221,222 | 12% |
320 Properties |
| 2000 | £193,597 | 16% |
279 Properties |
| 1999 | £162,140 | 5% |
373 Properties |
| 1998 | £154,727 | 18% |
374 Properties |
| 1997 | £126,339 | 15% |
424 Properties |
| 1996 | £106,829 | 9% |
311 Properties |
| 1995 | £96,735 | - |
219 Properties |
Property Price per Property Type in Canbury
Here you can find historic sold price data in order to help with your property search.
The average Property Paid Price for specific property types in the last three years are:
| Property Type | Average Sold Price | Sold Properties |
|---|---|---|
| Flat | £466,612.00 | 335 Flats |
| Semi Detached House | £948,809.00 | 151 Semi Detached Houses |
| Detached House | £1,191,659.00 | 77 Detached Houses |
| Terraced House | £762,002.00 | 125 Terraced Houses |

