Houses for sale & to rent in Tudor, Kingston Upon Thames
House Prices in Tudor
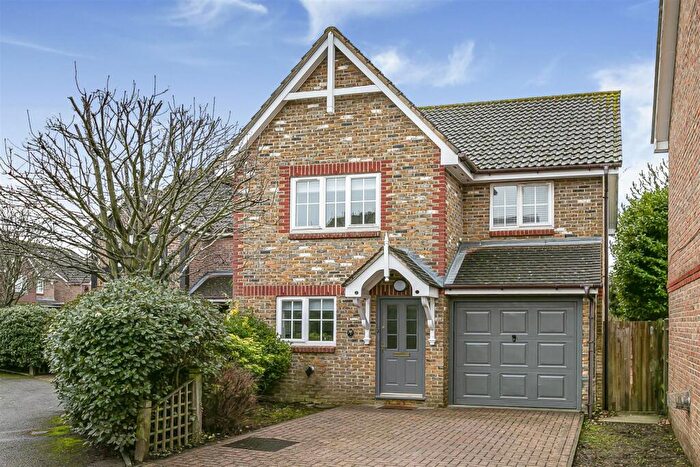
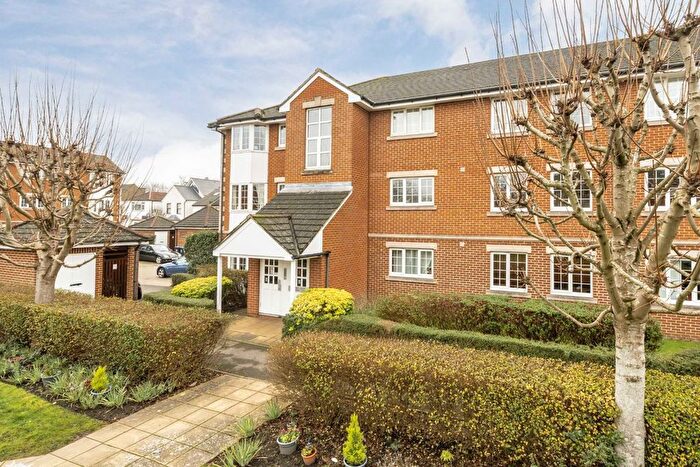
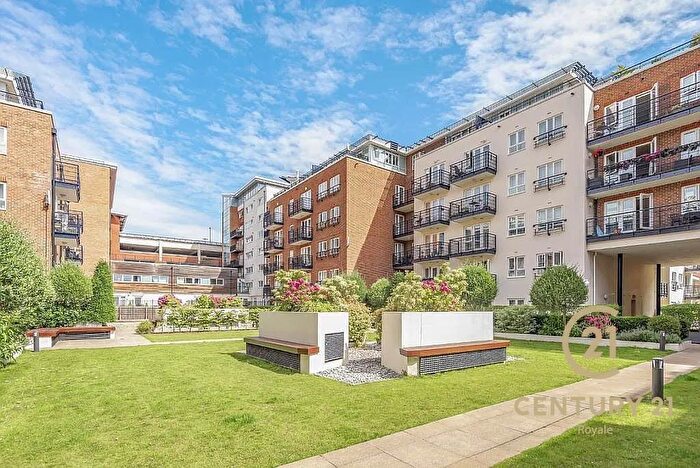
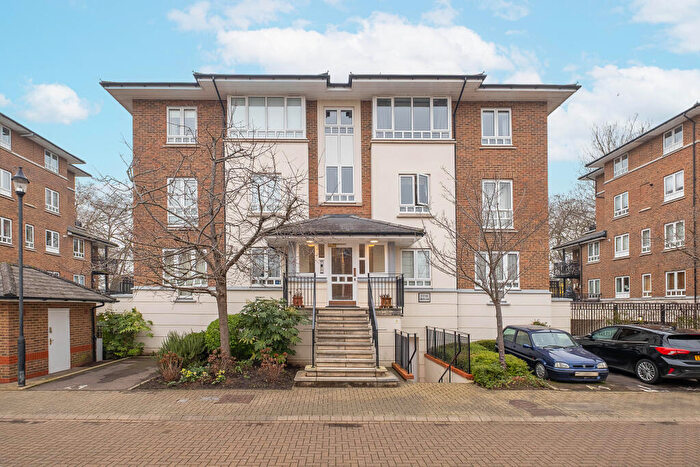
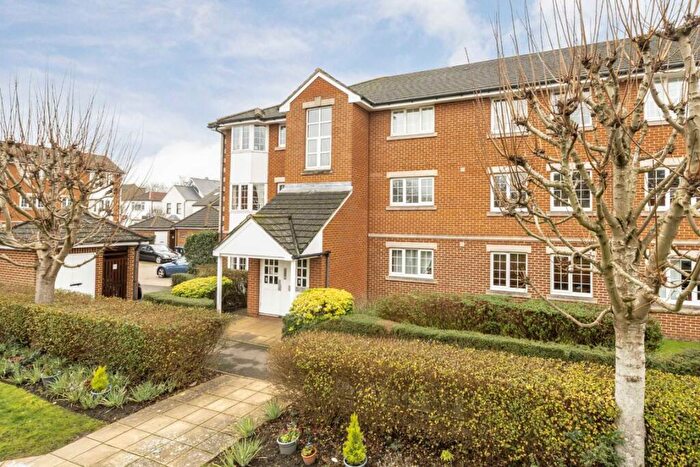
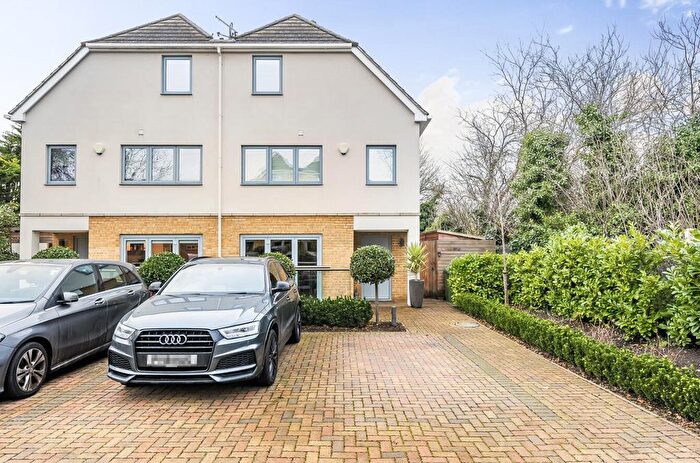
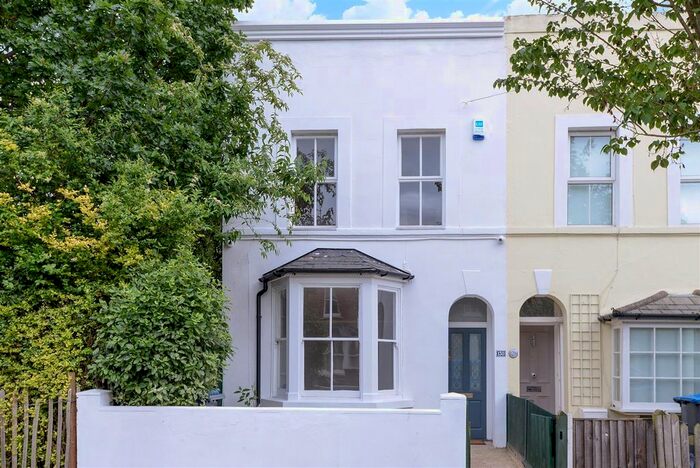
Properties in this part of Tudor within Kingston Upon Thames have an average house price of £887,748.00 and had 257 Property Transactions within the last 3 years¹. This area has 3,666 households² , where the most expensive property was sold for £3,450,000.00.
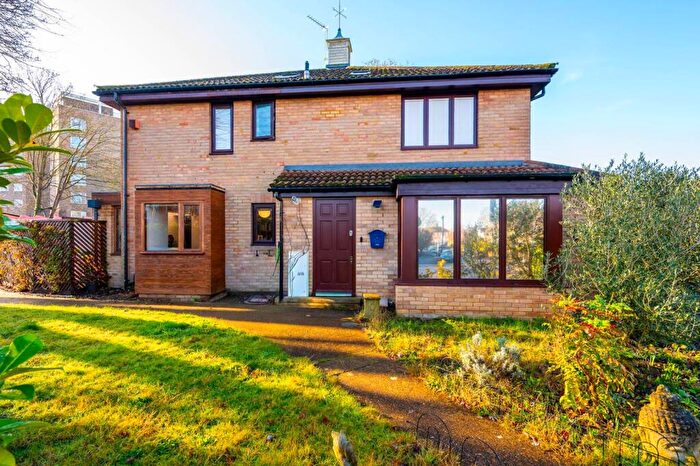
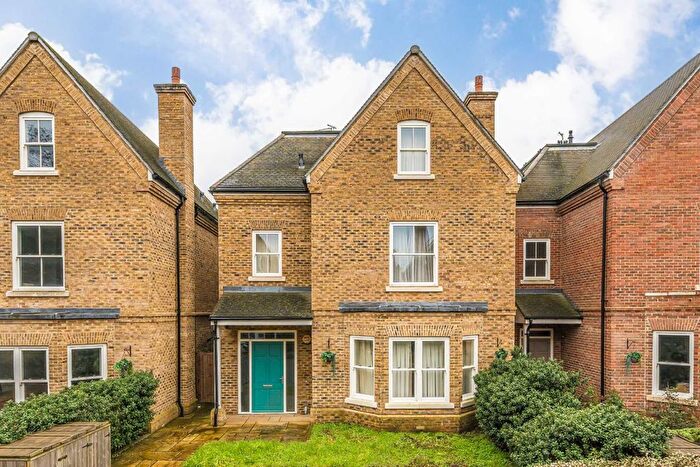
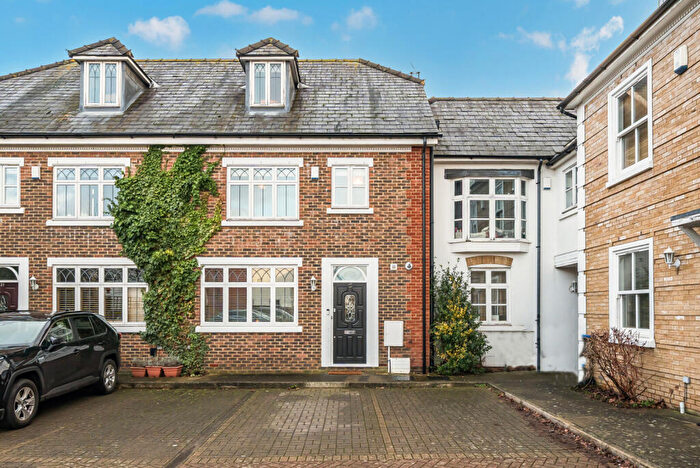
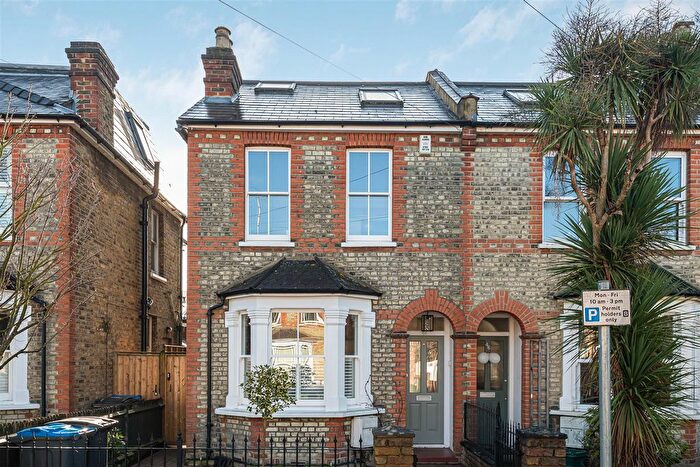
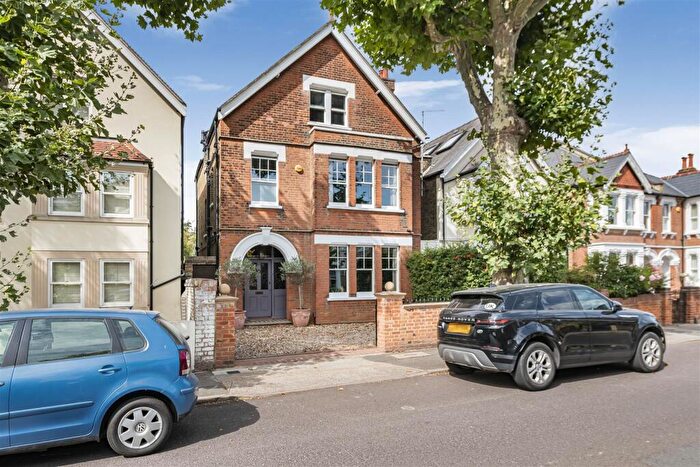
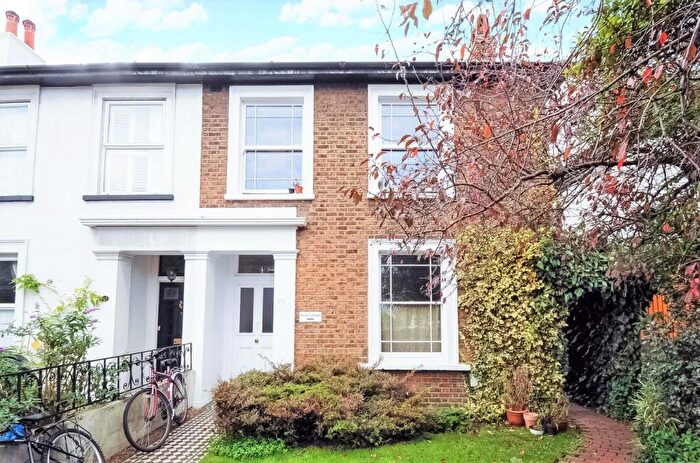
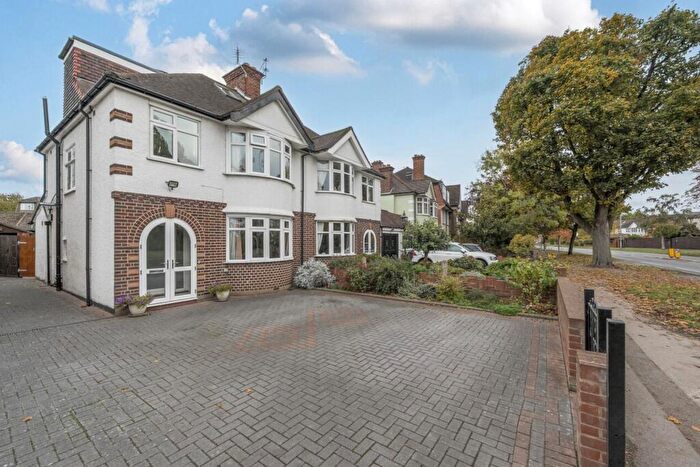
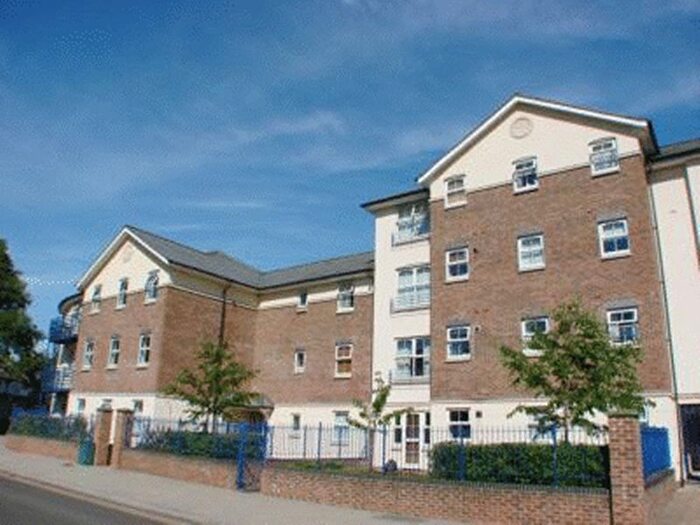
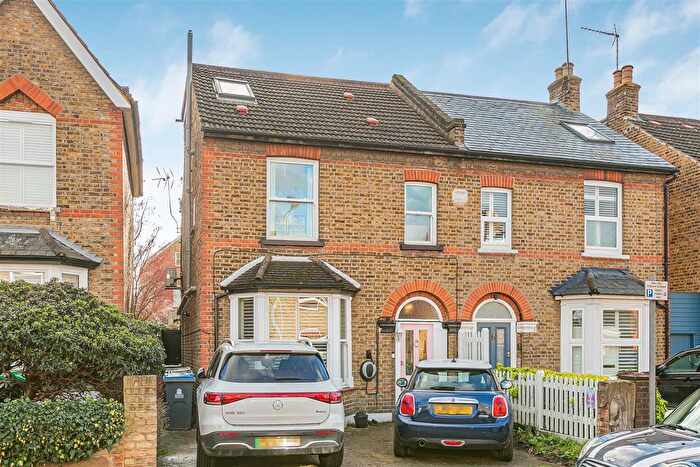
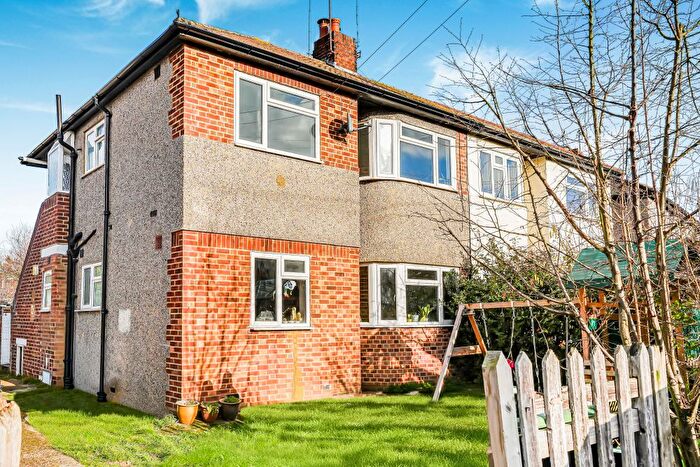
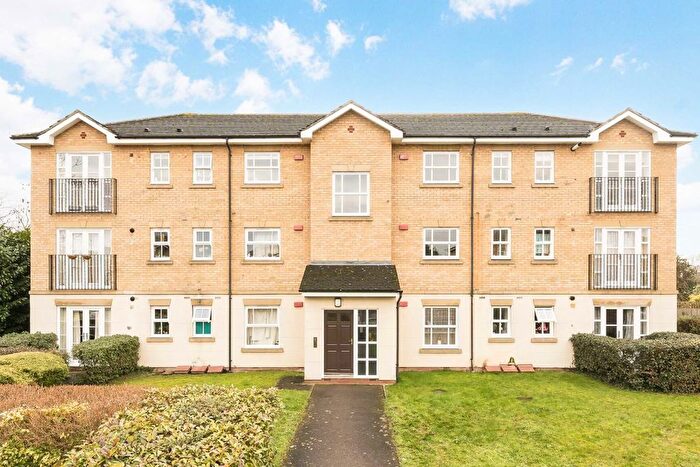
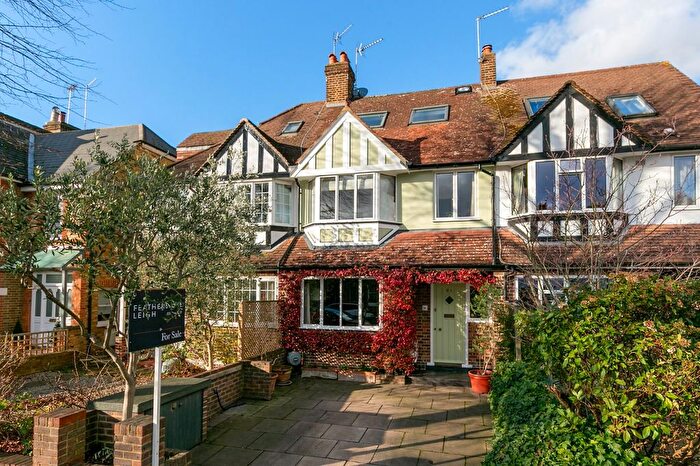
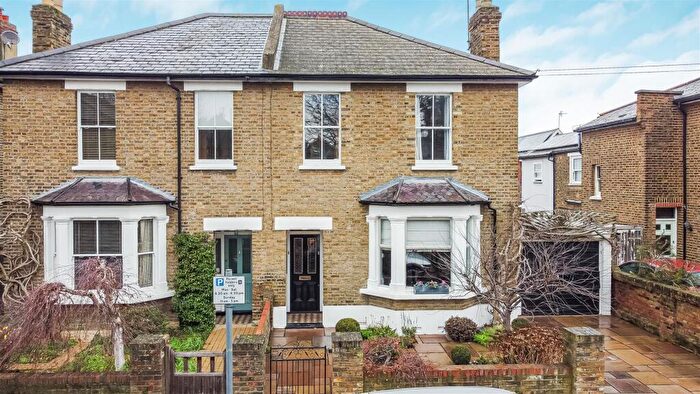
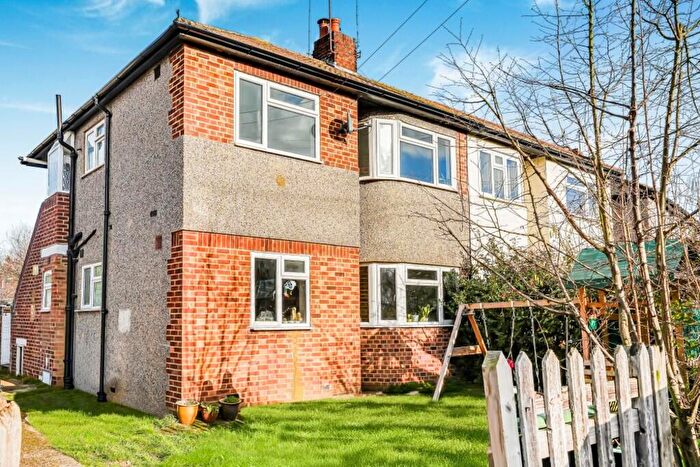
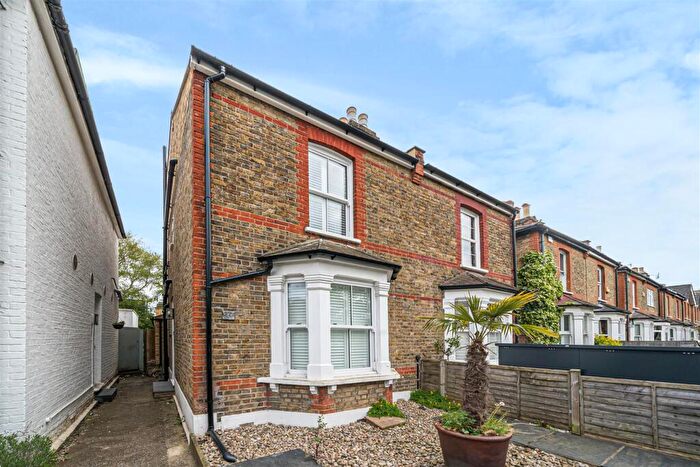
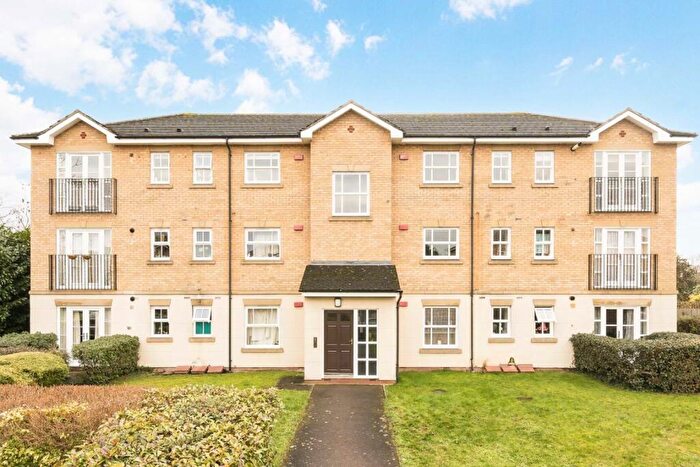
Properties for sale in Tudor
Roads and Postcodes in Tudor
Navigate through our locations to find the location of your next house in Tudor, Kingston Upon Thames for sale or to rent.
| Streets | Postcodes |
|---|---|
| Albany Mews | KT2 5SL |
| Albany Park Road | KT2 5SP KT2 5SR KT2 5SS KT2 5ST KT2 5SU KT2 5SW KT2 5SY |
| Aldersbrook Drive | KT2 5TZ |
| Anne Boleyns Walk | KT2 5NS |
| Aragon Road | KT2 5QA KT2 5QB KT2 5QD KT2 5QE |
| Archer Close | KT2 5NE KT2 5NF |
| Bank Lane | KT2 5AZ |
| Barnfield Avenue | KT2 5RD KT2 5RE KT2 5RF KT2 5RG KT2 5RQ |
| Barnfield Gardens | KT2 5RH KT2 5RJ |
| Bearfield Road | KT2 5ET |
| Berkeley Close | KT2 5AB |
| Bertram Road | KT2 5LA |
| Biggin Hill Close | KT2 5GB |
| Brough Close | KT2 5DB |
| Camel Grove | KT2 5GR |
| Cardinal Avenue | KT2 5RX KT2 5RY KT2 5RZ KT2 5SA KT2 5SB |
| Chestnut Road | KT2 5AP |
| Chivenor Grove | KT2 5GE |
| Cranleigh Gardens | KT2 5TX |
| Debden Close | KT2 5GD |
| Dukes Avenue | KT2 5QR KT2 5QY |
| Durlston Road | KT2 5RR KT2 5RS KT2 5RT KT2 5RU |
| Dysart Avenue | KT2 5QZ KT2 5RA KT2 5RB |
| Eastbury Road | KT2 5AL KT2 5AN |
| Fernhill Gardens | KT2 5DL |
| Garth Close | KT2 5PA |
| Garth Road | KT2 5NY |
| Grosvenor Gardens | KT2 5BE |
| Hatch Place | KT2 5NB |
| Hollybush Road | KT2 5SD KT2 5SE |
| Hornchurch Close | KT2 5GH |
| Horsley Drive | KT2 5GG KT2 5GQ |
| Kelvedon Close | KT2 5LF KT2 5LG |
| Kestrel Close | KT2 5GU |
| Kings Road | KT2 5JA KT2 5JB KT2 5JJ |
| Lancaster Close | KT2 5NH KT2 5NJ |
| Lancaster Gardens | KT2 5NL KT2 5NQ |
| Latchmere Lane | KT2 5SF KT2 5SG KT2 5SQ |
| Latchmere Road | KT2 5TP KT2 5TS KT2 5TW |
| Lower Ham Road | KT2 5AJ KT2 5AR KT2 5AU KT2 5AW KT2 5AX KT2 5AY KT2 5BA KT2 5BB KT2 5BD KT2 5BH |
| Manston Grove | KT2 5GF |
| Northweald Lane | KT2 5GL KT2 5GN KT2 5GW |
| Oakhurst Close | KT2 5EQ |
| Osborne Road | KT2 5HB |
| Park Gardens | KT2 5LT |
| Park Road | KT2 5JZ KT2 5LP KT2 5LS KT2 5LW KT2 5LY KT2 5NA KT2 5RL |
| Parkfields Road | KT2 5LL |
| Richmond Road | KT2 5BT KT2 5BX KT2 5BZ KT2 5DA KT2 5DD KT2 5DE KT2 5DF KT2 5DH KT2 5DJ KT2 5DQ KT2 5DT KT2 5DZ KT2 5EJ KT2 5ES KT2 5EZ KT2 5HA KT2 5HD KT2 5HE KT2 5HF KT2 5HG KT2 5LH KT2 5PP KT2 5PR KT2 5PT KT2 5PW KT2 5PE KT2 5PL |
| Salamander Close | KT2 5GS |
| Sopwith Close | KT2 5RN |
| St Albans Road | KT2 5HH KT2 5HQ |
| St Georges Industrial Estate | KT2 5BQ |
| Stable Close | KT2 5PJ |
| Studland Road | KT2 5HJ |
| Tangmere Grove | KT2 5GT |
| Thorpe Road | KT2 5EU |
| Tudor Drive | KT2 5NN KT2 5NP KT2 5NR KT2 5NT KT2 5NU KT2 5NW KT2 5PF KT2 5PZ KT2 5QF KT2 5QG KT2 5QH KT2 5QJ KT2 5QL |
| Upper Park Road | KT2 5LB KT2 5LD |
| Watermans Close | KT2 5AS |
| Wilmer Close | KT2 5LX |
| Wilmer Crescent | KT2 5LU |
| Windsor Road | KT2 5EY |
| Wingfield Road | KT2 5LR |
| Wittering Close | KT2 5GA |
| Wolsey Drive | KT2 5DN KT2 5DP KT2 5DR KT2 5DW |
| Woodcote Close | KT2 5LZ |
| Woodside Road | KT2 5AT |
| Yeovilton Place | KT2 5GP |
Transport near Tudor
-
Kingston Station
-
Hampton Wick Station
-
Norbiton Station
-
Teddington Station
-
Strawberry Hill Station
-
Berrylands Station
-
Twickenham Station
-
Fulwell Station
-
Surbiton Station
-
St Margarets Station
- FAQ
- Price Paid By Year
- Property Type Price
Frequently asked questions about Tudor
What is the average price for a property for sale in Tudor?
The average price for a property for sale in Tudor is £887,748. This amount is 19% higher than the average price in Kingston Upon Thames. There are 2,827 property listings for sale in Tudor.
What streets have the most expensive properties for sale in Tudor?
The streets with the most expensive properties for sale in Tudor are Studland Road at an average of £1,715,000, Latchmere Road at an average of £1,545,833 and Kings Road at an average of £1,487,400.
What streets have the most affordable properties for sale in Tudor?
The streets with the most affordable properties for sale in Tudor are Biggin Hill Close at an average of £385,000, Park Gardens at an average of £396,250 and Wilmer Crescent at an average of £420,000.
Which train stations are available in or near Tudor?
Some of the train stations available in or near Tudor are Kingston, Hampton Wick and Norbiton.
Property Price Paid in Tudor by Year
The average sold property price by year was:
| Year | Average Sold Price | Price Change |
Sold Properties
|
|---|---|---|---|
| 2025 | £818,226 | -6% |
70 Properties |
| 2024 | £869,899 | -9% |
83 Properties |
| 2023 | £948,786 | 6% |
104 Properties |
| 2022 | £890,782 | 5% |
118 Properties |
| 2021 | £843,332 | 11% |
164 Properties |
| 2020 | £751,870 | 4% |
98 Properties |
| 2019 | £718,217 | 3% |
117 Properties |
| 2018 | £693,907 | -13% |
98 Properties |
| 2017 | £784,102 | 1% |
96 Properties |
| 2016 | £774,900 | 7% |
103 Properties |
| 2015 | £722,281 | 19% |
142 Properties |
| 2014 | £587,205 | -1% |
151 Properties |
| 2013 | £593,210 | 21% |
123 Properties |
| 2012 | £468,610 | -4% |
103 Properties |
| 2011 | £489,310 | 12% |
128 Properties |
| 2010 | £432,870 | -1% |
176 Properties |
| 2009 | £436,290 | -6% |
119 Properties |
| 2008 | £462,572 | 5% |
96 Properties |
| 2007 | £438,498 | 12% |
182 Properties |
| 2006 | £386,714 | 16% |
244 Properties |
| 2005 | £326,529 | 3% |
175 Properties |
| 2004 | £317,485 | 1% |
211 Properties |
| 2003 | £315,613 | 10% |
190 Properties |
| 2002 | £282,853 | 11% |
290 Properties |
| 2001 | £252,852 | 5% |
203 Properties |
| 2000 | £239,845 | 22% |
220 Properties |
| 1999 | £188,088 | 15% |
235 Properties |
| 1998 | £160,741 | 0,3% |
231 Properties |
| 1997 | £160,334 | 13% |
270 Properties |
| 1996 | £140,156 | 6% |
344 Properties |
| 1995 | £131,880 | - |
198 Properties |
Property Price per Property Type in Tudor
Here you can find historic sold price data in order to help with your property search.
The average Property Paid Price for specific property types in the last three years are:
| Property Type | Average Sold Price | Sold Properties |
|---|---|---|
| Flat | £483,628.00 | 65 Flats |
| Semi Detached House | £1,030,077.00 | 79 Semi Detached Houses |
| Detached House | £1,351,263.00 | 36 Detached Houses |
| Terraced House | £866,154.00 | 77 Terraced Houses |

