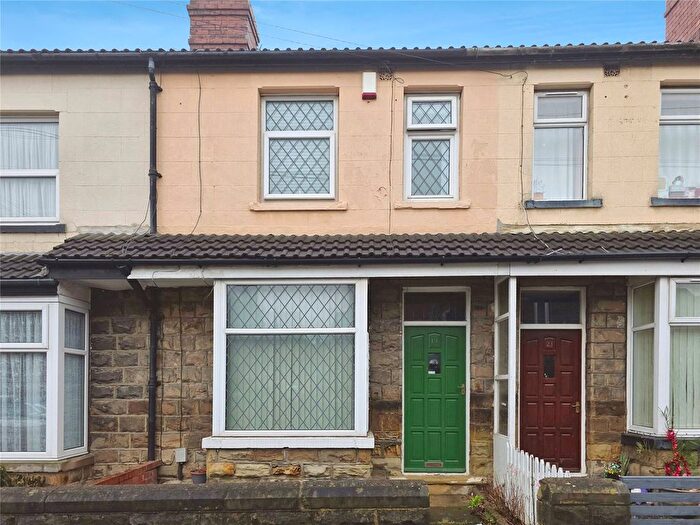
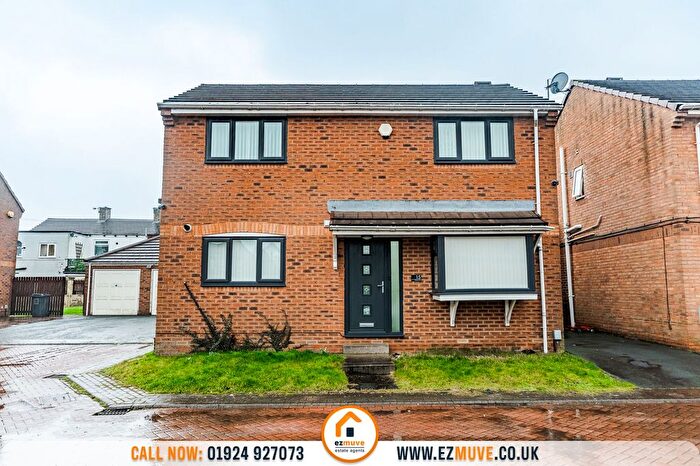
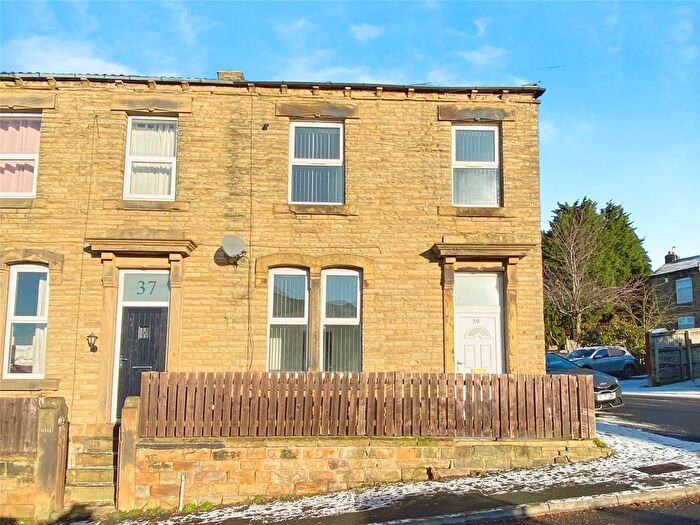
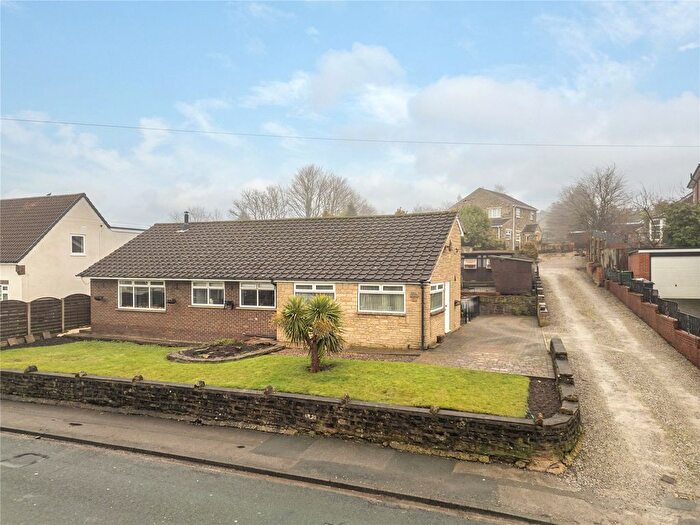
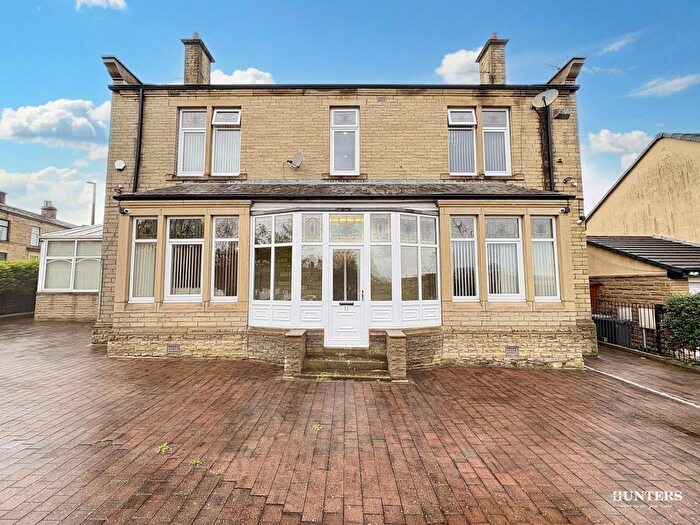
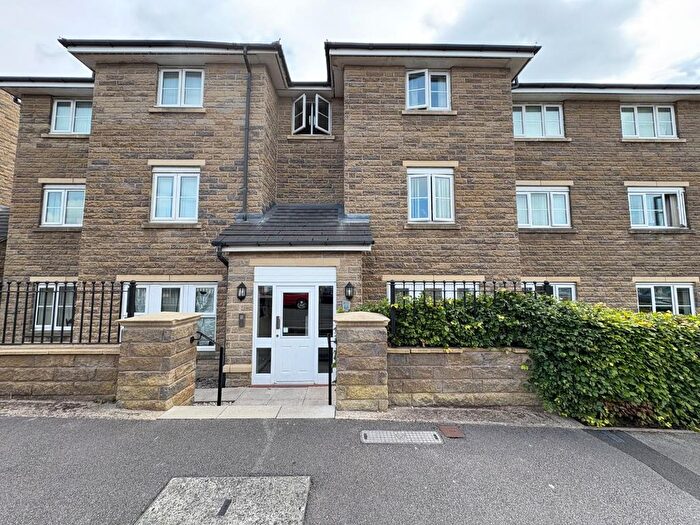
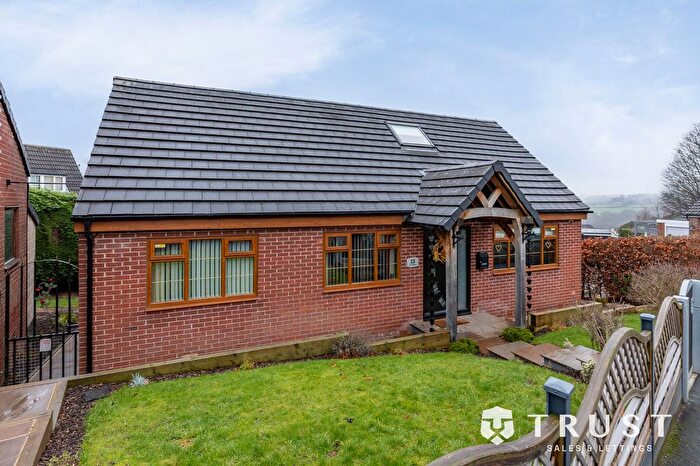
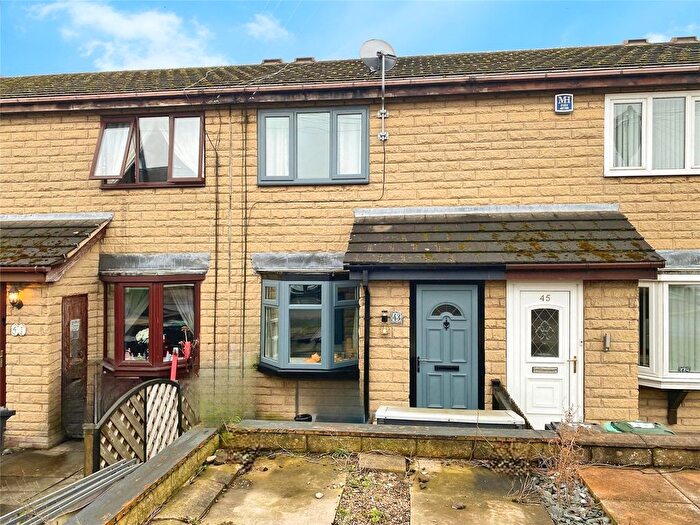
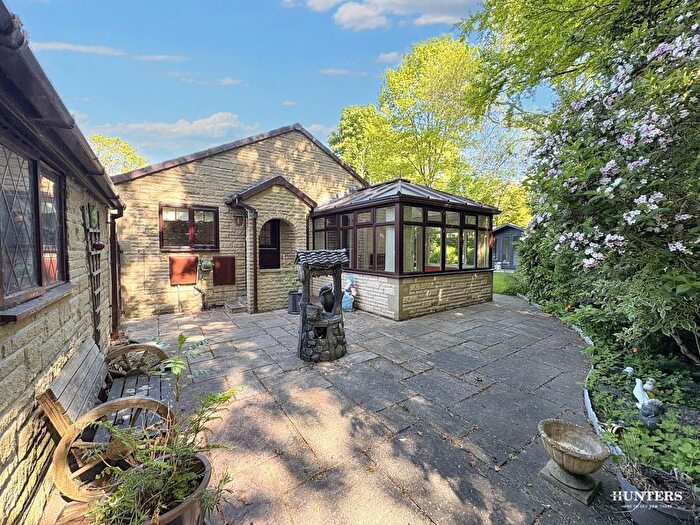
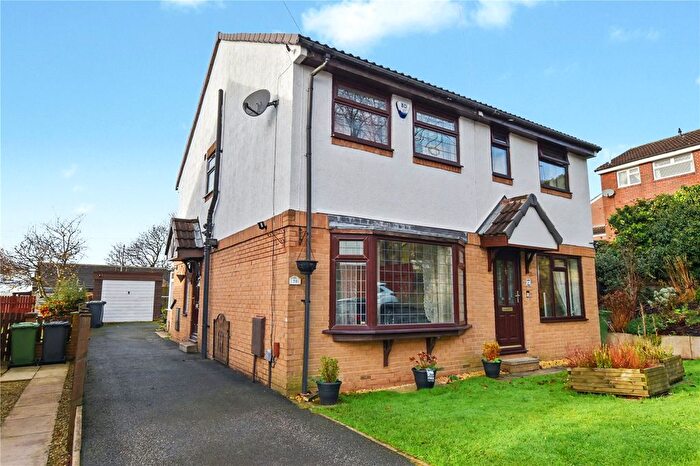
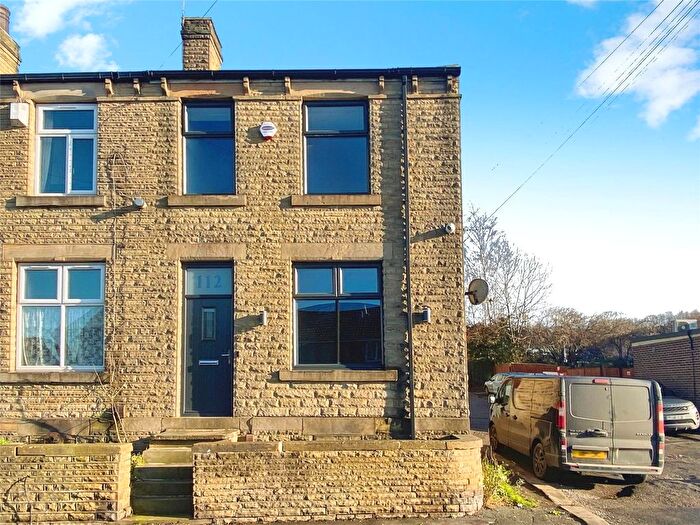
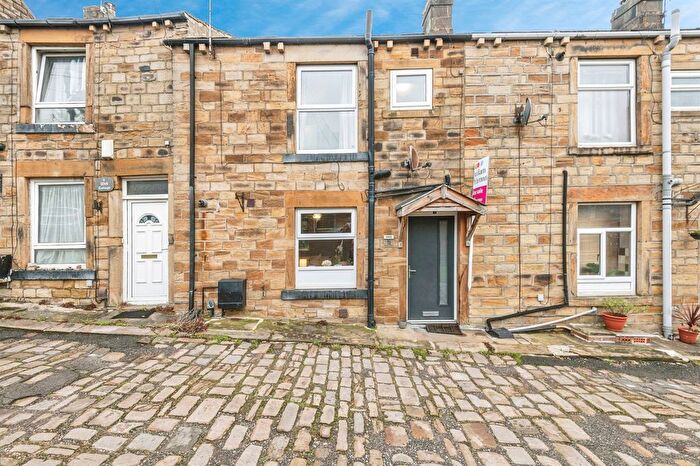
Houses for sale & to rent in Batley West, Dewsbury
House Prices in Batley West
Properties in Batley West have an average house price of £147,998.00 and had 96 Property Transactions within the last 3 years¹.
Batley West is an area in Dewsbury, Kirklees with 1,080 households², where the most expensive property was sold for £300,000.00.
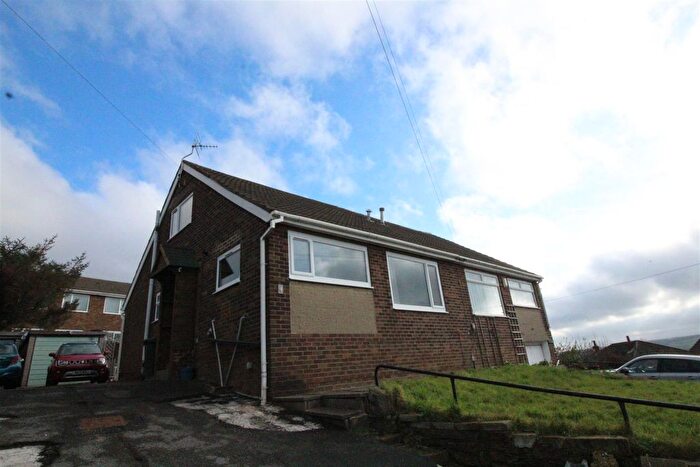
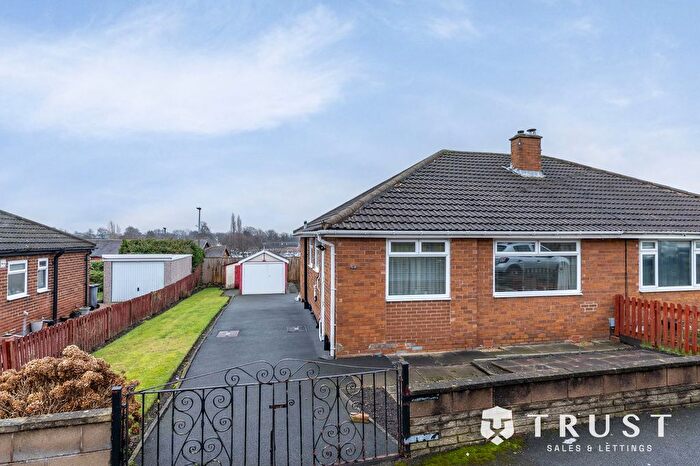
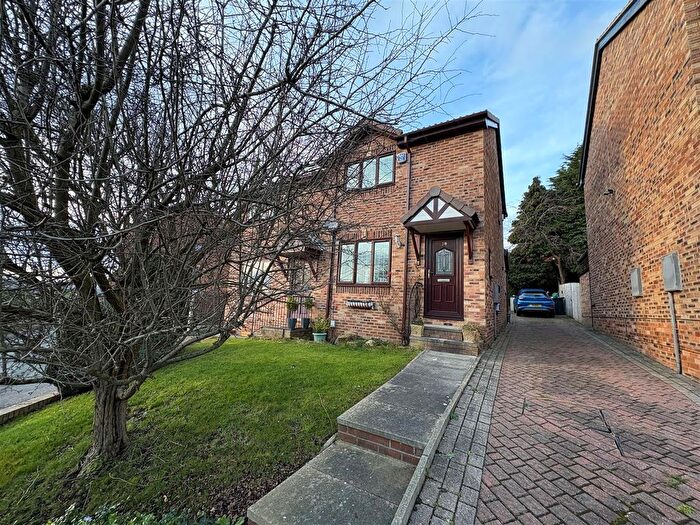
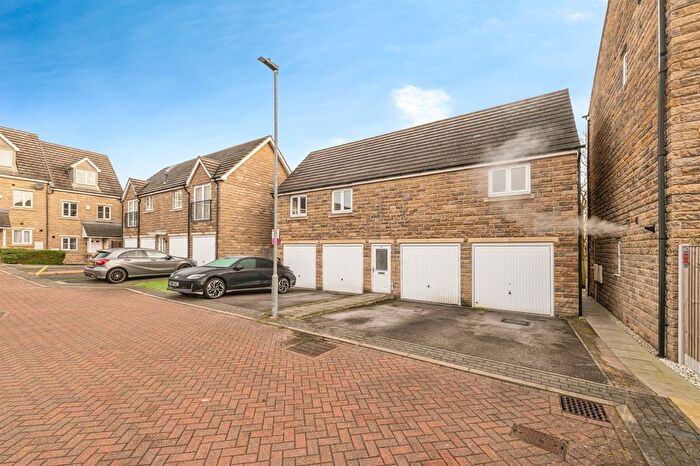
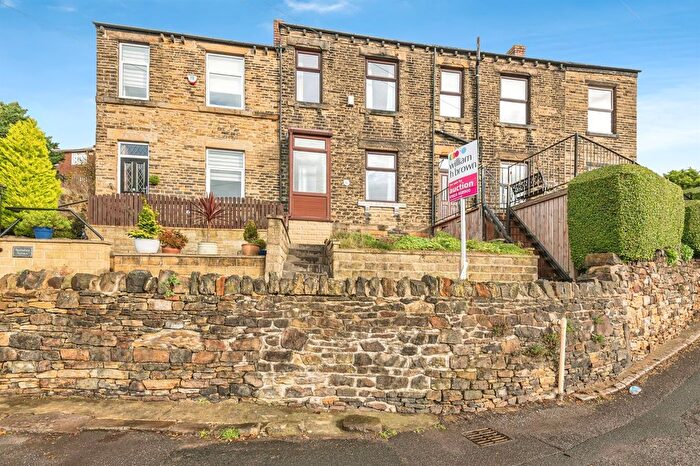
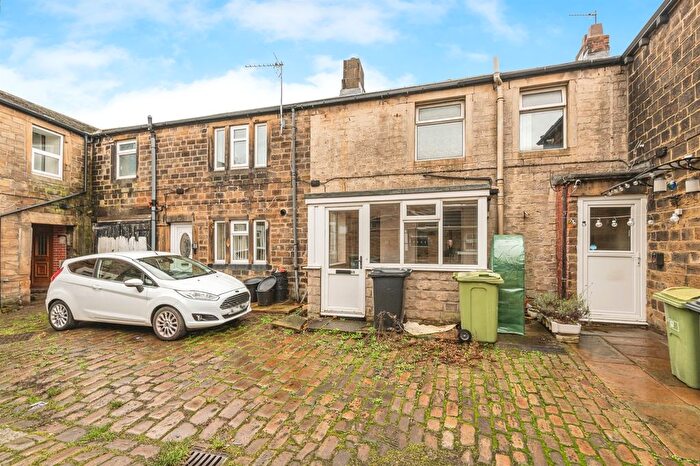
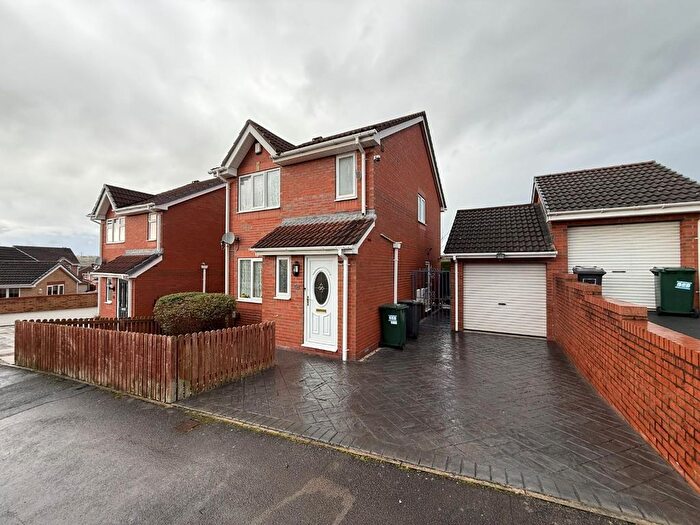
Properties for sale in Batley West
Previously listed properties in Batley West
Roads and Postcodes in Batley West
Navigate through our locations to find the location of your next house in Batley West, Dewsbury for sale or to rent.
| Streets | Postcodes |
|---|---|
| Boundary Terrace | WF13 4PN |
| Brewerton Lane | WF13 4PB |
| Bronte Close | WF13 4SA |
| Carlinghow Court | WF13 4BL |
| Carrs Close | WF13 4BW |
| Churwell Avenue | WF13 4PL |
| Creswell Lane | WF13 4PH WF13 4PJ |
| Cullingworth Street | WF13 4AN |
| Dewsbury Gate Road | WF13 4AX WF13 4DD |
| Garnett Street | WF13 4AT |
| Halifax Road | WF13 4AA WF13 4AF WF13 4AS WF13 4AW WF13 4AZ WF13 4BD WF13 4DT WF13 4JJ WF13 4AD WF13 4AP WF13 4HS |
| Healds Road | WF13 4HT |
| Highfield Chase | WF13 4DE WF13 4DG |
| Highfield Lane | WF13 4BQ |
| Hillary Street | WF13 4AU |
| Jensen Avenue | WF13 4QX |
| Kilpin Hill Lane | WF13 4BH WF13 4BS |
| Lawnhurst Mews | WF13 4TB |
| Lemans Drive | WF13 4AL |
| Longlands Road | WF13 4AB WF13 4HZ |
| Lord Street | WF13 4BE |
| Lyndale Mews | WF13 4BU |
| Mavis Road | WF13 4BB |
| Millbrook Gardens | WF13 4SF |
| Moor End Lane | WF13 4PG WF13 4SD |
| Morlands Close | WF13 4BN |
| Occupation Lane | WF13 4BJ WF13 4BP |
| Pit Lane | WF13 4RF |
| Spinners Fold | WF13 4DB |
| Squirrel Close | WF13 4AE |
| Squirrel End | WF13 4AG |
| Squirrel Hall Drive | WF13 4AH WF13 4AJ |
| Squirrel Walk | WF13 4AQ |
| Staincliffe Mill Yard | WF13 4AR |
| Staincliffe Road | WF13 4JN WF13 4RA WF13 4RB |
| The Avenue | WF13 4BA |
| Wellfield Mews | WF13 4SH |
| William Street | WF13 4AY |
Transport near Batley West
- FAQ
- Price Paid By Year
- Property Type Price
Frequently asked questions about Batley West
What is the average price for a property for sale in Batley West?
The average price for a property for sale in Batley West is £147,998. This amount is 17% lower than the average price in Dewsbury. There are 562 property listings for sale in Batley West.
What streets have the most expensive properties for sale in Batley West?
The streets with the most expensive properties for sale in Batley West are Lord Street at an average of £254,000, Healds Road at an average of £226,666 and Moor End Lane at an average of £202,333.
What streets have the most affordable properties for sale in Batley West?
The streets with the most affordable properties for sale in Batley West are Hillary Street at an average of £52,250, Cullingworth Street at an average of £87,750 and Lemans Drive at an average of £91,611.
Which train stations are available in or near Batley West?
Some of the train stations available in or near Batley West are Dewsbury, Batley and Ravensthorpe.
Property Price Paid in Batley West by Year
The average sold property price by year was:
| Year | Average Sold Price | Price Change |
Sold Properties
|
|---|---|---|---|
| 2025 | £162,465 | 12% |
30 Properties |
| 2024 | £142,952 | 2% |
33 Properties |
| 2023 | £139,893 | -1% |
33 Properties |
| 2022 | £141,252 | 15% |
53 Properties |
| 2021 | £120,405 | -0,4% |
66 Properties |
| 2020 | £120,902 | -6% |
46 Properties |
| 2019 | £127,815 | 11% |
44 Properties |
| 2018 | £114,136 | 8% |
58 Properties |
| 2017 | £104,627 | 2% |
36 Properties |
| 2016 | £102,214 | -7% |
41 Properties |
| 2015 | £109,446 | 7% |
47 Properties |
| 2014 | £101,959 | -12% |
50 Properties |
| 2013 | £113,695 | -10% |
41 Properties |
| 2012 | £124,845 | -7% |
44 Properties |
| 2011 | £134,186 | -6% |
49 Properties |
| 2010 | £142,490 | 19% |
44 Properties |
| 2009 | £114,903 | -19% |
56 Properties |
| 2008 | £137,098 | 4% |
95 Properties |
| 2007 | £131,054 | 9% |
96 Properties |
| 2006 | £118,812 | 12% |
67 Properties |
| 2005 | £104,936 | 6% |
63 Properties |
| 2004 | £99,136 | 17% |
47 Properties |
| 2003 | £81,946 | 22% |
73 Properties |
| 2002 | £64,228 | 20% |
63 Properties |
| 2001 | £51,223 | -0,3% |
56 Properties |
| 2000 | £51,370 | 11% |
46 Properties |
| 1999 | £45,676 | -9% |
36 Properties |
| 1998 | £49,769 | 4% |
59 Properties |
| 1997 | £47,813 | 9% |
62 Properties |
| 1996 | £43,581 | 11% |
45 Properties |
| 1995 | £38,800 | - |
32 Properties |
Property Price per Property Type in Batley West
Here you can find historic sold price data in order to help with your property search.
The average Property Paid Price for specific property types in the last three years are:
| Property Type | Average Sold Price | Sold Properties |
|---|---|---|
| Semi Detached House | £180,230.00 | 26 Semi Detached Houses |
| Detached House | £199,125.00 | 12 Detached Houses |
| Terraced House | £143,304.00 | 39 Terraced Houses |
| Flat | £81,236.00 | 19 Flats |

