
Houses for sale in Kirklees, England
House Prices in Kirklees
Properties in Kirklees have
an average house price of
£221k
and had 17,157 Property Transactions
within the last 3 years.¹
Kirklees is a location in
England with
178,390 households², where the most expensive property was sold for £2.8M.
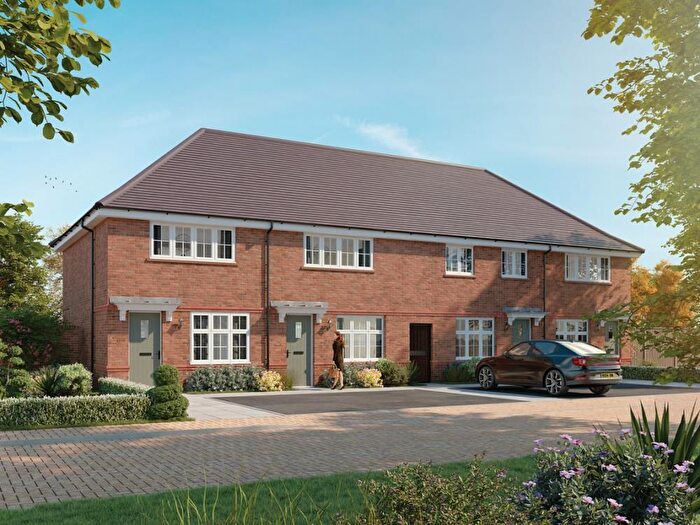
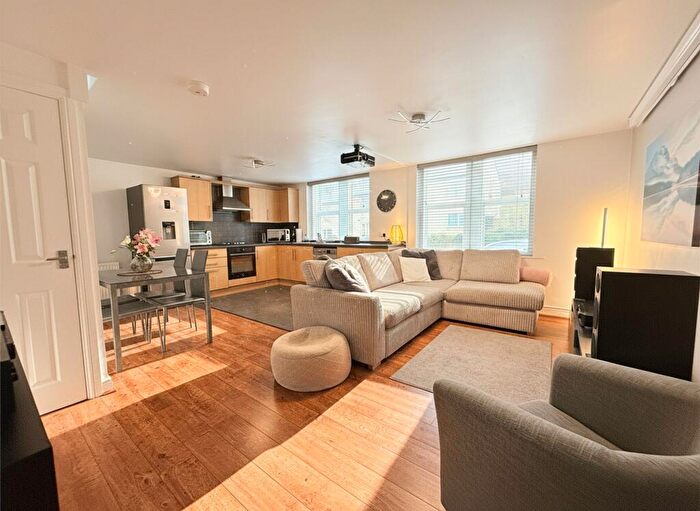
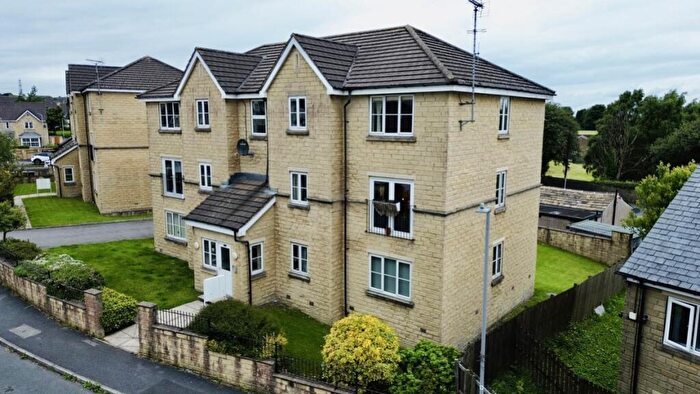
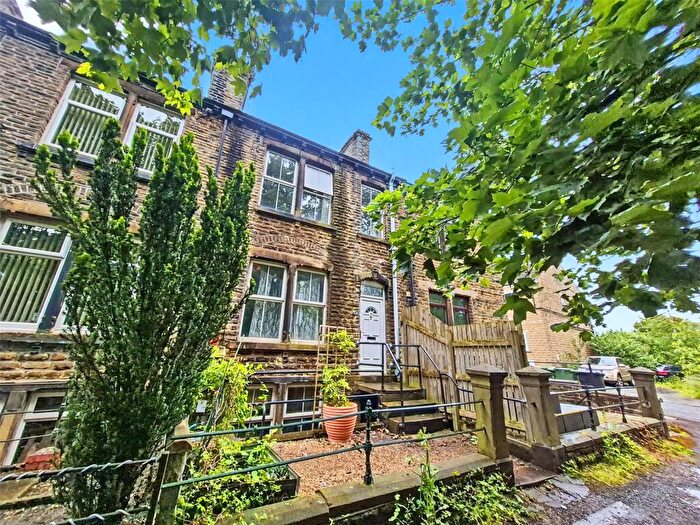
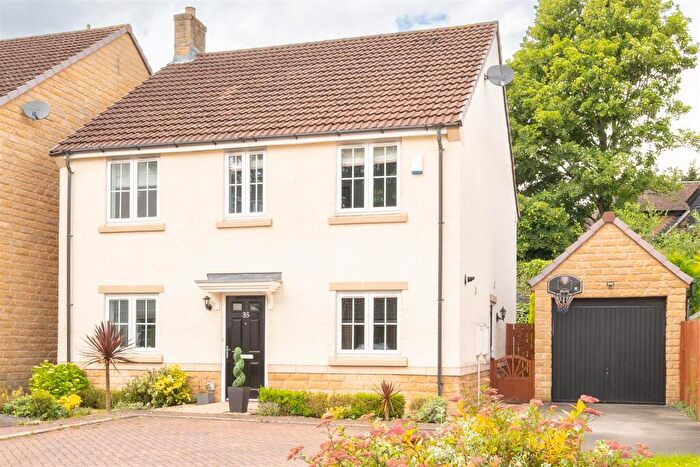
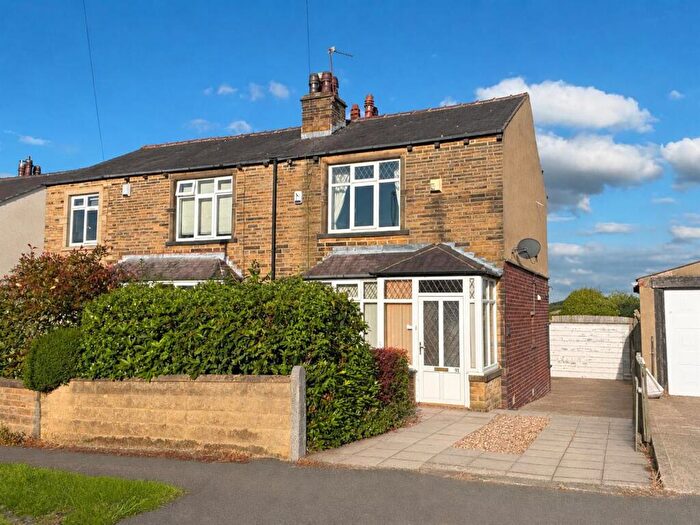
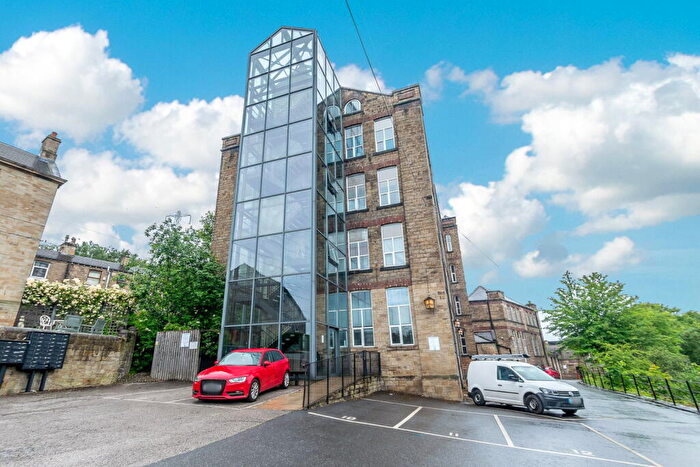
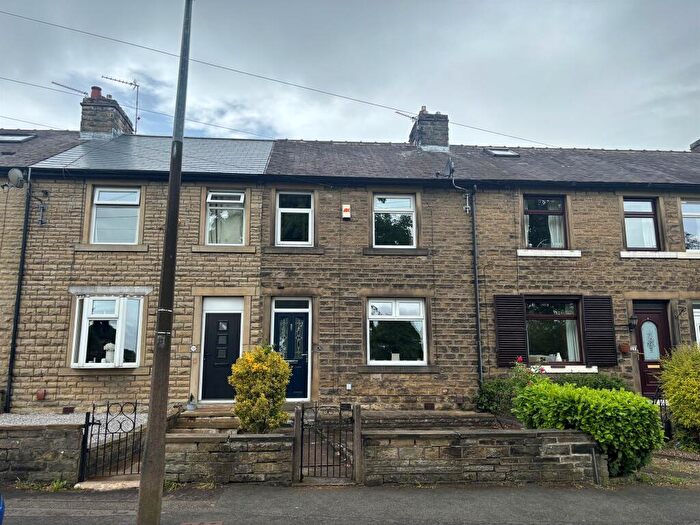
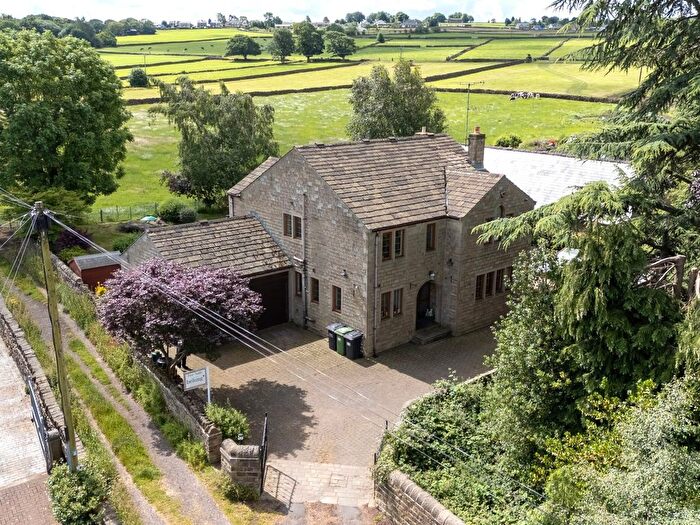
Properties for sale in Kirklees
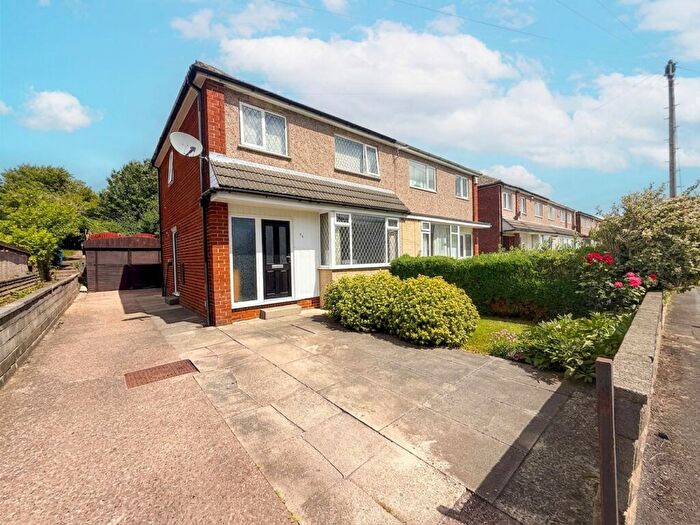
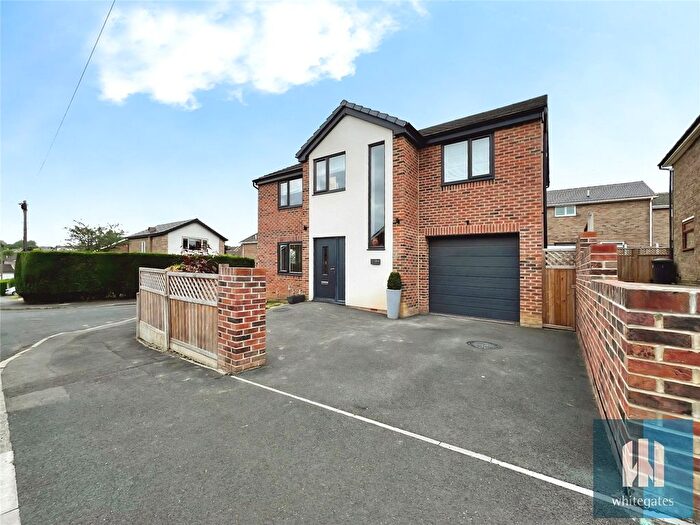
![]()
If you are looking to sell your house, let it out, or receive a property valuation, an expert can help you.
Click the button below to get started.

Towns in Kirklees
Navigate through our locations to find the location of your next house in Kirklees, England for sale or to rent.
Property price trends in Kirklees
According to the latest Land Registry data, the average home in Kirklees sold for £235,165 in 2026. That figure comes from a substantial record of 205,479 sales logged over the past 31 years.
Prices have continued to climb over the last three years. Compared with 2023, when the typical sale came in around £209,762, that's a rise of roughly 12.1%.
Looking back five years, average prices are up about 13.8% since 2021, a gain of around £28,464 in cash terms.
Zoom out to the past decade for the fuller picture. Back in 2016, homes here averaged £161,393, so the typical sold price has climbed about 45.7% since then, roughly 3.8% a year. Stretch the view to fifteen years and that annual pace eases back to about 3.3%.
Frequently asked questions about Kirklees
What is the average price for a property for sale in Kirklees?
The average price for a property for sale in Kirklees is £220,765. This amount is 39% lower than the average price in England. There are more than 10,000 property listings for sale in Kirklees.
What locations have the most expensive properties for sale in Kirklees?
The locations with the most expensive properties for sale in Kirklees are Halifax at an average of £487,000, Wakefield at an average of £330,451 and Brighouse at an average of £310,000.
What locations have the most affordable properties for sale in Kirklees?
The locations with the most affordable properties for sale in Kirklees are Ossett at an average of £151,583, Heckmondwike at an average of £164,239 and Dewsbury at an average of £177,801.
Which train stations are available in or near Kirklees?
Some of the train stations available in or near Kirklees are Deighton, Mirfield and Huddersfield.
Property Price Paid in Kirklees by Year
The average sold property price by year was:
| Year | Average Sold Price | Price Change |
Sold Properties
|
|---|---|---|---|
| 2026 | £235,165 | 2% |
717 Properties |
| 2025 | £230,079 | 4% |
5,428 Properties |
| 2024 | £220,450 | 5% |
5,640 Properties |
| 2023 | £209,762 | -0,1% |
5,372 Properties |
| 2022 | £210,068 | 2% |
6,288 Properties |
| 2021 | £206,701 | 7% |
7,642 Properties |
| 2020 | £191,550 | 5% |
5,991 Properties |
| 2019 | £181,077 | 4% |
6,855 Properties |
| 2018 | £174,151 | 4% |
6,752 Properties |
| 2017 | £167,188 | 3% |
6,743 Properties |
Property Price per Property Type in Kirklees
Here you can find historic sold price data in order to help with your property search.
The average Property Paid Price for specific property types in the last three years are:
| Property Type | Average Sold Price | Sold Properties |
|---|---|---|
| Semi Detached House | £213,873.00 | 5,630 Semi Detached Houses |
| Terraced House | £158,742.00 | 6,993 Terraced Houses |
| Detached House | £389,357.00 | 3,467 Detached Houses |
| Flat | £115,816.00 | 1,067 Flats |
Transport in Kirklees
Please see below transportation links in this area:
