
Houses for sale in Liversedge, Kirklees
House Prices in Liversedge
Properties in Liversedge have an average house price of £218k and had 746 Property Transactions within the last 3 years.¹
Liversedge is an area in Kirklees with 7,751 households², where the most expensive property was sold for £1.35M.
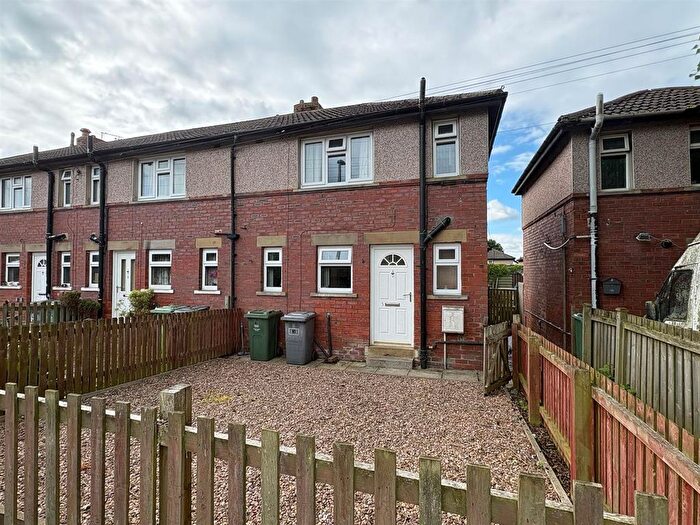
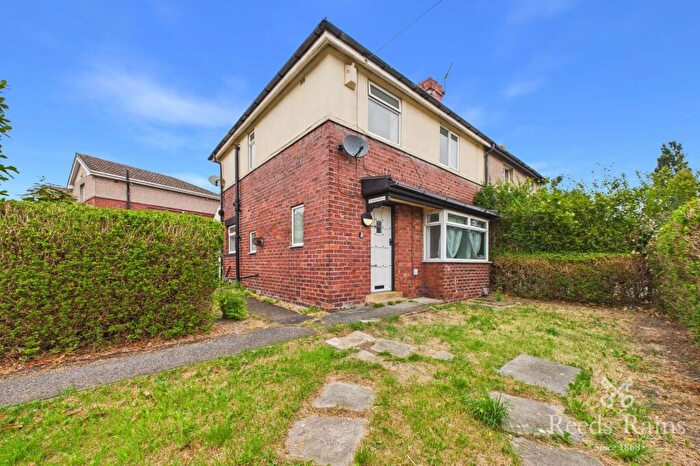
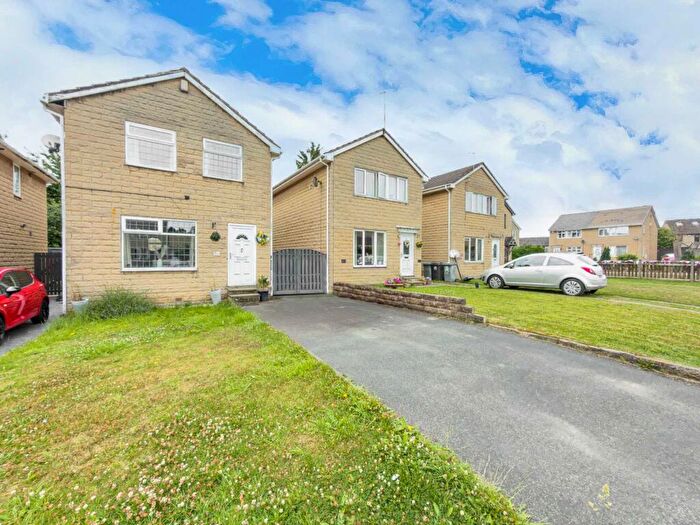
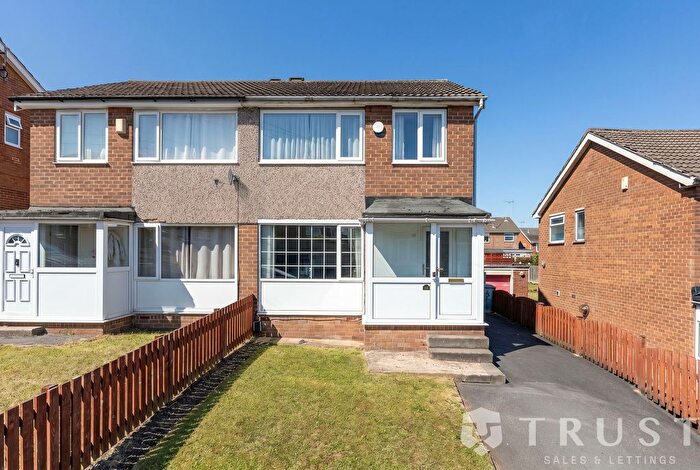
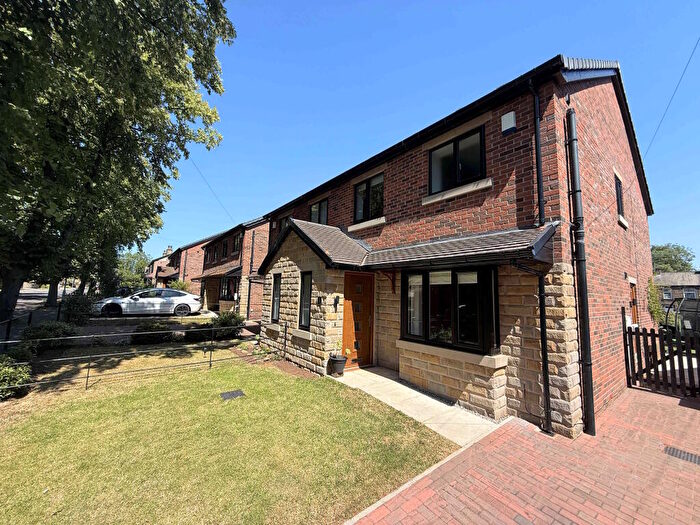
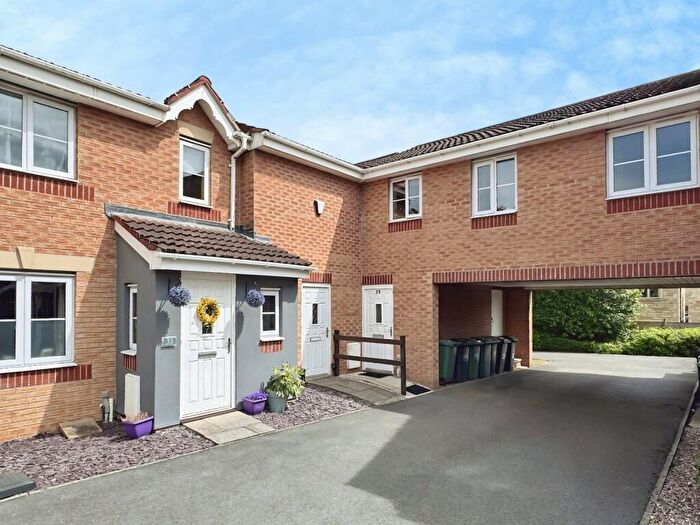
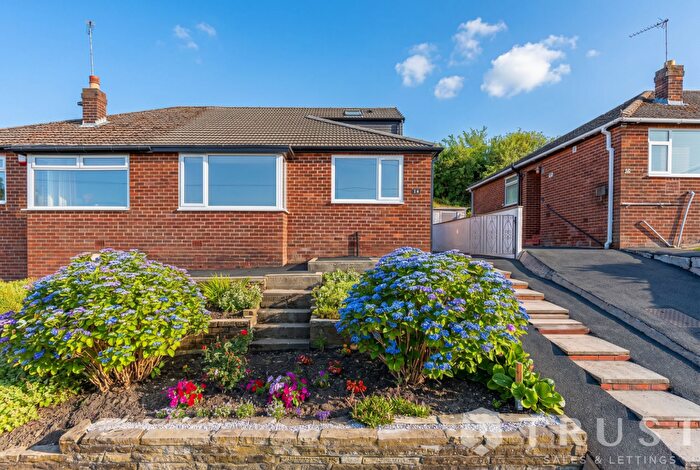
Properties for sale in Liversedge
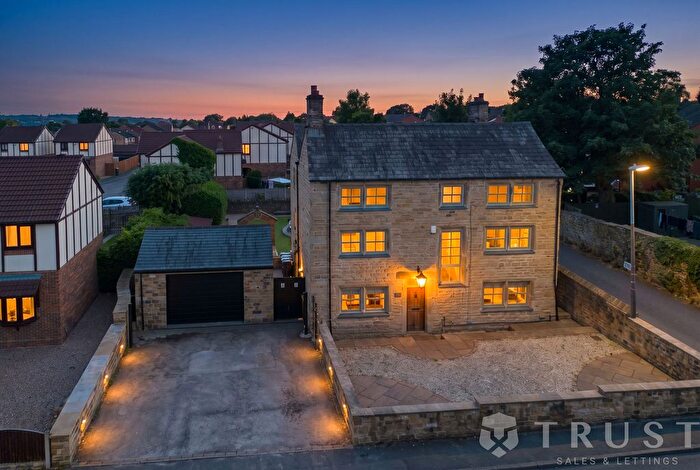
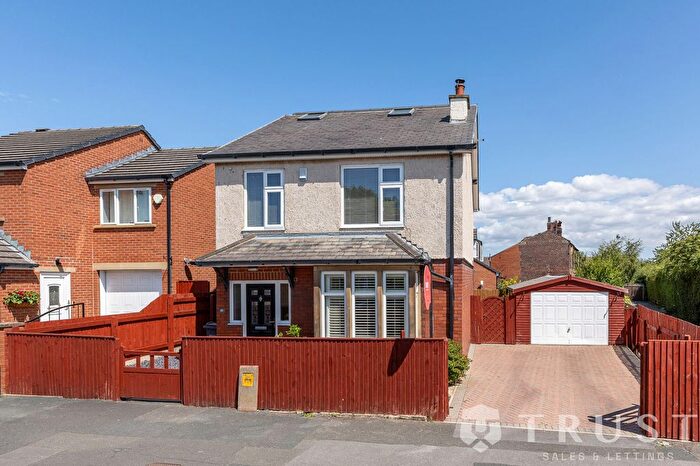
![]()
If you are looking to sell your house, let it out, or receive a property valuation, an expert can help you.
Click the button below to get started.
Neighbourhoods in Liversedge
Navigate through our locations to find the location of your next house in Liversedge, Kirklees for sale or to rent.
Property price trends in Liversedge
According to the latest Land Registry data, the average home in Liversedge sold for £195,208 in 2026. That figure comes from a substantial record of 8,616 sales logged over the past 31 years.
Prices have held fairly steady over the last three years. Compared with 2023, when the typical sale came in around £194,085, values are broadly unchanged.
Looking back five years, average prices are up about 5.5% since 2021, a gain of around £10,207 in cash terms.
Zoom out to the past decade for the fuller picture. Back in 2016, homes here averaged £141,649, so the typical sold price has climbed about 37.8% since then, roughly 3.3% a year. Stretch the view to fifteen years and that annual pace eases back to about 2.5%.
Frequently asked questions about Liversedge
What is the average price for a property for sale in Liversedge?
The average price for a property for sale in Liversedge is £218,421. This amount is 1% lower than the average price in Kirklees. There are 991 property listings for sale in Liversedge.
What locations have the most expensive properties for sale in Liversedge?
The locations with the most expensive properties for sale in Liversedge are Cleckheaton at an average of £224,478 and Liversedge And Gomersal at an average of £222,128.
What locations have the most affordable properties for sale in Liversedge?
The location with the most affordable properties for sale in Liversedge is Heckmondwike at an average of £208,348.
Which train stations are available in or near Liversedge?
Some of the train stations available in or near Liversedge are Mirfield, Ravensthorpe and Dewsbury.
Property Price Paid in Liversedge by Year
The average sold property price by year was:
| Year | Average Sold Price | Price Change |
Sold Properties
|
|---|---|---|---|
| 2026 | £195,208 | -23% |
18 Properties |
| 2025 | £239,148 | 7% |
235 Properties |
| 2024 | £221,323 | 12% |
277 Properties |
| 2023 | £194,085 | -4% |
216 Properties |
| 2022 | £201,448 | 8% |
278 Properties |
| 2021 | £185,001 | 6% |
348 Properties |
| 2020 | £173,878 | -1% |
236 Properties |
| 2019 | £174,944 | 17% |
280 Properties |
| 2018 | £145,193 | -10% |
265 Properties |
| 2017 | £159,833 | 11% |
281 Properties |
Property Price per Property Type in Liversedge
Here you can find historic sold price data in order to help with your property search.
The average Property Paid Price for specific property types in the last three years are:
| Property Type | Average Sold Price | Sold Properties |
|---|---|---|
| Semi Detached House | £199,532.00 | 282 Semi Detached Houses |
| Detached House | £371,219.00 | 153 Detached Houses |
| Terraced House | £165,503.00 | 283 Terraced Houses |
| Flat | £108,585.00 | 28 Flats |
Transport in Liversedge
Please see below transportation links in this area:
