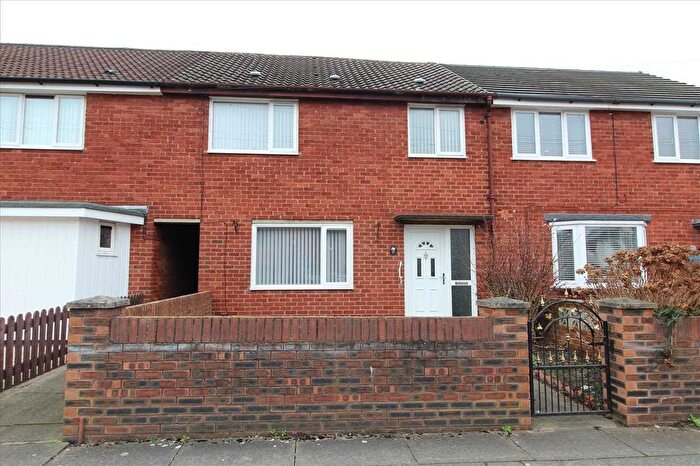
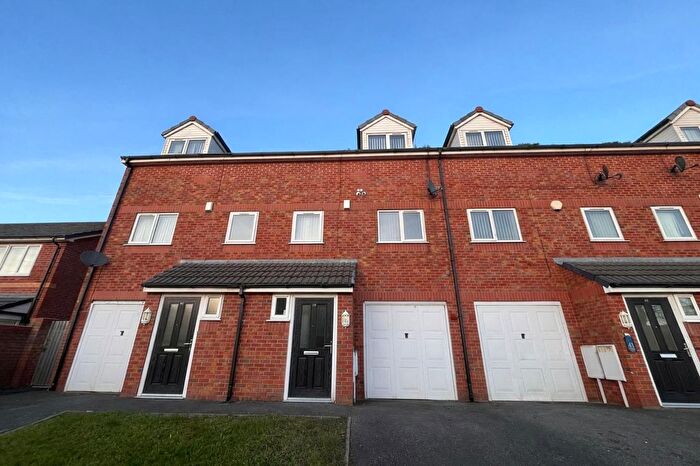
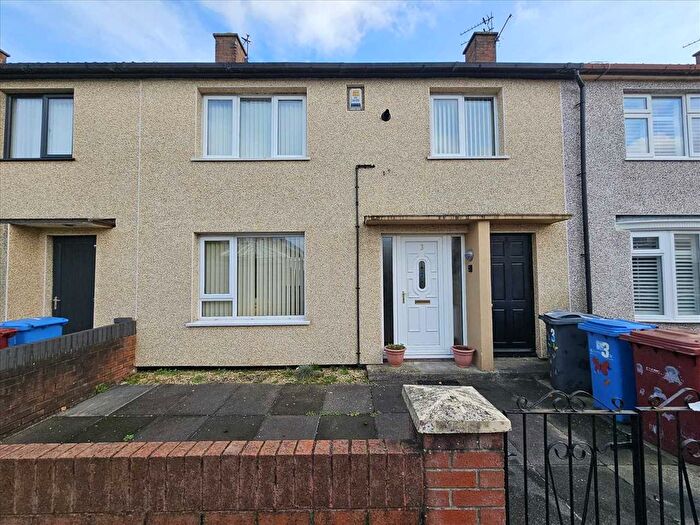
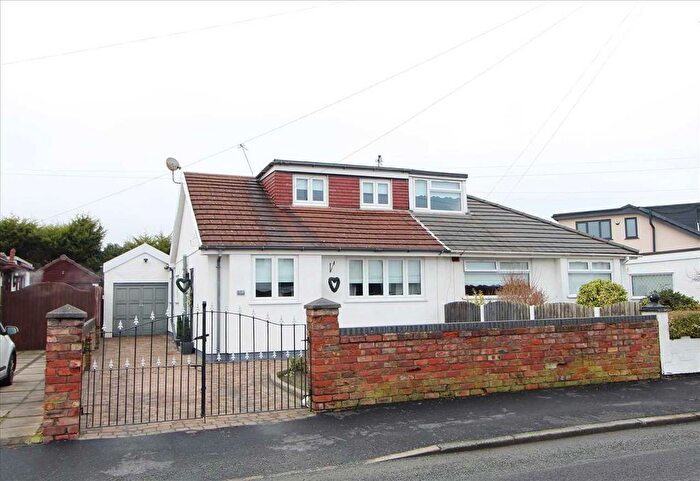
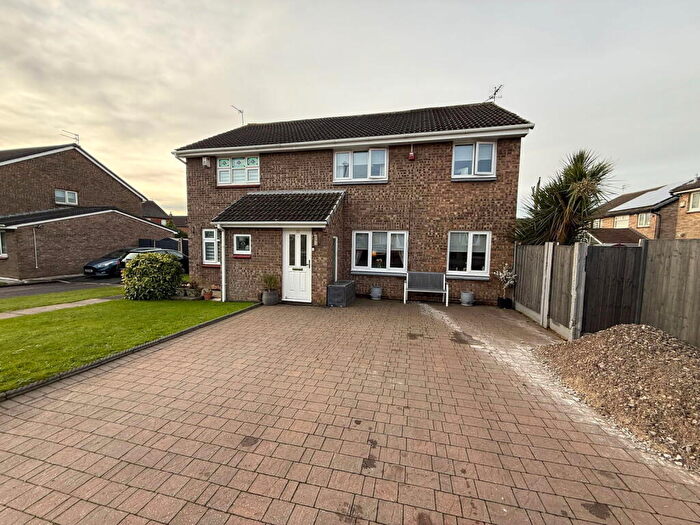
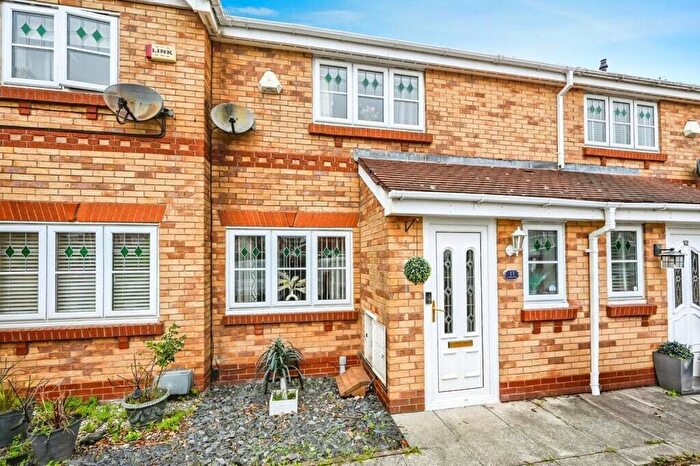
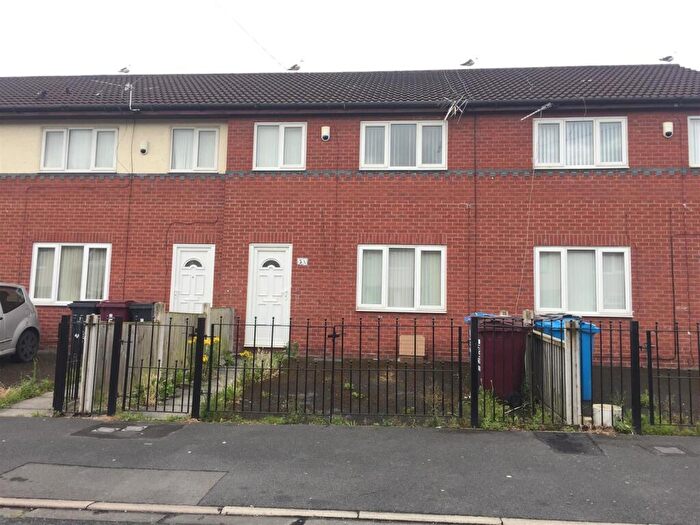
Houses for sale & to rent in Park, Liverpool
House Prices in Park
Properties in Park have an average house price of £154,524.00 and had 158 Property Transactions within the last 3 years¹.
Park is an area in Liverpool, Knowsley with 2,458 households², where the most expensive property was sold for £385,000.00.
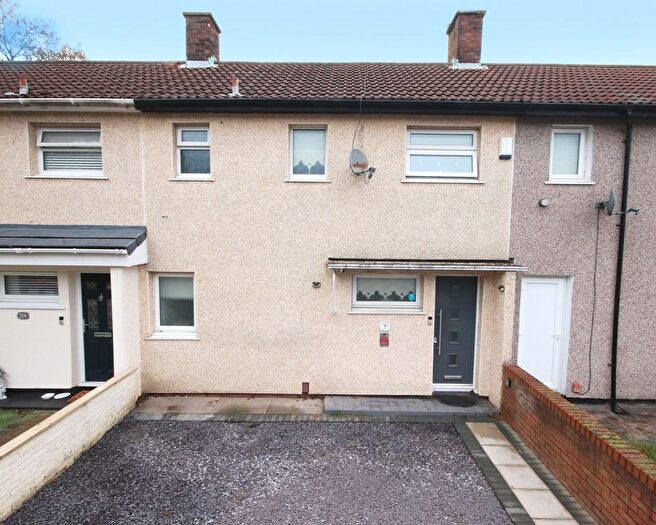
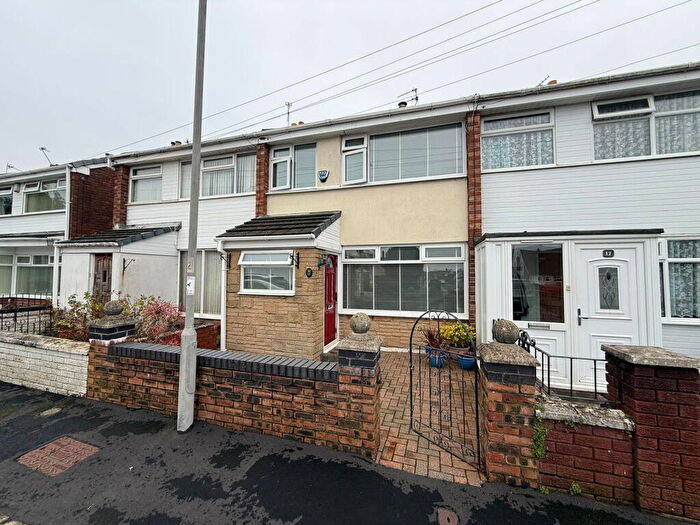
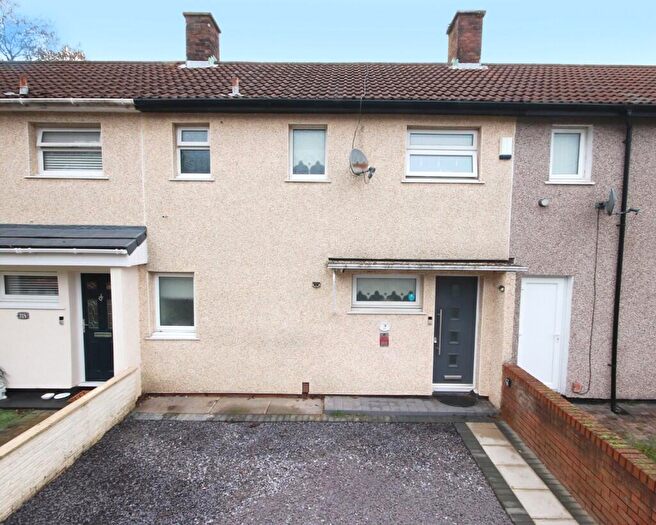
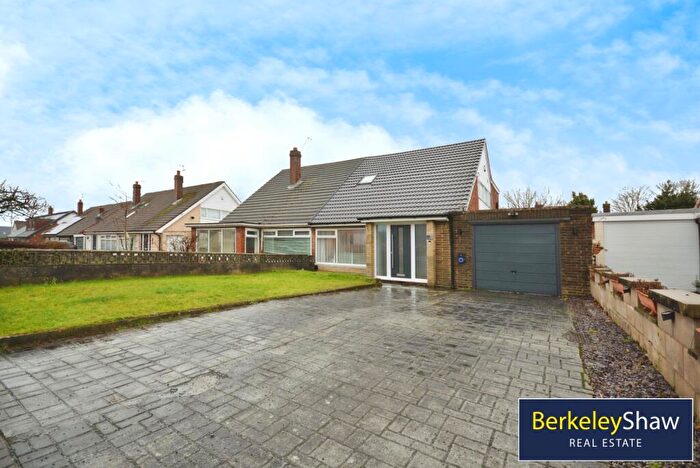
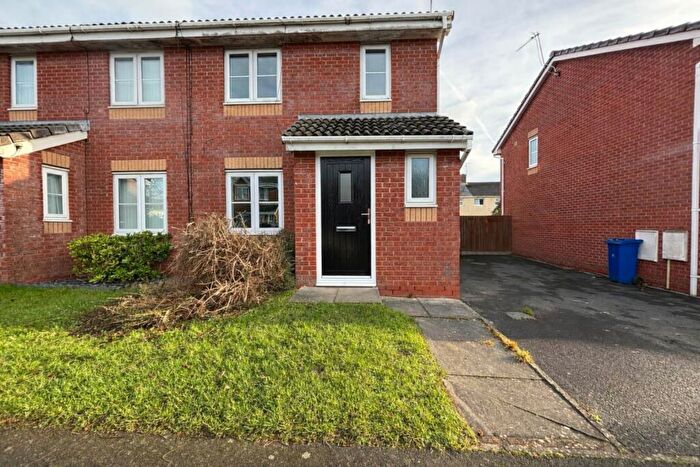
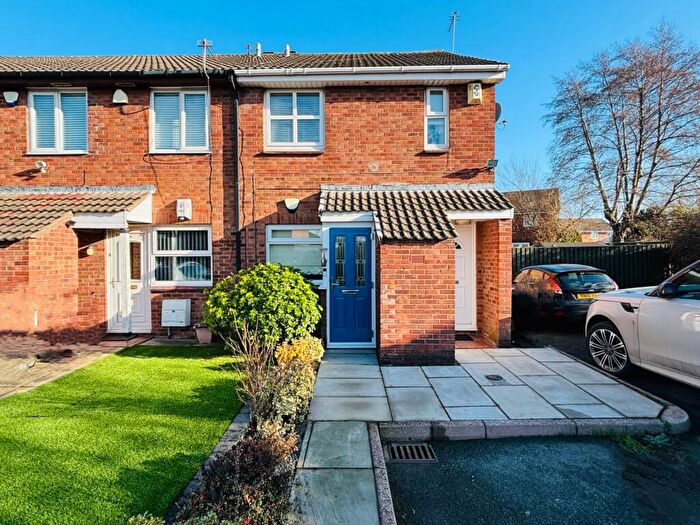
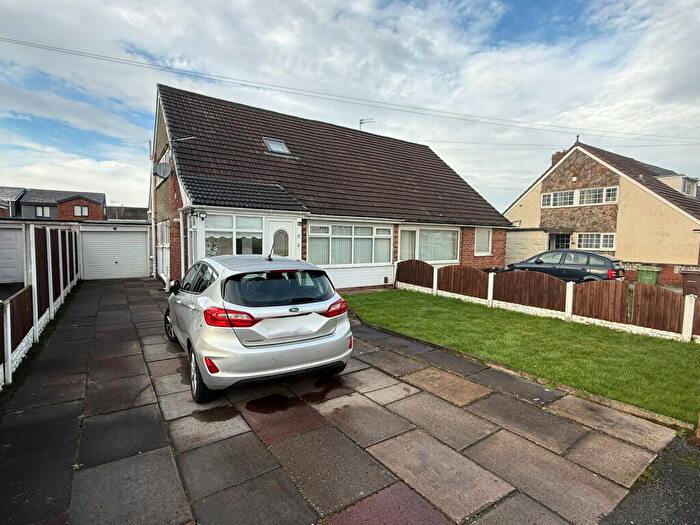
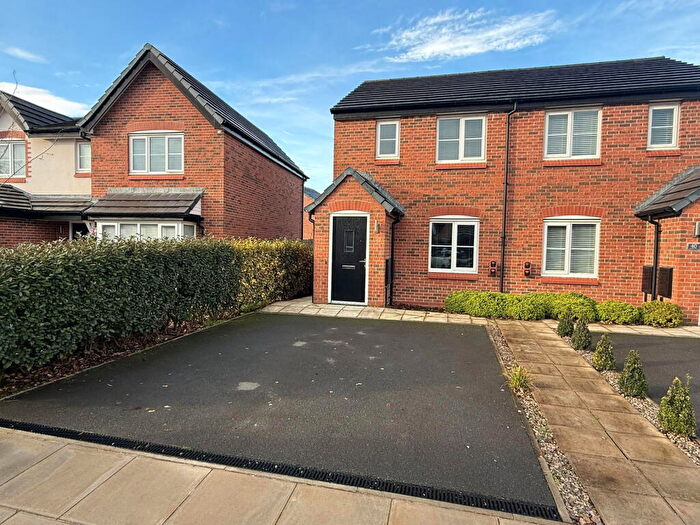
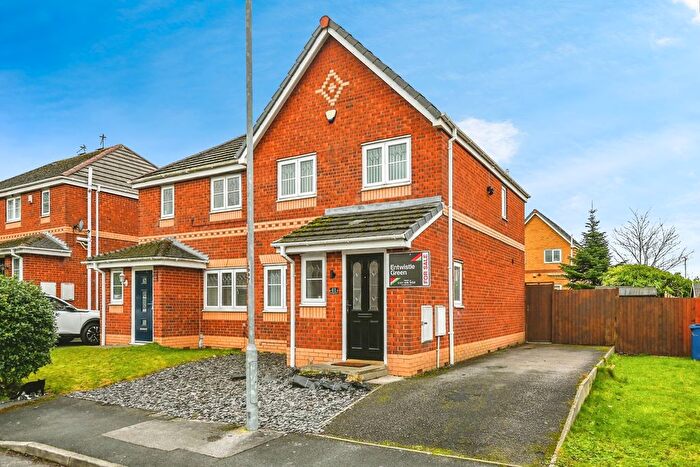
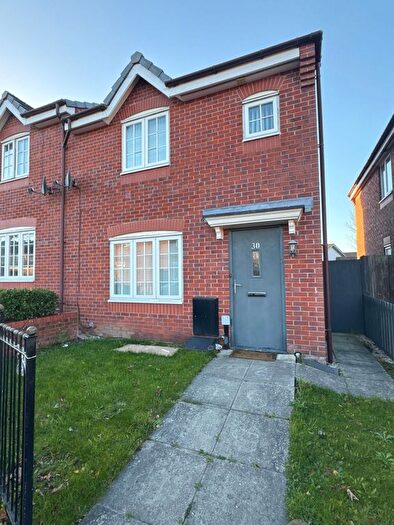
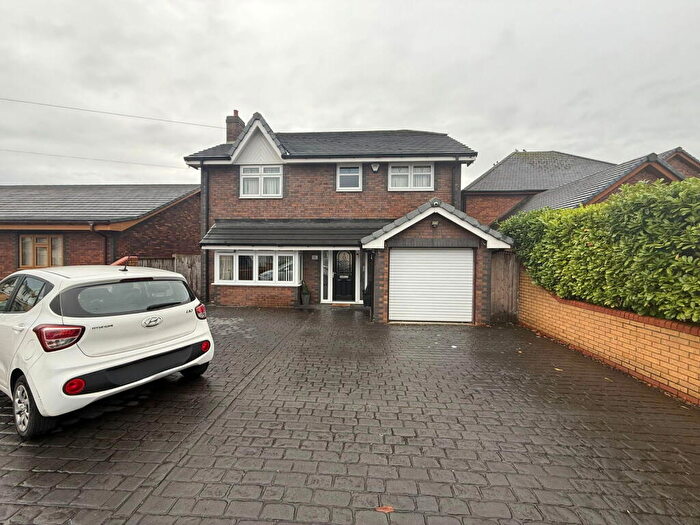
Properties for sale in Park
Roads and Postcodes in Park
Navigate through our locations to find the location of your next house in Park, Liverpool for sale or to rent.
| Streets | Postcodes |
|---|---|
| Ambleside Drive | L33 2EE L33 2EF |
| Apollo Crescent | L33 1YR |
| Ascot Drive | L33 1UU |
| Ashburn Avenue | L33 1WA |
| Ashley Close | L33 1UT |
| Ashwood Close | L33 1ZB |
| Balmoral Close | L33 1ZH |
| Bassenthwaite Avenue | L33 2DB |
| Beldale Park | L32 2DE |
| Benwick Road | L32 4SQ |
| Boyes Brow | L33 2DZ |
| Buttermere Close | L33 2DY |
| Chesterfield Drive | L33 1ZG |
| Chiltern Close | L32 2BP |
| Chiltern Drive | L32 2BN L32 2BW |
| Cleveland Close | L32 2BH |
| Conifer Close | L33 1US |
| Coniston Close | L33 2DA |
| Conway Close | L33 1ZW |
| Copthorne Road | L32 0RJ |
| Copthorne Walk | L32 0RL |
| Davenport Grove | L33 1TJ |
| Deerbolt Crescent | L32 2BE |
| Deerbolt Way | L32 2BT |
| Derwent Close | L33 2DD |
| Devonshire Close | L33 1WD |
| Ebony Way | L33 1ZQ |
| Ennerdale Close | L33 2DH |
| Farnworth Grove | L33 1TH |
| Glovers Brow | L32 2AD L32 2AF |
| Granborne Chase | L32 2DN L32 2DQ |
| Grantham Road | L33 1UN |
| Grasmere Close | L33 2DU |
| Green Gables | L33 2EH |
| Halton Wood | L32 2DH |
| Hanmer Road | L32 0RP |
| Haweswater Close | L33 2DJ |
| Heathfield Drive | L33 1WF |
| Houlston Road | L32 4SN L32 4SW |
| Houlston Walk | L32 4SL |
| Ivory Drive | L33 1ZA |
| Kendal Mews | L33 2EB |
| Kendal Road | L33 2ED |
| Kirkstead Walk | L31 1JP |
| Lingtree Road | L32 0RN L32 0RW |
| Linton Place | L32 0WA |
| Loweswater Way | L33 2DL |
| Lytham Court | L32 2DG |
| Malvern Close | L32 2BS |
| Melverley Road | L32 0RG L32 0RH |
| Mill Lane | L32 2AU L32 2AX |
| Mount Close | L32 2BQ |
| Mount Crescent | L32 2BA L32 2BB |
| Mount Road | L32 2AN L32 2AW |
| Nightingale Close | L32 2DL |
| North Mount Road | L32 2AZ |
| North Park Road | L32 2AR L32 2AS L32 2DP |
| Park Road | L32 2AL |
| Parkway West | L32 2BZ |
| Partridge Road | L32 2DJ |
| Penley Crescent | L32 0RR L32 0RS |
| Pennine Way | L32 2BJ L32 2BL |
| Peplow Road | L32 4SJ |
| Pickworth Way | L31 1JS |
| Pinewood Gardens | L33 1ZD |
| Redbrow Way | L33 1YL |
| Redmoor Crescent | L33 1YF |
| Rydal Close | L33 2DS |
| Sapphire Drive | L33 1UW |
| Seathwaite Crescent | L33 2DN L33 2DW |
| Sefton Close | L32 2AP |
| Sefton Drive | L32 2AJ |
| Shaftesbury Avenue | L33 1ZR |
| South Park Court | L32 2BD |
| South Park Road | L32 2AG L32 2AQ |
| Southney Close | L31 1JR |
| St Patricks Close | L33 1UR |
| St Pauls Close | L33 1ZS |
| St Peters Close | L33 1ZT |
| Station Mews | L32 2BR |
| Steeple View | L33 1ZE |
| Stretford Close | L33 1WE |
| Swinderby Drive | L31 1JW |
| Tallarn Road | L32 0RT |
| Thirlmere Walk | L33 2DP |
| Tudor View | L33 1UP |
| Ullswater Close | L33 2DX |
| Westfield Walk | L32 4SH |
| Whitefield Drive | L32 0RB L32 0RD |
| Willsford Avenue | L31 1JN L31 1JU |
| Windermere Drive | L33 2DE L33 2DF L33 2DG L33 2DQ L33 2DT |
| Windmill Close | L33 1UL |
Transport near Park
- FAQ
- Price Paid By Year
- Property Type Price
Frequently asked questions about Park
What is the average price for a property for sale in Park?
The average price for a property for sale in Park is £154,524. This amount is 15% lower than the average price in Liverpool. There are 656 property listings for sale in Park.
What streets have the most expensive properties for sale in Park?
The streets with the most expensive properties for sale in Park are Partridge Road at an average of £300,000, Swinderby Drive at an average of £284,750 and Granborne Chase at an average of £281,316.
What streets have the most affordable properties for sale in Park?
The streets with the most affordable properties for sale in Park are South Park Court at an average of £50,800, Melverley Road at an average of £89,375 and St Peters Close at an average of £98,000.
Which train stations are available in or near Park?
Some of the train stations available in or near Park are Kirkby (Merseyside), Maghull and Fazakerley.
Property Price Paid in Park by Year
The average sold property price by year was:
| Year | Average Sold Price | Price Change |
Sold Properties
|
|---|---|---|---|
| 2025 | £171,460 | 8% |
44 Properties |
| 2024 | £157,525 | 12% |
54 Properties |
| 2023 | £139,403 | -8% |
60 Properties |
| 2022 | £150,281 | 3% |
80 Properties |
| 2021 | £146,423 | 18% |
58 Properties |
| 2020 | £120,045 | -10% |
55 Properties |
| 2019 | £131,920 | 17% |
63 Properties |
| 2018 | £109,444 | -10% |
73 Properties |
| 2017 | £120,584 | 9% |
43 Properties |
| 2016 | £109,899 | 9% |
52 Properties |
| 2015 | £100,540 | -10% |
42 Properties |
| 2014 | £111,092 | -9% |
34 Properties |
| 2013 | £121,011 | 14% |
33 Properties |
| 2012 | £103,879 | 1% |
29 Properties |
| 2011 | £102,407 | -18% |
28 Properties |
| 2010 | £120,935 | 20% |
43 Properties |
| 2009 | £96,573 | -25% |
43 Properties |
| 2008 | £120,661 | -9% |
48 Properties |
| 2007 | £132,086 | 7% |
111 Properties |
| 2006 | £122,998 | 5% |
86 Properties |
| 2005 | £116,828 | 8% |
85 Properties |
| 2004 | £107,153 | 44% |
71 Properties |
| 2003 | £60,426 | -20% |
79 Properties |
| 2002 | £72,688 | 24% |
58 Properties |
| 2001 | £55,501 | -20% |
60 Properties |
| 2000 | £66,641 | 1% |
84 Properties |
| 1999 | £65,798 | 8% |
78 Properties |
| 1998 | £60,423 | 8% |
85 Properties |
| 1997 | £55,771 | -11% |
63 Properties |
| 1996 | £62,145 | 5% |
88 Properties |
| 1995 | £58,853 | - |
97 Properties |
Property Price per Property Type in Park
Here you can find historic sold price data in order to help with your property search.
The average Property Paid Price for specific property types in the last three years are:
| Property Type | Average Sold Price | Sold Properties |
|---|---|---|
| Semi Detached House | £171,468.00 | 50 Semi Detached Houses |
| Detached House | £251,948.00 | 26 Detached Houses |
| Terraced House | £123,504.00 | 66 Terraced Houses |
| Flat | £71,218.00 | 16 Flats |

