
Houses for sale & to rent in Liverpool, Knowsley
House Prices in Liverpool
Properties in Liverpool have an average house price of £182k and had 3,952 Property Transactions within the last 3 years.¹
Liverpool is an area in Knowsley with 48,367 households², where the most expensive property was sold for £750k.
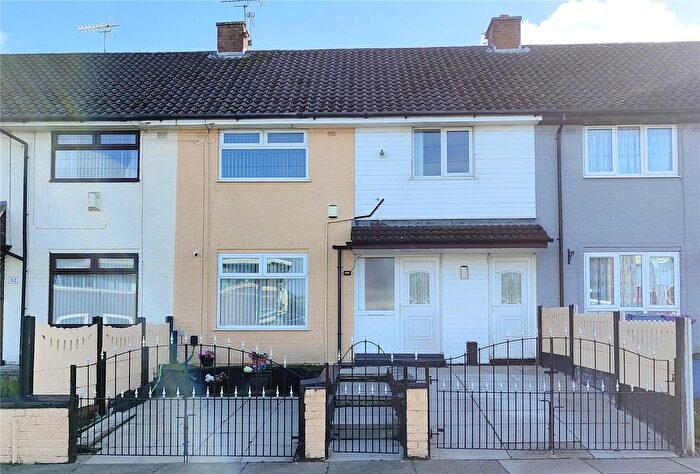
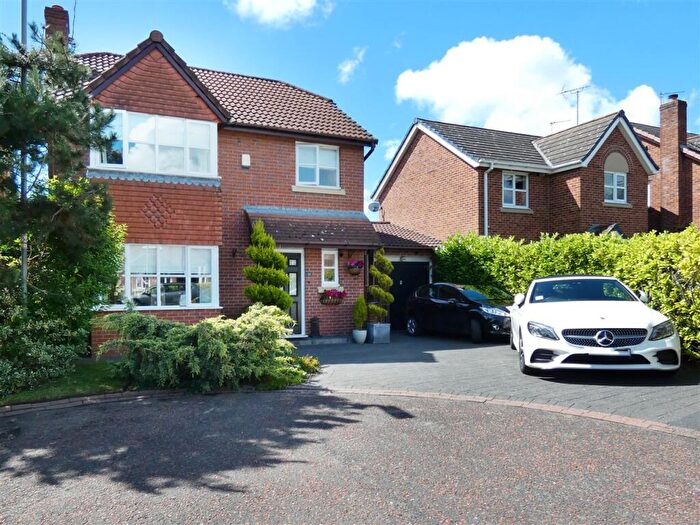
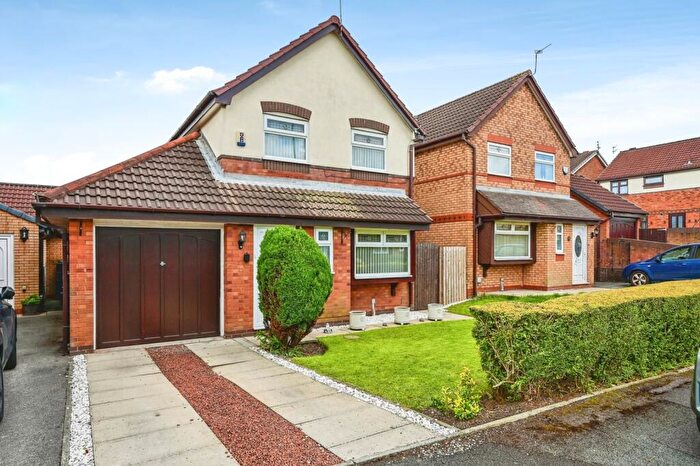
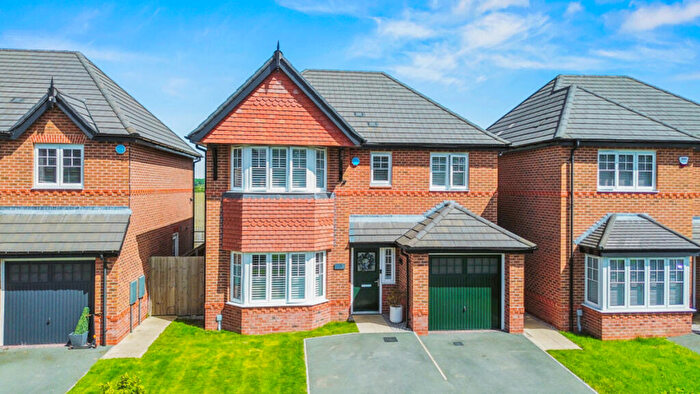
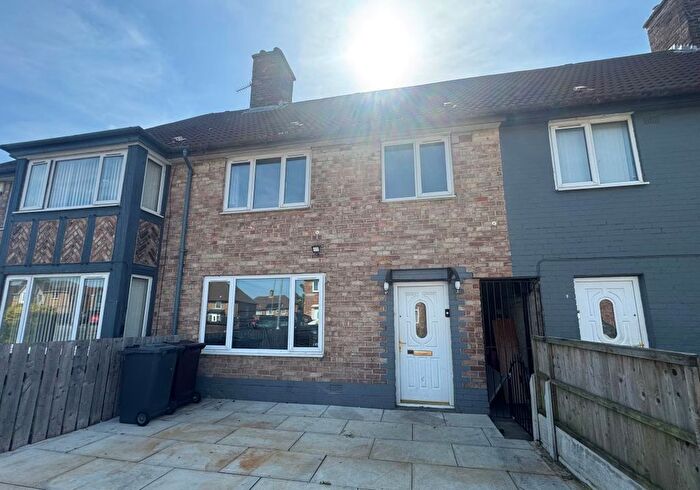
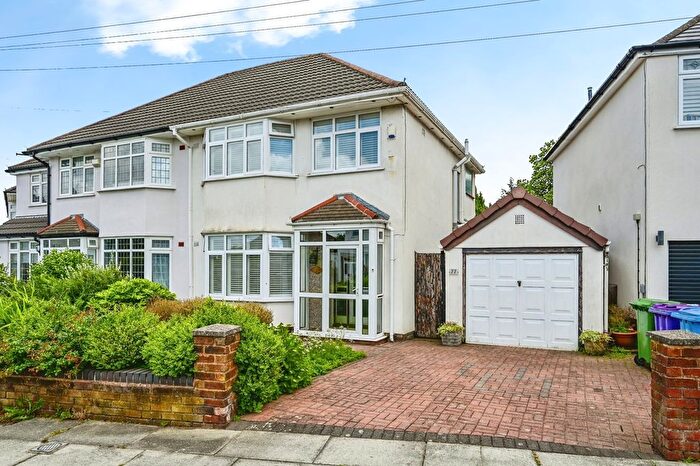
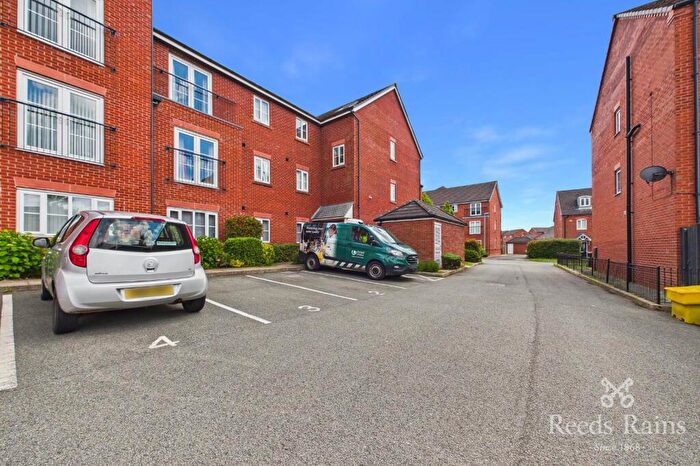
Properties for sale in Liverpool
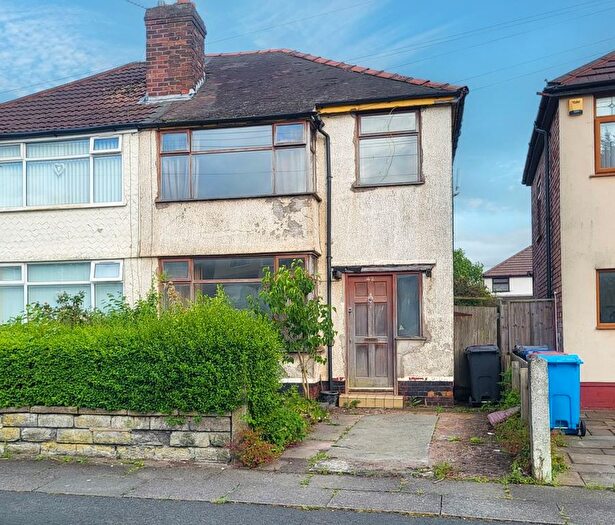
![]()
If you are looking to sell your house, let it out, or receive a property valuation, an expert can help you.
Click the button below to get started.

Neighbourhoods in Liverpool
Navigate through our locations to find the location of your next house in Liverpool, Knowsley for sale or to rent.
Transport in Liverpool
Please see below transportation links in this area:

- FAQ
- Price Paid By Year
- Property Type Price
Frequently asked questions about Liverpool
What is the average price for a property for sale in Liverpool?
The average price for a property for sale in Liverpool is £181,650. This amount is 2% lower than the average price in Knowsley. There are more than 10,000 property listings for sale in Liverpool.
What locations have the most expensive properties for sale in Liverpool?
The locations with the most expensive properties for sale in Liverpool are Roby at an average of £279,679, Halewood North at an average of £245,122 and Swanside at an average of £219,990.
What locations have the most affordable properties for sale in Liverpool?
The locations with the most affordable properties for sale in Liverpool are Whiston North at an average of £120,833, Kirkby Central at an average of £131,401 and Whitefield at an average of £137,910.
Which train stations are available in or near Liverpool?
Some of the train stations available in or near Liverpool are Roby, Huyton and Broad Green.
Property Price Paid in Liverpool by Year
The average sold property price by year was:
| Year | Average Sold Price | Price Change |
Sold Properties
|
|---|---|---|---|
| 2026 | £179,558 | -5% |
77 Properties |
| 2025 | £188,451 | 5% |
1,252 Properties |
| 2024 | £178,203 | -0,3% |
1,336 Properties |
| 2023 | £178,738 | 1% |
1,287 Properties |
| 2022 | £176,485 | 7% |
1,636 Properties |
| 2021 | £164,388 | 6% |
1,857 Properties |
| 2020 | £154,582 | 4% |
1,548 Properties |
| 2019 | £149,155 | 6% |
1,847 Properties |
| 2018 | £140,733 | -1% |
1,829 Properties |
| 2017 | £142,819 | 10% |
1,695 Properties |
| 2016 | £128,436 | 5% |
1,428 Properties |
| 2015 | £122,519 | 6% |
1,362 Properties |
| 2014 | £115,735 | -0,4% |
1,219 Properties |
| 2013 | £116,198 | 3% |
927 Properties |
| 2012 | £112,555 | 1% |
681 Properties |
| 2011 | £110,985 | 1% |
670 Properties |
| 2010 | £109,464 | -2% |
593 Properties |
| 2009 | £111,431 | -9% |
620 Properties |
| 2008 | £121,592 | -2% |
873 Properties |
| 2007 | £123,585 | 1% |
1,991 Properties |
| 2006 | £122,191 | - |
1,899 Properties |
| 2005 | £122,252 | 12% |
1,686 Properties |
| 2004 | £108,143 | 24% |
2,071 Properties |
| 2003 | £81,778 | 23% |
2,112 Properties |
| 2002 | £63,140 | 9% |
1,824 Properties |
| 2001 | £57,756 | 2% |
1,541 Properties |
| 2000 | £56,359 | 5% |
1,595 Properties |
| 1999 | £53,641 | 3% |
1,479 Properties |
| 1998 | £51,965 | 8% |
1,375 Properties |
| 1997 | £47,694 | -2% |
1,325 Properties |
| 1996 | £48,580 | -0,1% |
1,462 Properties |
| 1995 | £48,625 | - |
1,349 Properties |
Property Price per Property Type in Liverpool
Here you can find historic sold price data in order to help with your property search.
The average Property Paid Price for specific property types in the last three years are:
| Property Type | Average Sold Price | Sold Properties |
|---|---|---|
| Semi Detached House | £190,754.00 | 1,671 Semi Detached Houses |
| Terraced House | £138,947.00 | 1,458 Terraced Houses |
| Detached House | £288,096.00 | 611 Detached Houses |
| Flat | £96,794.00 | 212 Flats |