
Houses for sale in Lancashire, England
House Prices in Lancashire
Properties in Lancashire have
an average house price of
£210k
and had 59,774 Property Transactions
within the last 3 years.¹
Lancashire is a location in
England with
526,698 households², where the most expensive property was sold for £3.5M.
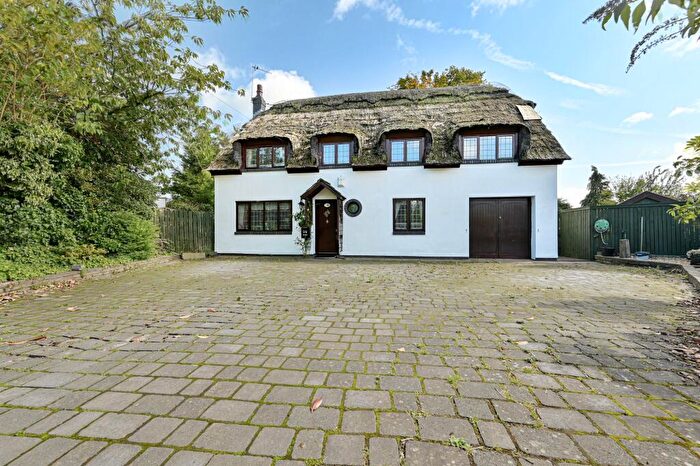
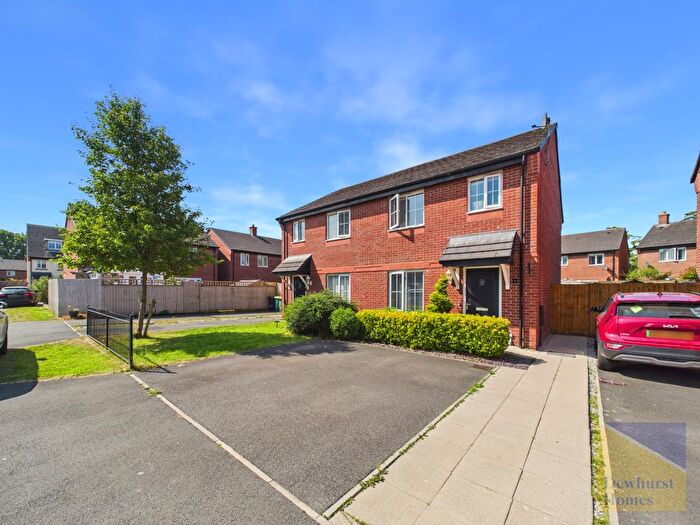
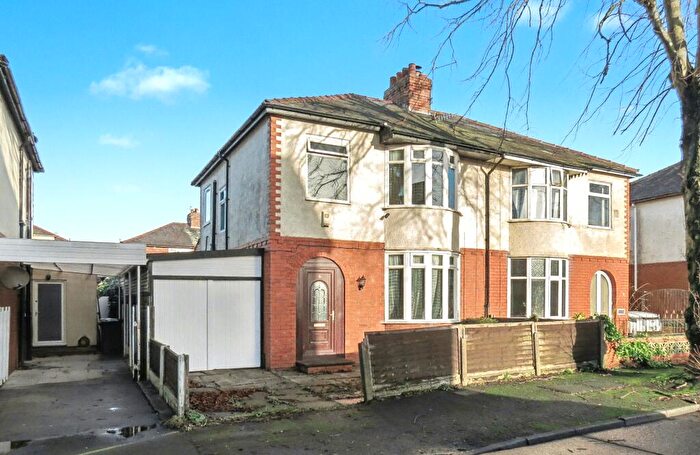
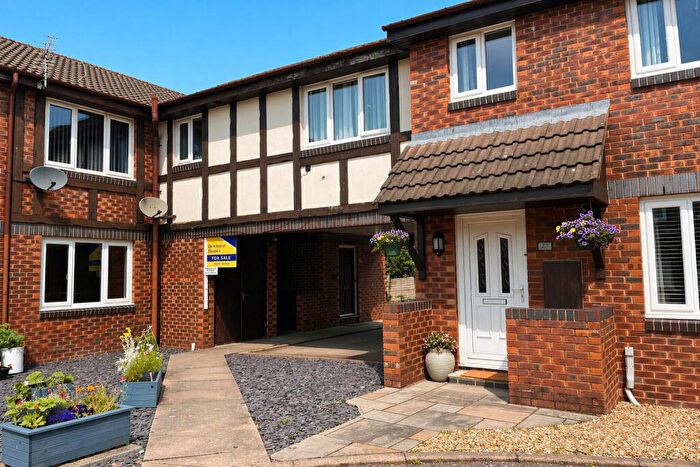
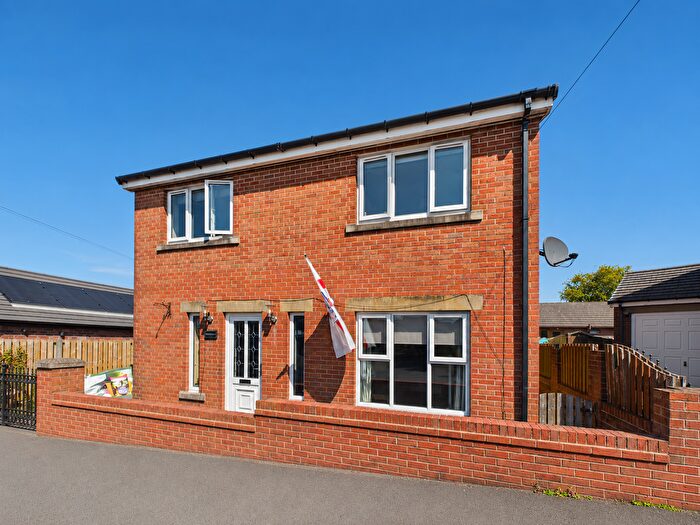
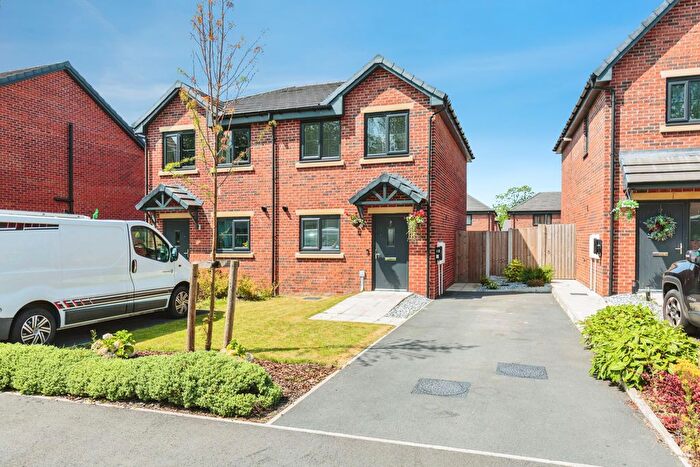
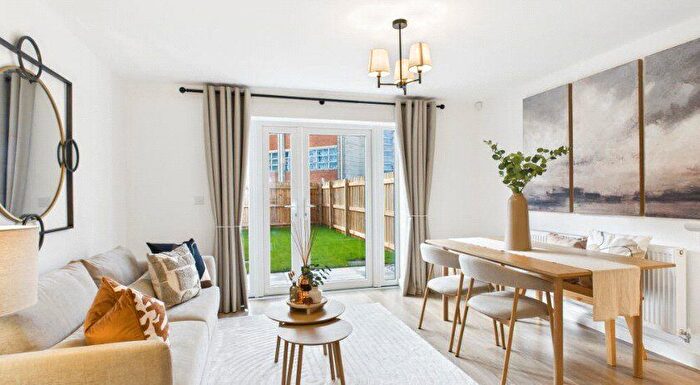
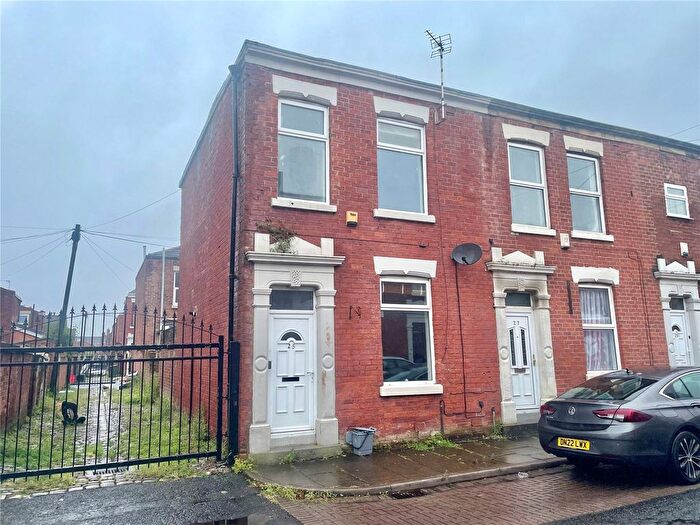
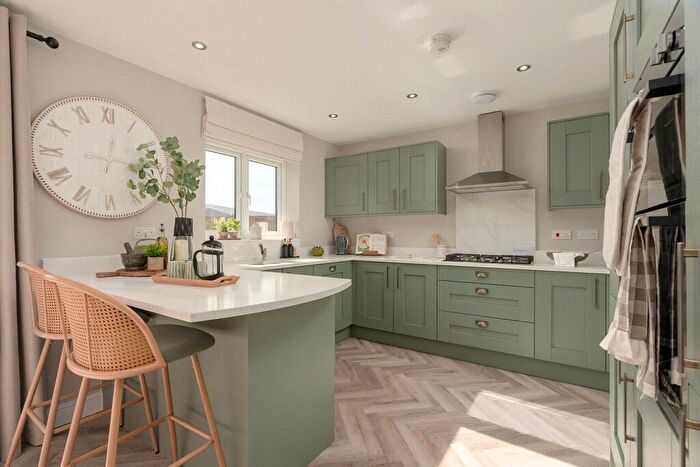
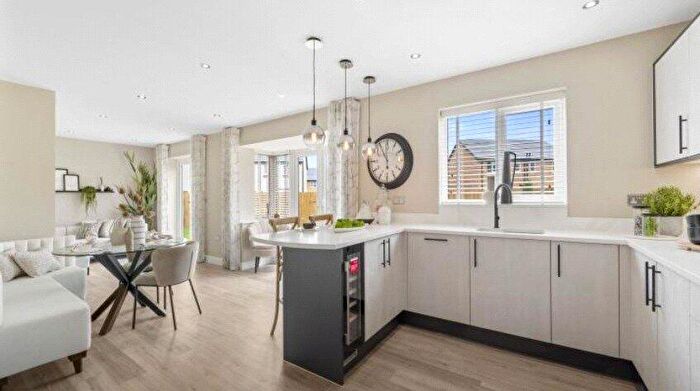
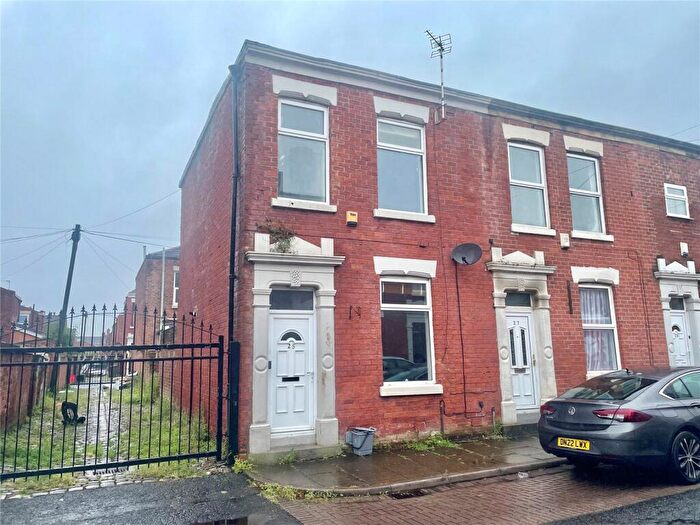
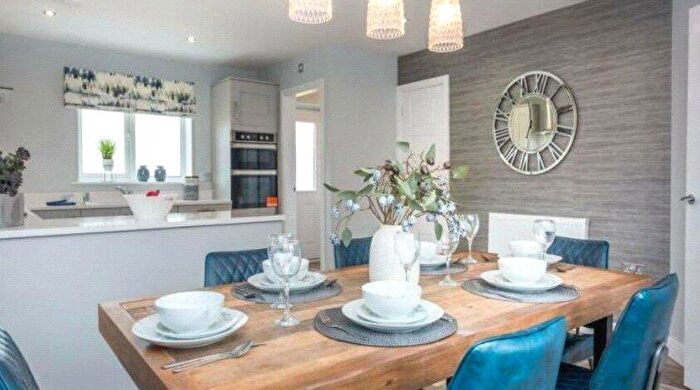
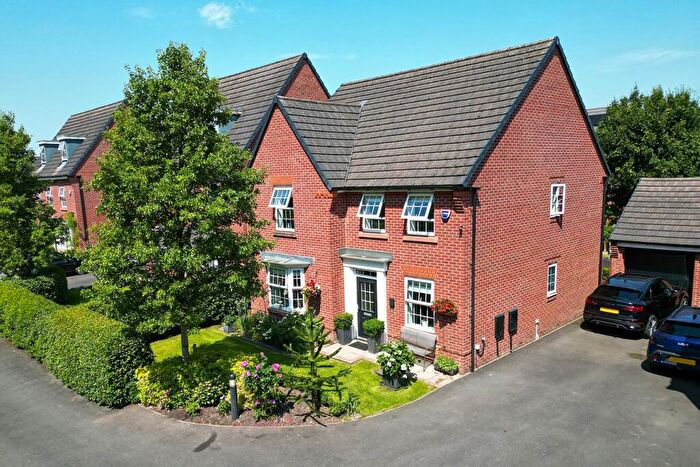
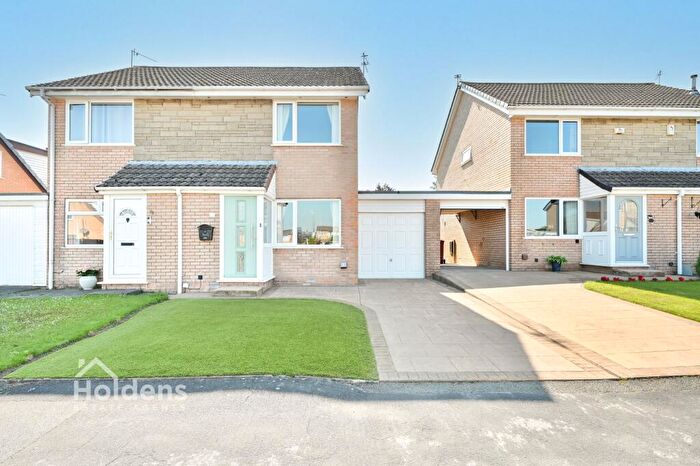
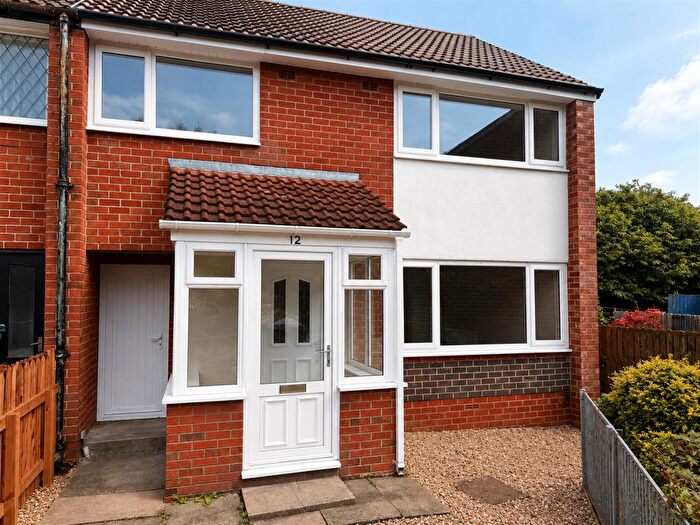
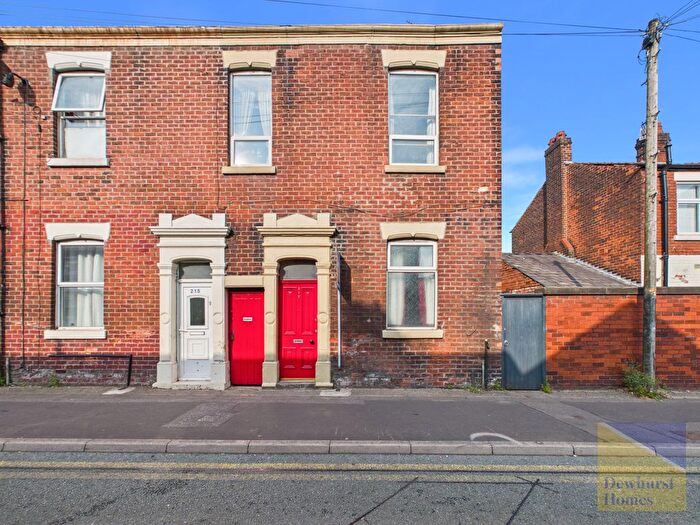
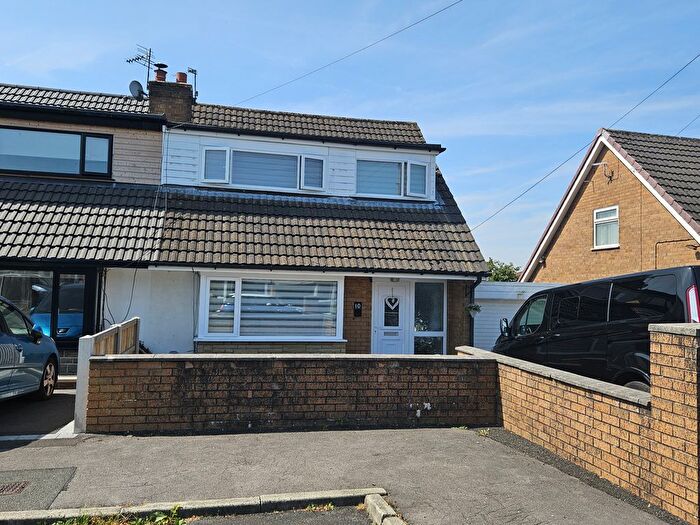
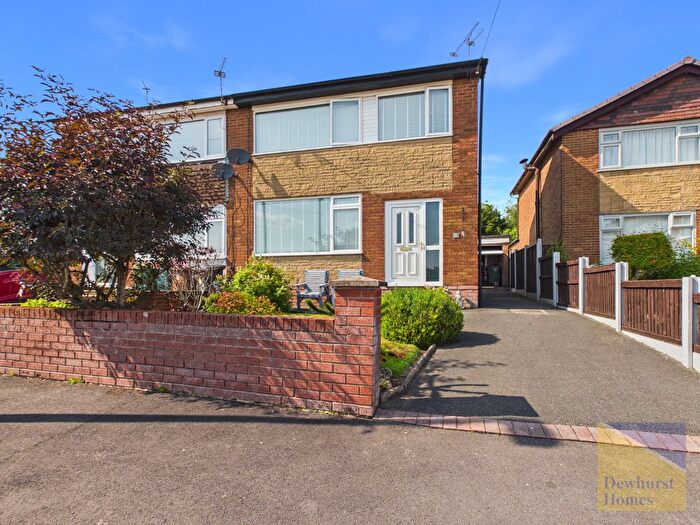
Properties for sale in Lancashire

![]()
If you are looking to sell your house, let it out, or receive a property valuation, an expert can help you.
Click the button below to get started.

Towns in Lancashire
Navigate through our locations to find the location of your next house in Lancashire, England for sale or to rent.
- Blackburn
- Barnoldswick
- Fleetwood
- Southport
- Thornton-cleveleys
- St. Helens
- Lytham St Annes
- Carnforth
- Burnley
- Rochdale
- Leyland
- Skipton
- Liverpool
- Colne
- Bury
- Blackpool
- Morecambe
- Todmorden
- Rossendale
- Preston
- Clitheroe
- Lancaster
- Bacup
- Bolton
- Ormskirk
- Poulton-le-fylde
- Chorley
- Darwen
- Nelson
- Skelmersdale
- Wigan
- Accrington
Property price trends in Lancashire
According to the latest Land Registry data, the average home in Lancashire sold for £212,511 in 2026. That figure comes from a substantial record of 681,231 sales logged over the past 31 years.
Prices have moved up over the last three years. Compared with 2023, when the typical sale came in around £202,931, that's a rise of roughly 4.7%.
Looking back five years, average prices are up about 6.8% since 2021, a gain of around £13,599 in cash terms.
Zoom out to the past decade for the fuller picture. Back in 2016, homes here averaged £164,756, so the typical sold price has climbed about 29% since then, roughly 2.6% a year. Stretch the view to fifteen years and that annual pace holds at about 2.4%.
Frequently asked questions about Lancashire
What is the average price for a property for sale in Lancashire?
The average price for a property for sale in Lancashire is £210,150. This amount is 41% lower than the average price in England. There are more than 10,000 property listings for sale in Lancashire.
What locations have the most expensive properties for sale in Lancashire?
The locations with the most expensive properties for sale in Lancashire are Skipton at an average of £573,028, Bolton at an average of £437,333 and Liverpool at an average of £390,600.
What locations have the most affordable properties for sale in Lancashire?
The locations with the most affordable properties for sale in Lancashire are Nelson at an average of £132,794, Burnley at an average of £135,605 and Accrington at an average of £136,683.
Which train stations are available in or near Lancashire?
Some of the train stations available in or near Lancashire are Preston, Bamber Bridge and Pleasington.
Property Price Paid in Lancashire by Year
The average sold property price by year was:
| Year | Average Sold Price | Price Change |
Sold Properties
|
|---|---|---|---|
| 2026 | £212,511 | -2% |
3,403 Properties |
| 2025 | £216,739 | 3% |
19,551 Properties |
| 2024 | £209,664 | 3% |
19,149 Properties |
| 2023 | £202,931 | 0,1% |
17,671 Properties |
| 2022 | £202,713 | 2% |
22,275 Properties |
| 2021 | £198,912 | 6% |
26,769 Properties |
| 2020 | £186,026 | 6% |
20,166 Properties |
| 2019 | £174,957 | 2% |
22,622 Properties |
| 2018 | £171,897 | 2% |
22,527 Properties |
| 2017 | £168,376 | 2% |
22,794 Properties |
Property Price per Property Type in Lancashire
Here you can find historic sold price data in order to help with your property search.
The average Property Paid Price for specific property types in the last three years are:
| Property Type | Average Sold Price | Sold Properties |
|---|---|---|
| Semi Detached House | £211,583.00 | 19,169 Semi Detached Houses |
| Terraced House | £135,896.00 | 23,113 Terraced Houses |
| Detached House | £373,050.00 | 12,795 Detached Houses |
| Flat | £125,935.00 | 4,697 Flats |
Transport in Lancashire
Please see below transportation links in this area:
